Keywords
CT images, liver lesion extraction, anisotropic diffusion filter, morphological filters, contraste filter, watershed algorithm.
Introduction
Extraction of a lesion, such as those seen in liver metastasis, from a given image is an essential process for computer-aided diagnosis and computer-aided surgery. In order to improve the curability of liver cancer, early detection and accurate staging are critical. Knowing the stage helps the physician to predict the patient’s prognosis and consequently to decide what type of treatment is best suited. Moreover, a proper estimation of the tumor size is useful for several applications such as evaluating the effect of therapies on tumor and changing the treatment plans. Segmentation algorithms are very helpful in the tumor volume estimation. Although many research groups have developed different approaches for liver segmentation in the last few years [1-7], only few ones are dedicated to the hepatic lesions segmentation. Jianhua, Liu et al. [8] used the watershed algorithm and region merging approach to achieve an effective segmentation for liver cancer CT image. Nader, H. et al. [9] developed an automatic technique to segment the tumors in liver structure. They have applied the contrast enhancement to the slices of segmented liver. Jia-Yin, Zhou et al. [10], proposed an approach for liver tumors segmentation using contrast-enhanced and multi-detector CT data. They have exploited three semi-automated methods to improve their algorithm performance.
Kumar, S. S. et al. [11], presented a method for liver lesion segmentation. Their method is based on the confidence connected region growing after applying pre-processing and post-processing operation to achieve an automatic segmentation of liver. Then, they used an alternative Fuzzy C-Means clustering in order to get the lesion segmentation.
In this article, we focus on the segmentation of liver metastases in CT scans using mathematical morphology, especially the watershed approach. One effective approach is extracting the organ before lesion extraction. This operation is realised by the morphological reconstruction. Then, we seek to detect the hepatic lesions. The gray values of parenchyma and metastases in the liver are not fixed but depend on contrast agent, scan parameters, patient conditions... In addition, the problems caused by surrounding tissues and wide variation in lesion characteristics, complicate the lesion extraction task. Therefore, the objective of our work is to enhance the contrast of either CT image or image gradient containing liver and tumor. Besides, we search to get the finest internal and external markers of the hepatic lesions in order to facility and augment the accuracy of the lesion detection.
The paper is organized as follows: the following section is devoted to the description of the watershed algorithm that is the key of our segmentation method. The segmentation algorithm will be detailed in the next section. Finally, the results are presented in the last section.
The watershed transform
The watershed transform is a key building block for morphological segmentation [12]. Watershed algorithm is a good choice for the high resolution image with large amount of data because of its fast segmentation speed [13]. Its intuitive idea originates from the topography. Indeed, images are considered as a topology relief in the topography Fig. 1. [8]. The Watershed was introduced by Beucher and Lantuejoul [14]. This method is based on the immersion process analogy, in which the flooding of the water in the image is efficiently simulated using a queue of pixels [15]. The advantage of watershed transform is related to the fact that resulted small pieces have closed boundaries.
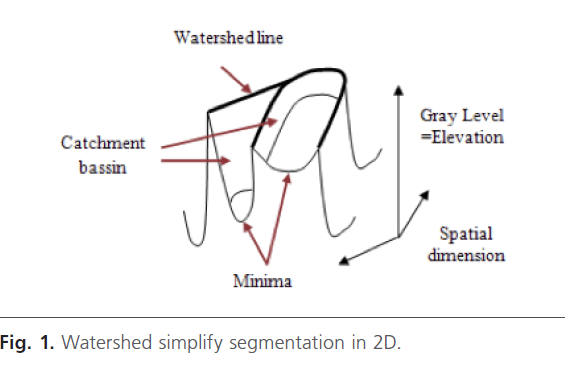
Fig 1: Watershed simplify segmentation in 2D.
Implementation of the proposed method based on watershed segmentation
The block diagram of the proposed method is shown in Fig. 2. Each block will be explained in the following sections:
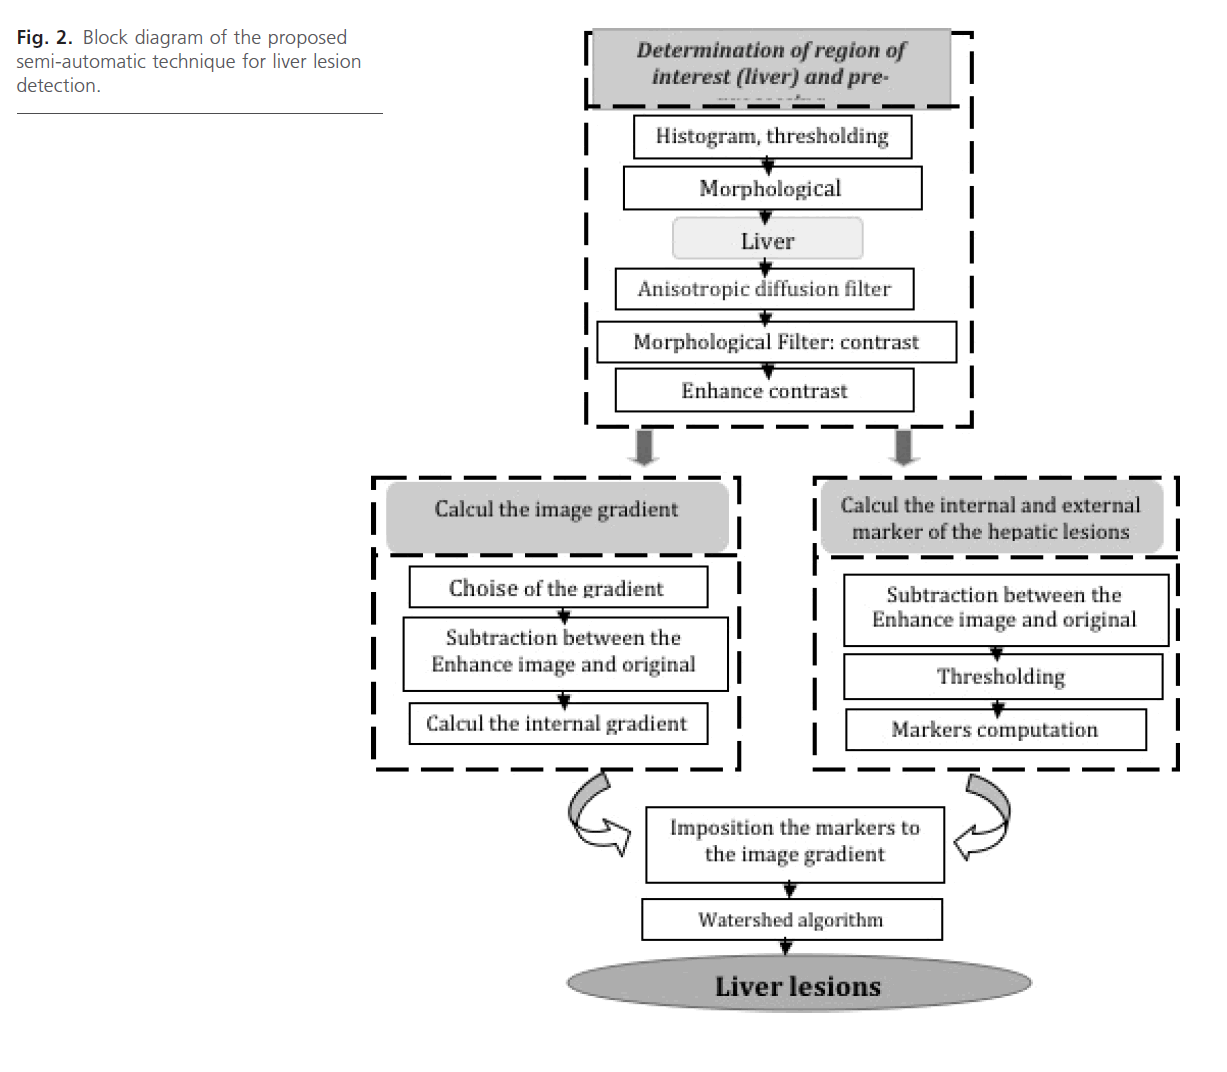
Fig 2: Block diagram of the proposed semi-automatic technique for liver lesion detection.
Pre-segmentation
Our approach for semi-automatic liver lesions segmentation consists of the following stages: at first, the liver contour is extracted from the image. Next, we seek to enhance, and improve visibility of Liver lesions in CT images.
Extraction of the Liver
In our approach, we select a slice where the liver appears as the biggest organ. Indeed, the liver structure is firstly segmented from the original CT image in order to get a new image which only includes the liver region with tumors. This operation is realised by the morphological reconstruction.
Liver detection could be done semi-automatically Fig. 2. In fact, to ensure an excellent extraction of the region of interest R.O.I, it is necessary to make a judicious choose of the manually threshold. This parameter changes from the image to another. The second parameter which will be set by the manipulator is the h parameter of the contrast filter (H-maximum transform) in order to calculate the internal and external marker of the lesion.
• Morphological Reconstruction by dilatation.
This technique is considered as a nonlinear filter based on mathematic morphology. It is one of the most used tools to build component filters [12].
Let g (x, y) and f (x, y) are two images with same size, g is called marker and f is called mask. For each corresponding point (x, y), we have g (x, y) <= f (x, y). According to [15], the elementary geodesic dilation for marker g under mask f is given by:
 (1)
(1)
Here  is the grayscale dilation for g, B is the structuring element, and the value stands for the point wise minimum.
As mentioned in [15], the morphological reconstruction of mask f from marker g is obtained by iterating grayscale geodesic dilations of g “under” f until stability is reached:
 (2)
(2)
 represents continually n times of the elementary geodesic dilation for f under g.
We know that the liver occupies the majority of right half of corresponding abdominal section Fig. 3a. In this case, the histogram has a major peak Fig. 3b, which includes majority of pixels being corresponded to the liver ROI. A thresholding process is applied in order to separate the liver from the bottom Fig. 3c. Next, an erosion operation, with a disc-structuring element, is used to disconnect and remove neighboring structures connected to the liver. After, the morphological reconstruction by dilation is done to detect the liver and removing the other organ Fig. 3d. Indeed, undesirable regions are eliminated without considerably affecting the remaining structures. After, we apply a space filtering by anisotropic diffusion filter
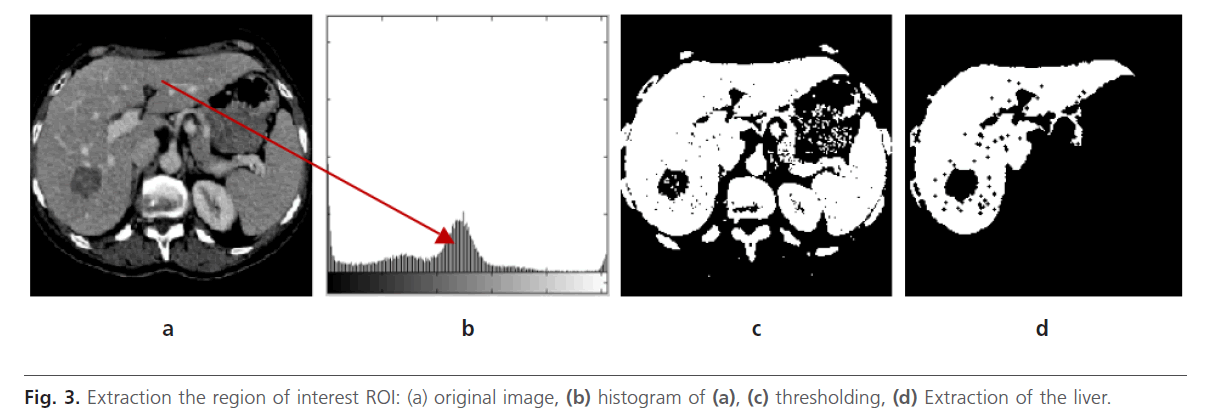
Fig 3: Extraction the region of interest ROI: (a) original image, (b) histogram of (a), (c) thresholding, (d) Extraction of the liver.
Hepatic lesions segmentation
Using the liver data obtained (last section), anisotropic diffusion filter based de-noising algorithm is used for removing the noise from the liver images:
Pre-processing and contrast enhancement
• Anisotropic diffusion filter.
In order to increase the speed and accuracy of liver lesion segmentation, the abdominal CT image is preprocessed. Anisotropic diffusion filter is applied across the entire image to reduce the granular noise present in the CT slice image and ensure boundary preservation Fig. 5a. This type of filter is used because convolution and rank filters (median filter, mean filter, etc.) reduced the image noise, but they did not preserve the details and tend to blur the edges [16].
In [14], the anisotropic diffusion is defined as follows:
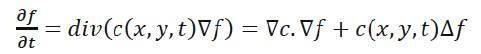 (3)
(3)
Where Δ denotes the Laplacian, ∇ denotes the gradient, div (·) is the divergence operator, t is the iteration step, and c (x, y, t) is the diffusion function which controls the rate of diffusion. In our developed algorithm, the diffusion function suggested by Perona and Malik is used [14]. It is given by the following equation:
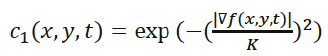 (4)
(4)
Where, K is referred to as the diffusion constant or the flow constant and it controls the filter’s behavior.
The anisotropic diffusion filter decreases the over-segmentation resulting from the application of the Watershed method. This type of filtering is interesting especially when the image is noised Fig. 5a.
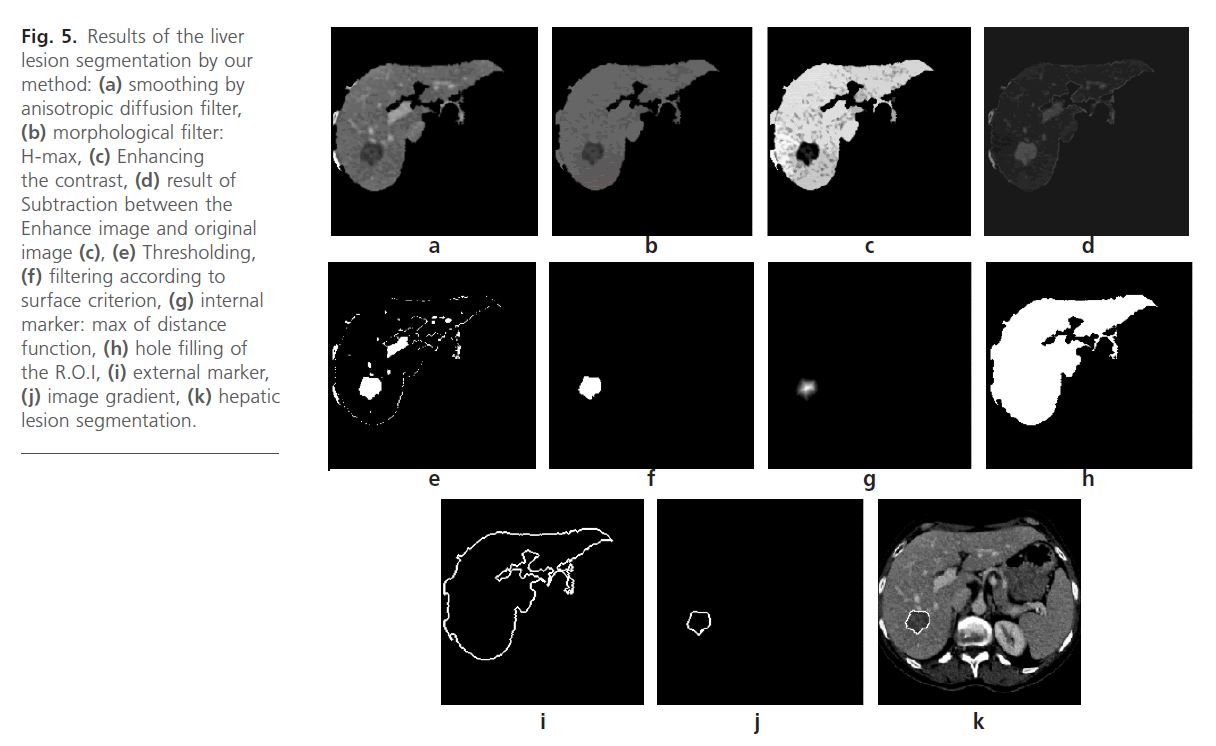
Fig 5: Results of the liver lesion segmentation by our method: (a) smoothing by anisotropic diffusion filter, (b) morphological filter: H-max, (c) Enhancing the contrast, (d) result of Subtraction between the Enhance image and original image (c), (e) Thresholding, (f) filtering according to surface criterion, (g) internal marker: max of distance function, (h) hole filling of the R.O.I, (i) external marker, (j) image gradient, (k) hepatic lesion segmentation.
• Contrast filter.
The aim of this stage is to improve and reduce the noisy artifacts while preserving; as much as possible; the original image structures to facilitate the liver lesion segmentation. In order to achieve this goal, different morphological filters have been applied to improve the original image. These filters are morphological reconstruction filter and the contrast filter. The liver structure is extracted from the CT image and improved by a nonlinear diffusion Fig. 5a. This operation is followed by morphological filter such as the H-maxima transform filter that it is considered as one of the contrasts filters type.
H-maximum transform or h-max: in medical imagery, the contrast filters can be used to emphasize dark zones surrounded by clear zones (tumor, cyst…) [18].
This filter suppresses all maxima in the intensity image whose height is less than a threshold h Fig. 4. H-domes or H-max are eliminated by a geodesic reconstruction by dilation from (f-h) in f [18]. This parameter is fixer manually because image’s characteristics change from one image to another.
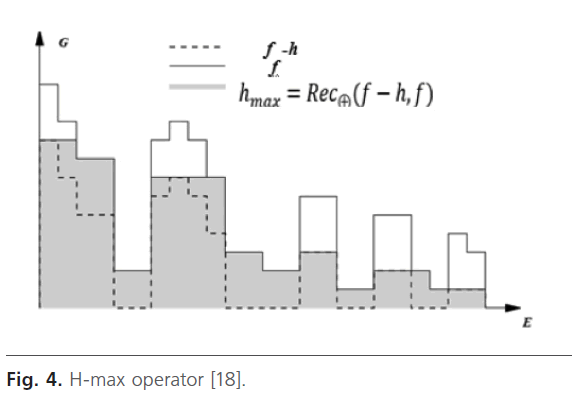
Fig 4: H-max operator [18].
This kind of filter permit to eliminate the contrast zones as the vessel Fig. 5b. The choice of the parameter h is important in order to ensure an excellent suppression of the contrast objects.
• Contrast enhancement.
It is frequently referred as one of the most important issues in medical image processing. Several previous studies proved that contrast enhancement techniques capable to clean up the unwanted noises and enhance the images brightness and contrast. Contrast stretching is used to increase the difference between liver and hepatic lesions Fig. 5c. Among the contrast stretching methods, we can cite the histogram equalization and intensity Adjustment.
Histogram equalization: histogram equalization is one of the most useful forms of non-linear contrast enhancement. Contrast is increased at the most populated range of brightness values of the histogram [19].
Intensity adjustment is an image enhancement technique. This approach is used to improve an image. The brightness of the image depends on the value associated with the pixel of the image. Adding a constant value to each every pixel of the image will increase the intensity of the image. Similarly the brightness can be decreased by subtracting a constant value from each and every pixel of the image Fig. 5c. [20].
Markers computation and calculation of the image gradient
After determination of region of interest (liver) by application of the morphological reconstruction, pre-processing by a nonlinear filters and morphological filters, contrast enhancement, the next step consist to find the best marker of the liver lesion and computing the image gradient.
Direct application of the watershed transform to a gradient image usually leads to over-segmentation. This problem is produced by great number of minima embedded in the image or its gradient. We can solve this problem by a primary selection of the markers pointing the region of interest R.O.I.
• Markers computation.
the first technique to avoid the over-segmentation problem is to use markers to impose the certain catchment basin. To calculate the internal and external marker of the lesion, we propose the following stages:
• Extraction of the Liver R.O.I. Fig. 3d.
• Smoothing R.O.I by Anisotropic diffusion filter Fig. 5a.
• Application the contrast filters (H-maxima transform filter) Fig. 5b.
• Enhancing the contrast of the R.O.I Fig. 5c.
• Subtraction between the Enhance image and original image Fig. 5d.
• Thresholding Fig. 5e. This operation will be followed by a filtering according to surface criterion to eliminate the pixels insulated Fig. 5f.
• Markers computation: we calculate the distance function Fig. 5g. The internal marker is the maximum of the distance function.
To calculate the external marker, we use the connected component corresponding to the liver. We relate hole filling Fig. 5h. A dilation operation is applied to this result with a discstructuring element where the radius equal to 8. The external marker is calculated by the morphological gradient Fig. 5i.
• Calculation of the image gradient.
the watershed algorithm is usually carried out in the gradient image. Some commonly used gradient operators are: morphological gradient, internal gradient and external gradient. In this paper, the internal gradient delimits the inside of the object. the internal gradient is done by: 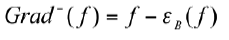
Where:
f: original image and εB erosion by structuring element B.
The result of segmentation depends on the method of computing the gradient. The morphology, the size, shape and direction of structuring element are important factors to have proper output [21]. If it is large, the output of gradient operator for a ramp edge is equal to the edge height.
However, if the structure element is small, this gradient operator has a high spatial resolution, but produces a low output value for ramp edges [22]. To prevent this problem, morphological gradient modification method can be employed. Zheng, Wei et al. [22], Xiaoyan, Zhan [15] used multiscale gradient. To calculate the internal gradient, we propose the following stages:
• Extraction of the Liver R.O.I. Fig. 3d.
• Smoothing R.O.I by Anisotropic diffusion filter Fig. 5a.
• Application of the contrast filters (H-maxima transform filter) Fig. 5b.
• Enhancing the contrast of the R.O.I Fig. 5c.
• Subtraction between the Enhance image and original image Fig. 5d. Thresholding Fig. 5e. This operation will be followed by a filtering according to surface criterion to eliminate the insulated pixels Fig. 5f.
• Calculating the internal gradient Fig. 5j.
Finely, we apply the watershed algorithm controlled with marker, Fig. 5k, Fig. 6.
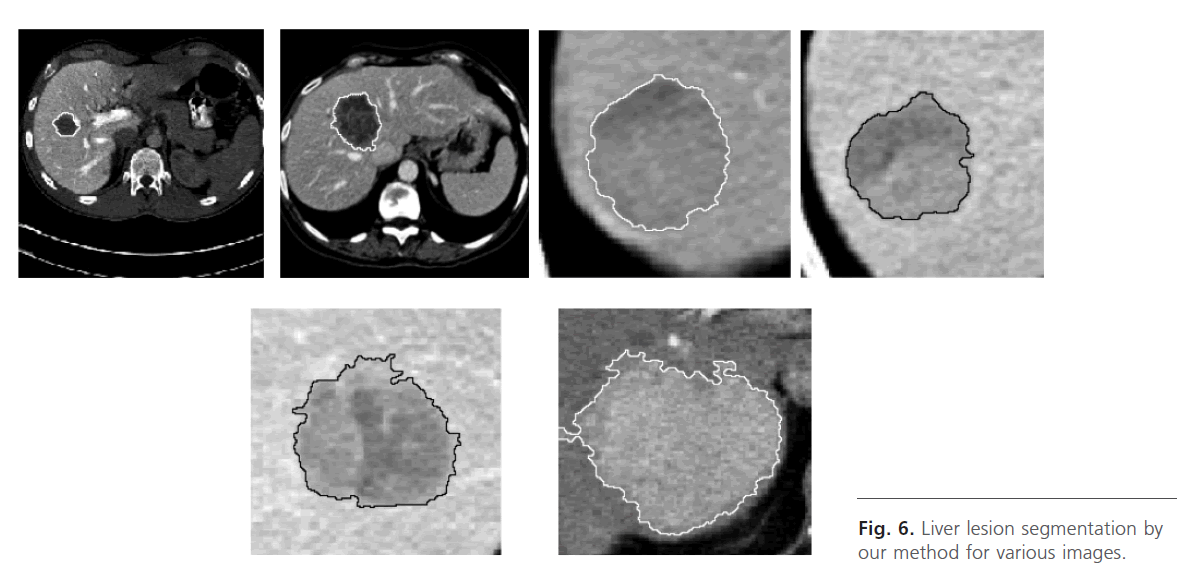
Fig 6: Liver lesion segmentation by our method for various images.
Result and discussion
In this work we have developed a semi-automatic segmentation of liver lesions. It is based on the mathematical morphology, especially on the watershed technique. At first we try to extract the liver through the application of morphological filters. Then we try to improve the original image and image gradient. We seek to determinate the internal and external marker of the liver lesions. In addition, we search to calculate the image gradient.
To evaluate the developed algorithm, several images obtained by the means of scanner X are used. The images were acquired by different clinics and scanners. The proposed algorithm has been tested on CT images collected from radiological department of Tlemcen University Hospital and Beni-Saf Hospital (Algeria).
They are non-contrast-enhanced and there was no previous assumption about shape, size, location, and intensity range of the Liver and liver lesions.
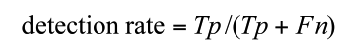
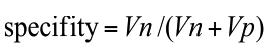
Annotations of the tumor boundaries in all images were also provided by the expert clinician and used as golden truth, in order to evaluate qualitatively and quantitatively the results of applying our method for liver lesions segmentation. We evaluated our algorithm on datasets by computing two parameters: sensitivity (detection rate), specificity as defined in Equations (5) to (6).
 (5)
(5)
 (6)
(6)
Where Tp: the number of true positive, Tn: the number of true negative, FP: the number of the false positive and Fn is the number of the false negative.
The suggested technique gives promising results. Sensitivity and specificity for semi-automatic liver lesion segmentation are 92% and 99% respectively.
According to the obtained result, the developed algorithm shows good performances which make it use very interesting. However, in some cases; the results are not satisfactory. This is due to the low contrast of the interest region as is illustrated in Fig. 7b. This is can lead to incorrect Liver lesion segmentation due to the fact that contrast boundaries are not clear Fig. 7.a. Our method handles other typically difficult cases very well lesions with a low contrast and lesions at the liver border are found which are often missed by our approach.
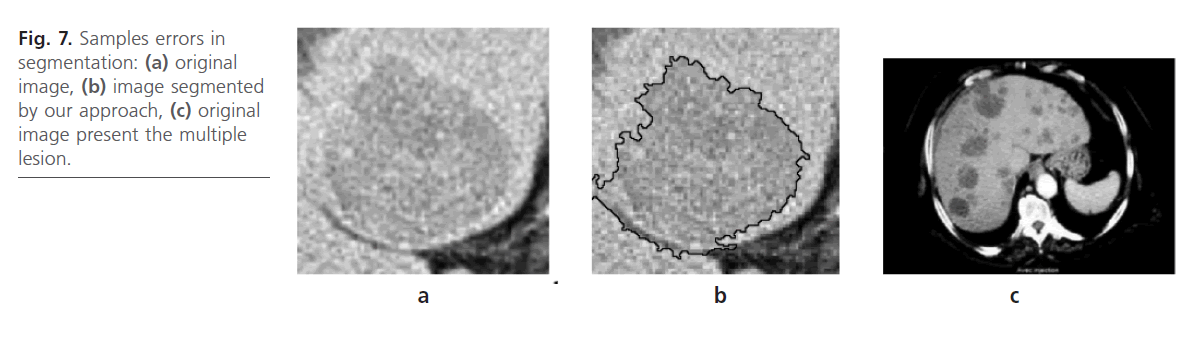
Fig 7: Samples errors in segmentation: (a) original image, (b) image segmented by our approach, (c) original image present the multiple lesion.
In the future work, we seek these problems and to improve our approach for the liver lesion segmentation. Also the work can be extended in order to detect the multiple lesions spread over all the liver.
In addition, datasets containing multiple lesions spread over all the slices of the dataset as it is shown in Fig. 7c. In this case, our methods can not the segmented correctly.
Comparing our algorithm results to others approach.
Unfortunately, an objective comparison among different systems would be not accurate and fair, due to the lack of a common dataset with its gold standard, i.e. a commonly accepted manual segmentation, and a unique measure of discrepancy between the automatic and the manual segmentation of each abdominal organ. Besides, most authors employed their own private datasets.
In the Table 1, we report the Liver lesion segmentation results achieved by diverse algorithms. Massoptier, Laurent et al. [16] proposed a model-based approach relying on statistical information of images combined with adaptive threshold and active contour techniques. Datasets presenting different anatomical and pathological situations have been processed and analyzed. Sensitivity and specificity for tumor lesion detection were 82.6% and 87.5%, respectively. Pescia, Daniel et al. [23], suggest the use of advanced non-linear machine learning techniques. The results of liver tumors segmentation were 86% of sensitivity and 80% of specificity. The application of our algorithm for the detection of contours of the Liver lesion provide the Sensitivity and specificity are 92% and 99% respectively.
Some authors evaluate the detection and segmentation quality by computing the sensitivity and specificity. This approach has some drawbacks and can even be misleading. Generally, specificity cannot be defined in a practical way, due to the problem of defining true negative samples. Sensitivity on the other hand can be defined meaningfully. In this way, the definition of sensitivity is equal to our definition of detection rate; more detail can be found in reference [24].
In the Table 2, we present the average results of previous works that used Detection rate of the Liver lesion segmentation. Militzer et al. [25] presents a system for automatic detection and segmentation of focal liver lesions in CT images. It utilizes a probabilistic boosting tree to classify points in the liver as either lesion or parenchyma. Militzer et al. [25] state their detection rate and precision as 71% and 0.17 respectively. Schwier, Michael et al. [24] present a system approach that is intended to support the localization of liver lesions. The detection algorithm was designed using an approach based on object-based image analysis. The automated method provides an overall detection rate of 77.8 with a precision of 0.53.
The proposed technique has achieved as 92% of the detection rate for the liver lesions segmentation.
Conclusion
The presented system for detection and segmentation of focal liver lesions is able to reliably segment the lesions in the used patient database. This method can be helpful for preliminary testing of CT scan images. Our proposed approach has been tested for many other images and it gives satisfactory results. The results of segmentation were 92% of detection rate and 99 % of specificity. In the future the segmentation may be improved by treating differently and multiple lesion also the boundaries of the liver.
1862
References
- Pohle, R., Toennies, K.D. Segmentation of medical images using adaptive region growing. Proceedings of the SPIE 4322, Medical Imaging 2001; 1337-1346.
- Bekes, Gy., Nyúl, L.G., Máté, E., Kuba, A., Fidrich, M. 3D segmentation of liver, kidneys and spleen from CT images. Proceeding of the International Journal of Computer Assisted Radiology and Surgery 2007; 2 (1): 45-46.
- Heimann, T., Wolf, I., Meinzer, H.P. Active shape models for a fully automated 3d segmentation of the liver – an evaluation on clinical data. Larsen, R., Nielsen, M., Sporring, J. (Eds.). MICCAI 4191 of LNCS. Berlin: Springer-Verlag. 2006. pp. 41-48.
- Rikxoort van, E., Arzhaeva, Y., van Ginneken, B. Automatic segmentation of the liver in computed tomography scans with voxel classification and atlas matching. MICCAI 2007 Workshop Proceedings of the 3D Segmentation in the Clinic: a Grand Challenge. 2007.
- Kainuller, D., Lange, T., Lamecker, H. Shape constrained automatic segmentation of the liver based on a heuristic intensity model. MICCAI 2007 Workshop Proceedings of the 3D Segmentation in the Clinic: a Grand Challenge. 2007. pp. 109-116.
- Alomari Raja, S., Suryaprakash, K., Vipin, Ch. Segmentation of the Liver from Abdominal CT Using Markov Random Field model and GVF Snakes. IEEE. 2008. 135.
- Rafiee, A., Hassan, M., Alireza, R. Using Neural Network for Liver Detection in Abdominal MRI Images. IEEE International Conference on Signal and Image Processing Applications. 2009.
- Jianhua, L., Zhongyi, W., Rui, Z. Liver Cancer CT Image Segmentation Methods based on Watershed Algorithm. IEEE. 2009.
- Nader, H., Abdel-massieh, M., Hadhoud, Khalid, M. A Novel Fully Automatic Technique for Liver Tumor Segmentation from CT Scans with knowledge-based constraints. IEEE.
- Jia-Yin, Z., Damon, W.K., Wong, F.D., Sudhakar, K., Venkatesh, Q., Ying-Yi, Q., Wei X., Jimmy, J., Liu, L. Liver tumors segmentation using contrast-enhanced multi-detector CT data: performance benchmarking of three semi-automated methods. Eur Radiol. 2010; 20: 1738-1748.
- Kumar, S.S., Moni, R.S., Rajeesh, J. Automatic liver and lesion segmentation: a primary step in diagnosis of liver disease. SIViP.
- - Lotufo, R., Rittner, L., Audigier, R., Machado, R., Saude, A. Morphological Image Processing Applied in Biomedicine. Biomedical Image Processing, Biological and Medical Physics, Biomedical Engineering. Berlin: Springer-Verlag.
- - Wang, G., Guojin, H. Human Visual System based Processing for High Resolution Remote Sensing Image Segmentation. 2nd International Conference on Signal Processing Systems (ICSPS). IEEE. 2010.
- Wenzhong, Y., Xiaohui, F. A Watershed Based Segmentation Method for Overlapping Chromosome Images. Second International Workshop on Education Technology and Computer Science. IEEE. 2010.
- Xiaoyan, Z., Yong, S., Wei, W., Zijian, Z. An Image Segmentation Method Based on Improved Watershed Algorithm. IEEE. 2010.
- Massopti, L., Casciaro, S. A new fully automatic and robust algorithm for fast segmentation of liver tissue and tumors from CT scans. Eur Radiol. 2008; 18: 1658-1665.
- Farmaki, C., Marias, K., Sakkalis, V., Graf, G. Spatially adaptive active contours: a semi-automatic tumor segmentation framework. Int J CARS 2010; 5: 369-384.
- Benoit, N. Abdominal organs segmentation by a topological and morphological creterian. Thesis. Louis Pasteur university, Strasbourg. 2004.
- Al-amri, S., Kalyankar, N.V., Khamitkar, S.D. Linear and Non-linear Contrast Enhancement Image, IJCSNS. International Journal of Computer Science and Network Security, 2010; 10 (2): 139-143.
- Fahimuddin, S., Prasad, G., Jayabhaskara, B., Rahim, B., Somasekhar, A., Venkatasubbaiah, P. Medical Image Analysis of Diabetic Patients with Cardiac Complications using Contrast Enhancement. International Journal of Algorithms, Computing and Mathematics 2010; 3 (4).
- Behrad, A., Masoumi, H. Automatic Spleen Segmentation in MRI Images using a Combined Neural Network and Recursive Watershed Transform. IEEE. 2010.
- Zheng, W., Yang, H., Hui-sheng, S., Hong, F. Multiscale Reconstruction and Gradient Algorithm for X-ray Image Segmentation Using Watershed. IEEE. 2008.
- Pescia, D., Paragios, N., Chemouny, S. Automatic detection of liver tumors. IEEE. 2008.
- Schwier, M., Hendrik Moltz, J., Peitgen, H.O. Object-based analysis of CT images for automatic detection and segmentation of hypodense liver lesions. Int J CARS 2011; 6: 737-747.
- Militzer, A., Hager, T., J¨ager, F., Tietjen, Ch., Hornegger, J. Automatic Detection and Segmentation of Focal Liver Lesions in Contrast Enhanced CT Images. International Conference on Pattern Recognition. IEEE. 2010.