Keywords
Mixed models; Gross contribution income; Fixed effects; Random effects
Introduction
The private health system in South African is currently serving close to nine (9) million people and these are people who currently have medical aid and those who can afford to pay for provision of health services from their own pocket. It has been covered extensively in literature that private health system in South Africa is costly and mostly used by the middle to high income individuals and families. Private healthcare insurance coverage in South Africa has flat-lined hovering around 16.00% since the early 90`s and this has remained in the same level at 16.57% of the population in 2013 [1,2].
Growth is important for the sustainability of medical schemes (the market niche of the health insurance carrier), [3,4] a sufficiently large risk pool allows for cross subsidization from the healthy to the sick, young to the old. However, due to systematic issues, structural factors and other reasons, medical schemes have not improved in attracting or retaining large risk pools.
Market solidarity has not been able to attain the critical point required to create demand-side and thus make premiums more affordable through supplying private healthcare insurance at levels that are more accessible for satisfying basic health insurance needs. Market solidarity is achieved through heterogeneous health status profiles enrolling in common risk pools. This type of mutual association helps increase economies of scale through more successful hedging of healthcare costs across heterogeneous risk preferences, thus requiring smaller healthcare insurance premium increases. Monitoring market structure and institutional factors such as competition and regulatory incentives for increasing the size of risk pools, becomes important for being able to generate the correct health sector environment for investments at levels where health needs and healthcare access disparities are prevalent.
We employed mixed model techniques to assess the impact of specific regulatory incentives which are designed to conciliate between scheme and member interests [5,6]. Study designs such as in the current research is the also called nested design where the benefit options of medical schemes are nested within; medical schemes; and medical schemes are nested within scheme type (market distinction regulated by law). Thus, the hierarchal structure of this data presents an opportunity for mixed models to capture structural differences based on random effects specific to healthcare premiums as result of operating in differentiated markets [7,8].
The model considered the impact of explicit deterministic variables that are outside the domain of regulations and other institutional factors such as claims data and the average age of enrolees are specified as fixed effects. These two performance variables determine the need for premium changes for health insurance carriers are the basis of health insurance carriers operating activities and expenses related to Pure risk.
Good performance is based on:
i) insurance pools having sufficient enrolees for financial stability [9]; and
ii) Managing the trade-off between moral hazard and riskaversion.
This type of analysis is instrumental in designing appropriate policy interventions for differentiated health carrier corporate structures.
Legislative requirements: Principle of open enrolment and community rating
Medical schemes are mutual health insurers that are regulated under the Medical Schemes Act [10] since 1998 (MSA). The Act makes provision for two bodies to perform regulatory functions, namely:
• Council for Medical Schemes, [11] and the
• Registrar of Medical Schemes
The distinction between employment-based fund, also known as restricted schemes and open schemes, is an important one. Membership for restricted schemes is usually sets a requirement that all employees within a company join the scheme or a scheme of a particular sector. Open schemes on the other hand freely admit everyone who can afford premiums; these schemes generally recruit members through brokers. Also covered in literature are limitation in the current regulations that impact on the principle of community rating is that members voluntary join schemes. For example members join schemes only when they are older with a higher claims ratio, thus impacting on cross subsidization. Members of schemes are thus protected against unfair discrimination by schemes as they cannot be denied entry to medical schemes on these two key principles [10]. Table 1 below summarises some of the main benefits. Other key policy issues such the provision of prescribe minimum benefits and governance related issues are excluded in the current document.
| Risk rating |
Risk rating can be defined as rating the risk a member may present to a medical scheme in terms of the potential cost to the scheme estimated on the basis of the age and health status of the member. The medical scheme determines the terms of the membership of the prospective member in terms of the potential risk, using means such as condition specific waiting periods to protect the existing membership base from the risk presented by the prospective member. |
| Community rating |
The Act specifies that a scheme may not in any manner discriminate against a person on the basis of age, past or present state of health of the applicant or one or more of the applicant’s dependants, the frequency of rendering of relevant health services to an applicant or one or more of the applicant’s dependants other than the provisions as prescribed (Section 29 (n)). Some of the benefits include considerable cross-subsidisation between low-risk and high-risk individuals ensures that all members on a benefit option pay the same contribution for the same benefits but access benefits based on what they need. Price discrimination against people with high-risk medical condition (s) is prevented (they would have been excluded in a risk-rated market). This principle also offers protection of members protected against the potentially catastrophic effects of an illness and/or medical expenditure. However, the current implementation applies to each benefit option in each medical scheme rather than the industry as a whole. |
| Open enrolment |
Open schemes have to accept anyone who wants to become a member at standard rates. Some of the benefits of this principle are that it prevents medical schemes from “cherry-picking” good profiles. |
Table 1: The Medical Schemes Act, Source: CMS News, 2010 and MSA, 1998.
The current regulations was initially intended to protect the member, the Act does allow medical schemes to use certain risk management tools such as the application of late joiner penalty and waiting periods. However there are instances where these tools are not employed consistently or adequately by schemes.
For example Circular 26 of 2014 of the CMS addresses issues pertaining to open enrolment, termination of membership and provisions that should be employed where a termination was grated and a member wishes to re-join a scheme [12]. The referred circular emanates for the inconsistencies applied by schemes and there are many other similar cases.
There are many other challenges that threaten the key pillars of the MSA, such as lack of restriction or parameters in the benefit design by schemes. McLoed and Ramjee [13] reported on the lack of restrictions in the design of benefits by schemes to effective risk-rate. The author further states that “there are incentives to use benefit design to ‘cherry-pick’ healthy members”. These observations further support the argument that benefit design should be such that it adds value for money to members. Currently, schemes offer between 1-26 benefit options (including the so called ‘hybrid’ benefit options). There have been few studies that have attempted to explore the impact of benefit offerings between different medical schemes [13,14]. There are also other limitations in the current regulatory environment such as those outlined by Ramjee and Vieyra [15].
The use of mixed models in other public policy sectors
In the telecommunications and electric power utilities sectors, mixed models have been used to split from the fixed effects of utilities micro business operation environments, the random effects of the macro environment factors such as regulatory reforms on state ownership and competition. Both microenvironment and macro-environment factors impact on growth of capital formation and pricing of public services the in utilities industries.
In Boyes and McDowell [16] and Smart [17], regulatory governance are treated as endogenous variables underlying the determination of prices public utilities. Boyes and McDowell [16] postulate that the institutional paradigm dictating the behaviour of consumers and utility providers is based on, the degree of autonomous power given to regulating agencies in designing and implementing incentive policy. Their finding is that institutional settings do have an impact on prices, as regulatory pricing could be influenced by political interest groups lobbying for rent seeking opportunities either for consumers or public utility providers.
Most importantly they emphasised that, incorporating dummy variables to distinguish between different modes of governance by regulatory agencies, does not by itself create statistical significance between intercepts that are specified in mixed models. However, creating slope dummy interactions with a proxy that captures the degree of independence of pricing decisions made by regulatory agencies may remedy the problem of the statistical significance of estimated random effects.
Gutierrez [18] conquered by stating that endogeneity cannot be merely assumed into the model, it needs to be estimated from an underlying equation in a two-step model. Similarly, Ros and Banerjee [19] find that government policy relating to privatization and competition policy incentives can be measured as an underlying endogenous factor explaining growth variances in incremental supply of basic services in the utilities sector.
Their estimates relating to the prevalence of privatization and competition were correlated with the structural model’s error term. They found a positive relationship between antiprotectionist policy and access to basic services, they further criticized established arguments of the beneficial effect that protectionist policies have on reducing prices of public services.
For the purposes of explaining variance in health insurance premiums within the health insurance policy sector, mixed model techniques are applied to cross sectional data in order to isolate industry specific characteristics.
The random component is assumed to be informed by the hierarchical structure of the dataset, the multi-level recording of healthcare carrier premiums at corporate or product level, introduce the random component of regression estimates. This type of analysis is instrumental in designing appropriate policy interventions for differentiated health carrier corporate structures.
The theoretical framework of linear mixed models
Consider the Normal Linear Model:
 Where
Where
 (1)
(1)
The above model has one random effect: the error term ε i and the parameters of the model are the regression coefficients, namely:
 (2)
(2)
The error variance for the Normal Linear Model is δ2 with the Normal Regression Model x1i=1 , thus β1 is an intercept, and the Normal Linear Model can also be presented in matrix form as follows
 and
and  (3)
(3)
where  Y is the response vector, X is the model matrix, and its components are as follows:
 is the vector of regression coefficients and
  is the vector of the error term.Nn denotes the n-variable multivariate normal distribution. 0 Is the n by 1 vector of zeros. In is the identity matrix.
Consider a model similar to (3)
Where X is the known design matrix that includes co-variables for fixed effects and Z is the known design matrix that includes random co-variances for the random effects Y [20].
Linear Mixed Models include additional random-effect terms, and are often appropriate for representing clustered, and therefore dependent, data – arising, for example, when data is collected hierarchically, when observations are taken on related individuals/levels or when data is gathered over time on the same individuals. The Proc Mixed procedure in SAS was used in the 2013 data for further exploration and the co-variance structures were also assessed. The COVTEST option requests hypothesis tests for the random effects, there are more choices of covariance structure to fit the model [21]. The tests that were used in this case study are listed in Table 2. The CLASS statement identifies id as a categorical variable.
| Covariance structure |
Description |
| VC |
Variance Component |
| AR(1) |
First Order Autoregressive |
| CS |
Compound Symmetry |
| TOEP |
Toeplitz |
| UN |
Unstructured |
| HF |
Huyuh-Feldt |
| FA(q) |
Factor Analytic |
Table 2: Select covariance structures considered in modeling healthcare premiums.
The MODEL statement defines the model, and the SOLUTION option asks SAS to print the fixed effects estimates in the output. The next statement, RANDOM, identifies the elements of the model to be specified as random effects. The SUBJECT= scheme type option identifies id to be the grouping variable. A comparison analysis was conducted to select an appropriate covariance structure; for the purpose of the analysis in the current article variance component covariance structure was selected as an appropriate.
Data and Methods
The current research was a cross sectional comparison between 2009 and 2013 medical schemes data [22-26]. The data in this case study is that of the population of registered medical schemes in South Africa. The data is related to compulsory submissions on insurance packages. The submissions are made to the Council for Medical Schemes (CMS) in terms of regulatory incentives and industry guidance. All healthcare insurance packages need to be sanctioned and listed on the registry of the health insurance regulator (CMS), on an annual basis. The inclusion criteria were schemes that submitted complete data on the variables of interests. Average age was selected as a variable on the basis that, it informs how health insurance carriers manage the pure risks related to covered risk pools. Claims ratio levels can be used to determine the predictive nature of health claims over a period of time. Both these variables are central to the operational performance of health insurance carriers and, are also assumed to be controllable by internal management. Table 3 summarized the lists variables that were considered in the case study and Table 4 depicts stratification of benefit options.
| Variable |
Description |
| (gcipbpm)gross contribution income1 2009&2013† |
Gross contribution income per beneficiary per month, ZAR |
| (o) Logarithm of gcipbpm |
Log (Gross contribution income per beneficiary per month), this is also dependent variables. |
| (refno) Scheme reference number† |
Unique scheme reference number, this is fitted as an independent variables. |
| (schemetype) Schemetype† |
Open2 scheme if scheme type=1, restricted3 scheme if scheme type=2, this is fitted as an independent variables. |
| (average) Average age* |
Average age of beneficiaries (years), this is fitted as an independent variables. |
| (crp) Claims ratio* |
Unpaid claims and claim adjustment expenses in relation to premiums earned (%), this is fitted as an independent variables. |
| Option name† |
Benefit option name, this is fitted as an independent variables. |
†=Outcome variable
†=Qualitative/categorical variable
*=Exogenous independent variable
1For the purpose of this article gross contribution income and gross contribution premium are used interchangeably
2Medical schemes that freely admit everyone
3Employer group schemes, these schemes only admit applicants belonging to a specific employment sector.
Table 3: Selected Variables
| Scheme classification |
Description |
| 1option |
Schemes with only one benefit option |
| 2 options |
Schemes with two benefit options |
| 3 options |
Schemes with three benefit options |
| 4 options |
Schemes with four benefit options |
| 5 options |
Schemes with five benefit options |
| 6+ options |
Scheme with six or more benefit options |
Table 4: Stratification of benefit options.
The aim of the study was to model gross contributions as dependent variable observations, relative to the following predictors:
i) Average age of beneficiaries in a medical scheme as fixed effects, the average age is a pure risk which is related to, management decisions on resource allocation and technical efficiency;
ii) The claims patterns of the beneficiaries as a fixed effect, this factor is directly related to the degree to which insurance pools are experience rated or predictability of healthcare claims;
iii) The random components (institutional/macro environment factors which were specified in the current research were the healthcare premiums at the following hierarchical levels of observing the structure of the data base:
• Health insurance product (option) level of the option strata (randomness due to the dilution of community rating),
• The scheme level (randomness due to competition or market structure); and
• The scheme type level was described as the aspect of market structure regulated by the law; i.e. the distinction between restricted and open schemes.
Results
Descriptive analysis
The current study included 33 in 2009 open schemes (24 in 2013) and 77 in 2009 restricted schemes (62 in 2013). The average number of benefit options for open and restricted schemes was 5.7 in 2009 (5.8 in 2013) and 2.2 in 2009 (2.2 in 2013) respectively. The medical schemes were stratified by benefit option stratification. The results indicate that the number of open schemes declined across all benefit option stratification other than 4 option strata and 6+ strata. A similar observation was noted in restricted schemes were there were movements in number of schemes per benefit stratification which declined other than the 4 option strata and 6+ option strata (Table 5).
| |
|
Count of schemes |
Beneficiaries |
| Scheme type |
Number of options |
2009 |
2013 |
2009 |
2013 |
| |
1 |
|
|
|
|
| Open schemes |
2 |
|
2 |
|
24 943 |
| 3 |
9 |
4 |
311 240 |
235 624 |
| 4 |
8 |
4 |
562 653 |
60 388 |
| 5 |
6 |
1 |
918 728 |
40 864 |
| 6+ |
10 |
13 |
980 805 |
1 920 777 |
| Restricted schemes |
1 |
36 |
27 |
403 305 |
366 736 |
| 2 |
17 |
14 |
807 043 |
747 605 |
| 3 |
14 |
11 |
210 082 |
290 189 |
| 4 |
2 |
2 |
158 881 |
99 906 |
| 5 |
8 |
6 |
525 963 |
323 019 |
| 6+ |
|
2 |
|
248 663 |
Table 5: Number of medical schemes and beneficiaries by benefit option strata.
A noteworthy feature of the data was a significant decline in the number of beneficiaries of open schemes in the 4 and 5 benefit option stratification. This was due to 2 liquidations and 7 mergers that took place between the two time points (Table 6). One of the main reason for the loss membership in the 5 option strata was the Prosano and Bonitas merger (Bonitas had 4 benefit options and 651 000 beneficiaries prior the merger) the merger resulted in the increase in number of options to 7 hence the move to the 6+ benefit option stratum in 2013. Medshield and Resolution had four benefit options in 2009 and nearly 200 000 beneficiaries, as a result of the merger with Oxygen and NIMAS respectively these schemes moved to 6+ benefit option stratification.
| Scheme Name |
Beneficiaries in 2009 |
Number of options in 2009 |
Comment |
| Telemed |
52 447 |
5 |
Merged with Bestmed in 2010 |
| National Independent Medical Aid Society |
29 740 |
4 |
Merged with Resolution in 2012 |
| Purehealth Medical Scheme |
6 631 |
4 |
Liquidated in 2010 |
| Protea Medical Aid Society |
7 146 |
3 |
Liquidated in 2011 |
| Oxygen Medical Scheme |
133 860 |
7 |
Merged with Medshield in 2010 |
| Pro Sano Medical Scheme |
70 063 |
5 |
Merged with Bonitas in 2012 |
| Medicover |
91 985 |
3 |
Merged with Liberty in 2010 |
| Gen-Health Medical Scheme |
30 460 |
3 |
Liquidated in 2010 |
| Ingwe Health Plan |
19 198 |
5 |
Merged with Momentum in 2010 |
Table 6: Open scheme mergers and liquidations (2009-2013).
A significant decline in the 4 options strata for restricted schemes was attributed to the Bestmed (open scheme) and Minemed (restricted scheme) merger effective in 2013 (Minemed had 4 benefit options with approximately fifteen thousand beneficiaries in 2009).
Figure 1 below illustrate the impact of market concentration by few players in the industry, a select list of 19 schemes depicted below accounted for more than two thirds of the industry in 2009 and increased market dominance of more than three quarters in 2013 which is significant growth, largely due to two main players in the industry. Further depicted below in Figure 2 is the impact of the two major players in the open and restricted schemes environment namely (GEMS-Government Employees Medical Scheme and DHMS- Discovery Health Medical Scheme) in 2009 and 2013.
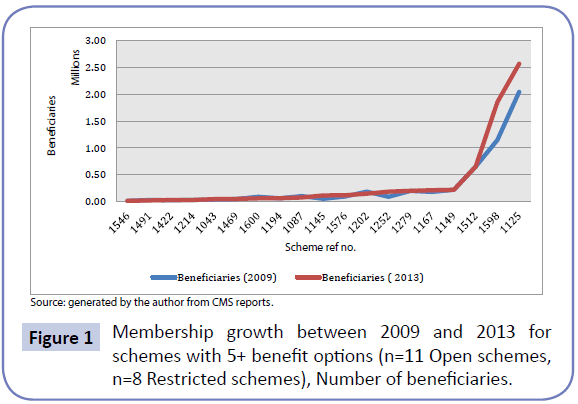
Figure 1: Membership growth between 2009 and 2013 for schemes with 5+ benefit options (n=11 Open schemes, n=8 Restricted schemes), Number of beneficiaries.
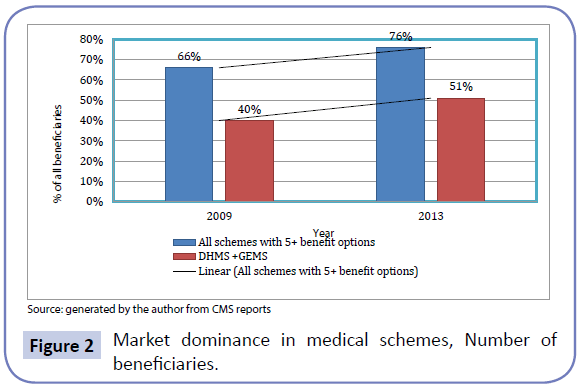
Figure 2: Market dominance in medical schemes, Number of beneficiaries.
Schemes with less than five benefit options accounted for slightly more than a third (34%) and this declined to slightly less than a quarter (24%) of beneficiaries in 2013.
Further analysis on other variables of interest such as the average age of beneficiaries and gross contribution income per beneficiary per month in open schemes was a positive correlation (rho=0.757, p<0.0001).Gross contribution income per beneficiary per month in restricted schemes data showed a positive correlation with the average age of beneficiaries and claims ratio with (rho=0.569, p< 0.0001) and (rho=0.310, p=0.0142) respectively.
Mixed model results
We also fitted an unconditional means linear mixed model (Model 1) in the 2013 data. For random effects, we refer to the output from the Covariance Parameter Estimates (Table 7). The variability in scheme means was 0.01038, while the variability in gross contribution income within schemes was 0.4081. In unconditional means model, we have only one fixed effect, the intercept.
| Model |
[1] |
[2] |
[3] |
| Fixed Effects: |
| Estimates (SE) |
| Intercept |
7.0487 |
5.2201 |
4.8122 |
| 0.03832 |
0.109 |
0.1388 |
| Average Age |
|
0.05203*** |
0.04583*** |
| |
0.003131 |
0.00348 |
| Claims Ratio |
|
|
0.007172*** |
| |
|
0.001664 |
| Covariance Parameter : |
| Residual (SE) |
0.4081*** |
0.1527*** |
0.1355*** |
| 0.03468 |
0.01599 |
0.01422 |
| Random effects (refno) |
0.01038 |
0.000065*** |
0.000082*** |
| 0.01878 |
0.000021 |
0.000023 |
| Model fit Statistics: |
| AIC |
545.5 |
364.7 |
358.6 |
| AICC |
545.5 |
364.8 |
358.7 |
| BIC |
547.9 |
369.6 |
363.5 |
Table 7: The results of mixed model estimations, ***p < 0.01, SE=Standard error
Next, we included a scheme level predictor (Model 2). The contribution income per beneficiary per month at scheme level controlling for scheme type and average age, was 0.000065. The estimated average slope representing the relationship between contribution income and average age was 0.1527. Standard error for average age parameters was very low. After controlling for scheme type and average age of beneficiaries, thus significant variation among scheme contribution income still remains to be explained. We conclude that there is statistically significant relationship between contribution income and the average age of beneficiaries. Finally, in M3 (Model3) we included claims ratio variable as an additional predictor at the scheme level. We did find a statistically significant association between independent variables and with contributions incomes.
In addition, the goodness of fit statistics, namely AIC showed that the inclusion of claims ratio variable in the model does lead to a better fit.
Discussion
The mixed model results revealed a pattern between average age, claims ratio and the level of health insurance paid by families enrolled to health insurance carriers, is enriched when the prevalence of options (healthcare packages) is brought into the analysis. This suggests that the random effect of community rating and solidarity would yield better significance if the quantitative dimension to benefit packages were interacted with categorical variables. Including an interaction term into the specification could increase the quality of the specification [12,27,28].
These results are consistent with the body of literature that demographic variables such as age as well as historical claims history as critical in determination of premiums or gross contribution income to schemes. A study by Jacobson and Oxley illustrate that Health care spending also varies by factors such as age and sex. It is widely covered that, age and health profile of the membership are key determinants of the overall contribution levels charged for the benefits available in the medical schemes environment. One of the key principles of the Medical Schemes Act is that of risk pooling and community rating. First, schemes operate through the collective pooling of good and bad risks, and may not discriminate between individuals based on age, gender or health status. This means that any individual is entitled to be a member irrespective of their age or health status and contributions apply universally to all members who are enrolled and may only vary in respect of affordability and family size.
Notwithstanding the principle of risk pooling, it is known phenomenon that an older age profile impacts the sustainability of the scheme and is a catalyst for the current consolidation of the medical scheme risk pool. It is known that demographic factors such as age, gender claim experience are an integral part of calculating premium rates. The current study revealed that the average gross contribution income per beneficiary per month for schemes with 1 benefit option was higher than that of scheme with more than one benefit options. This finding is not consistent with the principle of community rating as prescribed in the MSA applies mainly at benefit option level than at scheme. This has also been studied extensively in literature, McLeod and Ramjee [13] who stated unintended consequences of legislation in particular on older members and those with chronic disease will still experience higher contributions on average than younger members.
The authors further state that the effect on restricted schemes are less pronounced as membership within a company may have a degree of compulsion and hence greater pooling between age groups and between healthy and sick may occur.
Different benefits options are priced differently depending on the level of cover afforded and are determined by the rules of the scheme. The effect is that there are equal premium contributions within options for high and low risk members, which promotes social solidarity in the form of cross-subsidization amongst the members of the scheme.
The current research depicted that market dominance in terms of beneficiaries increased in scheme with five or more benefit options. The result indicate that number of open schemes declined across all benefit option stratification other than 4 option strata and 6+ strata. A similar observation was noted in restricted schemes were there were movements in number of schemes per benefit stratification which declined other than the 4 option strata and 6+ option strata. This finding reveal challenges faced by smaller scheme, especially in open schemes sector where these scheme continue to merge with bigger schemes which continue to grow membership. The analysis conducted in the current research showed that 22% scheme accounted for more than three quarters of industry and the two biggest medical schemes (GEMS and DHMS) accounted for half of all enrollees.
Ramjee and Vieyra [15] state that the current South African medical scheme industry environment offers little in terms of either efficiency or sustainability and requires significant structural reform. Willie and Nkomo [14] advocate for market structure to be scrutinized and defined from many perspectives. This is necessary, particularly in instances when vulnerable risk groups are covered by individual contracts (open schemes), as opposed to, group contracts (restricted schemes).
Gaynor [29] has shown that, medical schemes with vulnerable risk groups are not able to contract low prices with managed care providers. As a result, the market contestability and sustainability of such health plans have waned. Wholey and colleagues found that there are scope diseconomies in providing access to health care services [30].
The results in the current study reveal that average age of beneficiaries an important variable that informs how health insurance carriers manage the pure risks related to covered risk pools. A study by Yamamoto [31] illustrated that age as a nonlinear function of the premium, the study revealed the analysis shows that health care costs increase by age with the exception of the very youngest ages. A study by Day [32] revealed that higher average age of the US population would increase average health premiums charged by insurance companies. Findings in the current study also revealed that claims ratio can be used to determine the predictive nature of health claims over a period of time. Both these variables are thus central to the operational performance of health, Insurance carriers and, are also assumed to be controllable by internal management [33,34].
Conclusions and Recommendations
The current study revealed that the medical schemes industry is currently experiencing consolidation and some of the smaller schemes remain exposed to ageing population and competition for a younger, healthier risk profiles. As a result they are absorbed by larger schemes. The impact of this is the bargaining power with the provider, greater market concentration in medical schemes creates more bargaining power. Greater bargaining power for medical schemes means better contracting arrangements with health care providers and thus; lower premiums for medical scheme beneficiaries. We recommend that market structure to be scrutinized and defined from many perspectives. This is necessary, particularly in instances when vulnerable risk groups are covered by individual contracts (open schemes), as opposed to, group contracts (restricted schemes). The study revealed limitations on some of the key principles of the medical schemes Act which is only limited within schemes than between schemes, it is recommended that some of the key pillars of the legislation be reviewed to ensure that they remain relevant and are able to address current problems facing the “current” environment.
Finally, Linear Mixed Models are useful for hierarchical data particularly that of medical schemes where benefit options are nested in schemes and schemes are classified as operating in an open or restricted environment. These models can be computed using SAS statistical procedures like Proc Mixed, one has also to consider the structural differences between open and restricted schemes and to this affect both random and fixed effects need to be carefully assessed in order to obtain estimates that best describe the data. Notwithstanding the select few Covariates considered, with a more complete set of predictors and larger sample data pool, the Mixed Model is a very useful tool to analyze medical schemes contributions data as illustrated in the empirical example considered in the current research article.
Acknowledgements
The author is grateful for comments and contribution made by Bayar Tumennasan from Bentley University, United States and an anonymous referee in concluding this research work.
6637
References
- Council for Medical Schemes (2010) CMS News. What Medical Schemes are about Issue? Pretoria.
- Statistics South Africa Mid-year population estimates 2013. Pretoria: Statistics South Africa.
- Manning W, Newhouse J, Duan N, Keeler E, Leibowitz A (1987)Health Insurance and Demand for Medical Care: Evidence from a Randomized Experiment77: 251-277.
- Pauly M, Herring B (2007) Risk Pooling and Regulation: Policy and Reality in Today’s Individual Health Insurance Market. Health Affairs26: 770-779.
- Fox J (2002)“Linear Mixed Models”, Appendix to an R and S-PLUS Companion to Applied Regression 2014.
- Demidenko E (2004) Mixed Models: Theory and Applications. New York: Wiley.
- Bryk AS,Raudenbush SW (1992) Hierarchical linear models: Applications and data analysis methods. Newbury Park, CA: Sage Publications.
- Singer JD(1998) Using SAS PROC MIXED to fit multilevel models, hierarchical models, and individual growth models. Journal of Educational and Behavioral Statistics23: 323-355.
- Llewellyn D (1999)The Economic Rationale for Financial Regulation. The Financial Services Authority (FSA) Occasional Papers in Financial Regulation, Series 1.
- The Medical Schemes Act 131 of 1998, the Parliament of the Republic of South Africa.
- Van den HeeverA, Matsebula T, Harrison S (2008)Evaluation of Medical Schemes’ Cost Increases: Findings and Recommendations.Council for Medical Schemes, Office of the Registrar, Research Brief Number 1.
- Council for Medical Schemes (2014) Circular 26 of 2014: Open Enrolment Following the Termination of Membership for Material No–Disclosure.Pretoria.
- McLeod H,Ramjee S (2007)“Medical Schemes” In: Harrison S Bhana R and Ntuli A South African Health Review.
- Willie MM, Nkomo P (2014)Market Structure in the South African Health Care System. World Medical Journal 60:2.
- RamjeeS,Vieyra T(2014) Neitherhere nor there: the South African medical scheme industry in limbo. Presented at the Actuarial Society of South Africa’s Convention.
- BoyesW, McDowell J(1989)The Selection of Public Utility Commissioners: A Re-examination of the Importance of Institutional Setting. Public Choice 6: 11-13.
- SmartS (1994) The Consequences of Appointment Methods and Party Control Communications Pricing. Journal of Economics and Management Strategy 3: 301-323.
- Gutierrez L (2003) The Effect of Endogenous Regulation on Telecommunication Expansion and Efficiency in Latin America. Journal of Regulatory Economics 23: 257-286.
- Ros A, Banerjee A(2000) Telecommunications Privatization and Tariff Rebalancing: Evidence from Latin America. Telecommunications Policy24: 233-252.
- Roser, Bono, Jaume,Arnauy,Nekane, et al.(2007) “Using Linear Mixed Models in longitudinal studies: Application of SAS PROC MIXED.” Revista Electronica de MetodologíaAplicada12: 15-31.
- Wolfinger R, ChangM (2002) Comparing the SAS GLM and Mixed Procedures for Repeated Measures. SAS online publication.
- Council for Medical Schemes (2013) Annual Report 2013–2014. Pretoria.
- Council for Medical Schemes (2011) Annual Report 2011–2012. Pretoria.
- Council for Medical Schemes (2012) Annual Report 2012–2013. Pretoria.
- Council for Medical Schemes (2010) CMS News. What Medical Schemes are about Issue 1 of 2010-2011? Pretoria.
- Council for Medical Schemes (2014) Annual Report 2012–2013. Pretoria.
- Nkomo P, Sawry S (2006) Analysis of Contributions and Benefits of Registered Medical Schemes for the year 2006 Research and Monitoring. Council for Medical Schemes.
- Nkomo P, Willie M, Matshidze P (2002-2006) Trends in the Medical Schemes Contributions, Membership and Benefits Council for Medical Schemes, Office of the Registrar, Research Brief Number 2.
- Gaynor M, Haas-Wilson D(1999) Change consolidation and competition in health care markets. Journal of Economic Perspectives13: 141-164.
- Wholey, ChristiansonJ,EngbergJ (1997) HMO Market Structure and Performance Health Affairs. 16: 75-84.
- Yamamoto DHealth care costs-from birth to death 2013. Retrieved on December 6 2014.
- JoskowM(1974) Inflation and Environmental Concern: Structural Change in the Process of Utility Price Regulation. Journal of Law and Economics17: 291-327.
- Newhouse J (2006) Reconsidering the Moral Hazard Risk-Avoidance Trade-off. Journal of Health Economics 25: 1005-1014.