Keywords
Quality of Life (QoL); Tumor response; Cancer; EQ5D-3L
Introduction
Before the beginning of any oncologic intervention, both the clinician and the patient anticipate two important aspects of treatment: tumor response and quality of life. Tumor response is evaluated as improvement, worsening or stability of the initial primary tumor upon initiation of treatment while quality of life is defined as changes from the daily activities of normality of the patient. In practice clinicians prioritize asking pertinent questions both with regards to tumor response and quality of life- how was the treatment, did the size of the lymph node change, are you still able to function normally? These questions are hard not to get noticed and eventually clinicians and patients occasionally gauge both tumor response and changes in quality of life hand-in-hand. The relationship of these two responses is the topic of discussion in this paper.
Quality of life (QoL) issues ensure that cancer patients are able to function as indistinguishable to normal as possible. Recording of self-reported evaluation of patients on their wellbeing and symptoms has been a practice since time immemorial. The goal of recording the quality of life is to identify important changes caused by any intervention. These changes are now called health-related quality of life (HRQOL) [1]. HRQOLs are important to guide clinicians in providing the most appropriate chemotherapy regimens and adjustments along the course of management.
On the other hand, tumor response has been used to guide clinicians in choosing the most appropriate intervention. Tumor response is always assessed after any cancer therapy. True enough, it is the most anticipated after a cancer intervention. Since creation of the RECIST in 2000, assessment of change in tumor burden has become an important factor in clinical evaluation of cancer therapeutics [2]. Tumor response is easily measured using before and after imaging studies that provide an almost instantaneous glimpse of an oncologic intervention. However, despite the routine use of tumor response in assessing the best management, it is still not tantamount to survival [3].
In the recent past, both objective (tumor response) and subjective response (quality of life) is measured together to assess adequacy of management after an oncologic intervention. The association between health-related quality of life and tumor response is hard not to be noticed. In the clinical setting, clinicians rely on the quality of life reported and correlate it with tumor response even without the routine use of imaging studies. Patients themselves perceive tumor response similar to improvement in quality of life. This is highlighted by the different National Comprehensive Cancer Network (NCCN) guidelines [4], placing history and physical examination at the top of each follow-up regimen. Highlighting such not only guides treatment patterns but more importantly, may ascertain if HRQOL can predict tumor response as well.
The association between tumor response and baseline HRQOL has long been studied. Modi et al. has extrapolated data on tumor response, HRQOL and use of single agent Paclitaxel among stage IV breast patients. They noted that good tumor response is seen with improvement in HRQOL as well [5]. Similarly, gastrointestinal stromal tumor (GIST) patients on palliative chemotherapy showed improved clinical outcome with improvements in QOL [6]. A subgroup analysis in the IPASS study pointed out that deterioration of reported HRQOL was associated with progression of the disease [7].
Interestingly, several studies have earlier speculated on the predictive value of HRQOL and tumor response. A study by Keene, on adjuvant breast cancer patients, iterates that decrease in physical wellbeing is strongly related to recurrence [8]. Similarly, possibility of locoregional failure has been identified as closely associated with decrease in functional well-being among head and neck cancer patients [9].
Locally, baseline QOL and survival has already been explored. According to this study, baseline QOL is a predictor of survival independent of treatment, cancer site, and metastasis [10]. Despite this data, no local study has been conducted to evaluate change in QOL from baseline to end of treatment and tumor response.
This study focused on the association of change of the EQ-5D QoL from baseline to after treatment with tumor response among Filipino cancer patients seen at the medical oncology clinics of two tertiary hospitals in the Philippines.
Methodology
Study design and study population
This is a retrospective analysis of secondary data from the Philippine database of the ASEAN Costs in Oncology (ACTION) study [11]. Information used was collected until 31 December 2014; patients included in the analysis should have completed the whole treatment course, and have been able to answer the baseline and 1 year EQ5D-3L questionnaire. Any other patient not included in the ACTION study was likewise excluded. Patient records from the ACTION study indicating noncompletion of treatment due to drop out, death or loss to follow-up were also excluded.
The population in the ACTION study was newly diagnosed medical oncology patients from two tertiary hospitals last 2012-2014. All patients were more than 18 years old and were cognizant of their disease. Demographics were collected during the initial interview. A baseline QOL using EQ5D-3L questionnaire was answered. These patients were followed up to 1 year. Their EQ5D-3L score was also updated on the 3rd and 12th month. Tumor response was noted at the end of the treatment. Four hundred twelve (412) records of the ACTION study qualified as units of analysis.
Ethical considerations
The ACTION study was approved by the Ethics Board with ID number GCS IM 2011-009 (R-081TE). Informed consent from each subject was taken. Data confidentiality was observed. Permission to utilize secondary data from this study was obtained through the co-authors of the study.
Data collection from the ACTION study database
Newly diagnosed patients enrolled to the ACTION study from two tertiary hospitals were required to answer basic demographic questions including their age, sex, cancer site, presence or absence of metastasis and cancer treatment. Baseline EQ5D-3L scores were taken at the start of the study and were followed-up for 1 year.
The EQ 5D- 3L is a standardized measure of health status developed by the EuroQol Group in order to provide a simple, generic measure of health for clinical and economic appraisal [12]. This questionnaire was used in the ACTION study. It comprised of the five (5) domains relating to quality of life: 1) mobility, 2) self-care, 3) usual activities, 4) pain/discomfort, and 5) anxiety/depression. Each dimension has three (3) levels ranging from 1) no problems, 2) moderate problems, and 3) extreme problems. Each respondent was required to tick one box among each level per health dimension. The EQ 5D also contained Visual Analog Scale (VAS), similar to pain VAS. Each respondent was required to ask a numerical value for their present health state: 0 being the worst health you can imagine and 100 as the best health. Each score was recorded on baseline interview, 5th month interview and 12th month interview.
Tumor response was graded according to the latest RECIST guidelines (Version 1.1). Baseline imaging studies were reviewed and measurable disease status was noted. These data were then compared with post treatment imaging done four to six weeks after intervention. Tumor response was graded as follows:
1) Complete response: Disappearance of all measurable disease, any pathological lymph node should show a decrease by 10 mm in its short axis
2) Partial response: Less than thirty percent change in the measurements of the measurable disease,
3) Stable disease: No change in measurement from baseline,
4) Progressive disease: At least twenty percent increase in the size of the total measurable disease from the study, or an absolute increase by 5 mm of the target lesion or presence of new lesions.
Data analysis
The data obtained from the ACTION Study was translated into MS Excel. Columns relevant for analysis were retained. Category levels the ACTION database were retained (i.e., no recoding of values were done). Important data for analysis were highlighted. The difference from baseline QoL was compared with the QOL at 12 months. Change in QoL was added as a new category level. Change of VAS score was also recorded and was added as a new category level. The change in QoL was measured by subtracting the score of each dimension from baseline with the 12th month score. The same procedure was done with the VAS scores.
Data was converted into an SPSS version 19 work file before proceeding to statistical treatment.
All statistical analysis was performed using SPSS version 19. Descriptive analysis was used to describe the demographic profile. Summary statistics such as mean, standard deviations, and proportions were utilized to describe the study population. Mean scores were taken for EQVAS.
The association between change in score of the different EQ5D-3L dimensions from baseline to 1-year follow-up and tumor response was determined using logistic regression. Data was grouped to those between positive and negative change in each EQ5D-3L dimension. Significant changes in each EQ 5D 3L was analyzed with each category of tumor response. Association between each EQ-5D 3L dimension sub grouping and tumor response was also determined using logistic regression.
Study limitation
The patients were from the medical oncology clinics of two (2) tertiary hospitals, focusing on the lower income Filipino population. Selected secondary data from the ACTION study was used to establish associations.
Results
Baseline characteristics
Four hundred twelve (412) out of the 742 enrolled cases in the ACTION Database qualified for analysis. Of these, 226 (64.6%) were female while 146 (35%) male. Most patients (33.5%) were in the 50 to 59 age group, followed by those in their forties (24.5%) and then by the 60 to 69 age group (17%). Most patients (73.5%) were married. Some 41% were head of household. With respect to educational attainment, 37.9% had at most secondary or high school education, 28.6% reached college/university while 24.3 reached at most elementary school education. Most (33.7%) were service and sales workers while 10% were professionals.
There was a variety of cancer sites in the database but the following four appeared most common: 174 (42.2%) female breast cancer cases, 90 (21.8%) for colon and rectal cancer, 51 (12.4%) for other malignant neoplasms and 41 (10%) mouth and pharynx cancer cases.
Of the total number of cases, one hundred twenty-six (30.6%) were metastatic cases (Table 1).
| Demographic Profile |
|
| |
|
Frequency |
Percent (n=412) |
| Sex |
Male |
266 |
64.6 |
| |
Female |
146 |
35.4 |
| Age Group |
18 to 29 |
22 |
5.6 |
| |
30 to 39 |
55 |
13.3 |
| |
40 to 49 |
101 |
24.5 |
| |
50 to 59 |
138 |
33.5 |
| |
60 to 69 |
70 |
17 |
| |
70 to 79 |
25 |
6.1 |
| Marital Status |
Never Married |
46 |
11.2 |
| |
Married |
303 |
73.5 |
| |
Widow |
46 |
11.2 |
| |
Separated |
17 |
4.1 |
| House Head |
No |
244 |
59.2 |
| |
Yes |
168 |
40.8 |
| Educational Level |
No Schooling |
1 |
0.2 |
| |
Primary (6 years) |
100 |
24.3 |
| |
Secondary/High school (7-12 years) |
156 |
37.9 |
| |
Technical/Vocational |
37 |
9 |
| |
College/University |
118 |
28.6 |
| Occupation |
Service and Scale Worker |
139 |
33.7 |
| |
None (Employed) |
62 |
15 |
| |
Professional |
41 |
10 |
| |
Home Duties |
40 |
9.7 |
| |
Agricultural, Forestry and Fishery Workers |
37 |
9 |
| |
Factory Labourer |
25 |
6.1 |
| |
Clerical Suppport Wokers |
20 |
4.9 |
| |
Craftes and related trade worker |
19 |
4.6 |
| |
Manager |
10 |
2.4 |
| |
Technician |
10 |
2.4 |
| |
Elementary occupation |
8 |
1.9 |
| |
In military |
1 |
0.2 |
| Current Cancer site |
Female Breast |
174 |
42.2 |
| |
Colon and Rectum |
90 |
21.8 |
| |
Other Malignant Neoplasm |
51 |
12.4 |
| |
Mouth and Pharynx |
41 |
10 |
| |
Lymphomas and Multiple Myeloma |
29 |
7 |
| |
Trachea, Bronchus and Lung |
16 |
3.9 |
| |
Prostate |
4 |
1 |
| |
Stomach |
2 |
0.5 |
| |
Melanoma |
2 |
0.5 |
| |
Bladder |
2 |
0.5 |
| |
Uterus |
1 |
0.2 |
| Metastasis |
No |
286 |
69.4 |
| |
Yes |
126 |
30.6 |
Table 1: Baseline characteristics of patients from the ACTION study who qualified for analysis.
Tumor response
Of the 412 cases, 181 (44%) had complete response, 22 (5%) had partial response, 98 (24%) had stable disease while 111 (27%) had progressive disease (Figure 1).
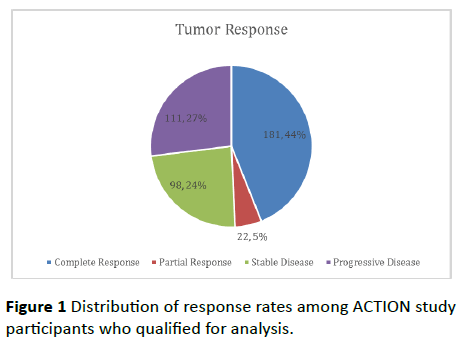
Figure 1 Distribution of response rates among ACTION study participants who qualified for analysis.
Association of demographic characteristics with tumor response
Interestingly, females tended to have better tumor response than males (p=0.000). Occupation seemed to associate significantly with tumor response (p=0.027) though this may simply be brought about by the wide variety of occupations seen from data.
There was no sufficient evidence found to associate tumor response with age (p=0.173), marital status (p=0.175) and education (p=0.782).
Cancer type was also associated with tumor response (p=0.000). Majority of patients who showed complete response were breast cancer patients (40.9%). Majority of partial responders were patients with colorectal disease (54.5%). For both stable disease and progressive disease, the dominating cancer type was breast cancer (38.8% and 54.1%, respectively) (Table 2).
| Tumor Response |
| Variables |
Complete Response |
Partial Response |
Stable Disease |
Progressive Disease |
p-Value |
| Count |
% |
Count |
% |
Count |
% |
Count |
% |
|
| Sex |
Female |
96 |
53% |
22 |
100% |
98 |
100% |
50 |
45.00% |
0 |
| Male |
85 |
47.0% |
0 |
0% |
0 |
0% |
61 |
55.00% |
|
| Age group |
18 to 29 |
14 |
7.7% |
2 |
9.1% |
7 |
7.1% |
0 |
0% |
0.173 |
| 30 to 39 |
19 |
10.5% |
3 |
13.6% |
16 |
16.3% |
17 |
15.30% |
| 40 to 49 |
46 |
25.4% |
5 |
22.7% |
23 |
23.5% |
27 |
24.30% |
| 50 to 59 |
61 |
33.7% |
11 |
50.0% |
29 |
29.6% |
37 |
33.30% |
| 60 to 69 |
31 |
17.1% |
1 |
4.5% |
14 |
14.3% |
24 |
21.60% |
| 70 to 79 |
10 |
5.5% |
0 |
0% |
9 |
9.2% |
6 |
5.40% |
| 80 to 90 |
0 |
0% |
0 |
0% |
0 |
0% |
0 |
0% |
| 90 to 99 |
0 |
0% |
0 |
0% |
0 |
0% |
0 |
0% |
| Marital status |
Never Married |
25 |
13.8% |
2 |
9.1% |
14 |
14.3% |
5 |
4.50% |
0.175 |
| Married |
127 |
70.2% |
17 |
77.3% |
68 |
69.4% |
91 |
82.00% |
| Widow |
20 |
11.0% |
1 |
4.5% |
14 |
14.3% |
11 |
9.90% |
| Divorced |
0 |
0% |
0 |
0% |
0 |
0.0% |
0 |
0% |
| Separated |
9 |
5.0% |
2 |
9.1% |
2 |
2.0% |
4 |
3.60% |
| House head |
No |
92 |
50.8% |
22 |
100% |
98 |
100% |
32 |
28.80% |
0 |
| Yes |
89 |
49.2% |
0 |
0% |
0 |
0% |
79 |
71.20% |
| Educational level |
No Schooling |
1 |
0.6% |
0 |
0% |
0 |
0% |
0 |
0% |
0.782 |
| Primary (6 years) |
47 |
26% |
7 |
31.8% |
23 |
23.5% |
23 |
20.70% |
| Secondary/High school (7-12 years) |
67 |
37.0% |
9 |
40.9% |
43 |
43.9% |
37 |
33.30% |
| Technical/Vocational |
16 |
8.8% |
2 |
9.1% |
8 |
8.2% |
11 |
9.90% |
| College/University |
50 |
27.6% |
4 |
18.2% |
24 |
24.5% |
40 |
36.00% |
| Occupation |
Manager |
5 |
2.8% |
1 |
4.5% |
2 |
2.0% |
2 |
1.80% |
0.027 |
| Professional |
18 |
9.9% |
2 |
9.1% |
4 |
4.1% |
17 |
15.30% |
| Technician |
8 |
4.4% |
0 |
0% |
1 |
1.0% |
1 |
0.90% |
| Clerical Suppport Wokers |
6 |
3.3% |
2 |
9.1% |
3 |
3.1% |
9 |
8.10% |
| Service and Scale Worker |
61 |
33.7% |
10 |
45.5% |
38 |
38.8% |
30 |
27.00% |
| Agricultural, Forestry and Fishery Workers |
9 |
5.0% |
3 |
13.6% |
11 |
11.2% |
14 |
12.60% |
| Craftes and related trade worker |
10 |
5.5% |
1 |
4.5% |
5 |
5.1% |
3 |
2.70% |
| Factory Labourer |
17 |
9.4% |
1 |
4.5% |
5 |
5.1% |
2 |
1.80% |
| In military |
1 |
0.6% |
0 |
0% |
0 |
0% |
0 |
0% |
| Elementary occupation |
4 |
2.2% |
0 |
0% |
0 |
0% |
4 |
3.60% |
| Home Duties |
10 |
5.5% |
1 |
4.5% |
14 |
14.3% |
15 |
13.50% |
| None |
32 |
17.7% |
1 |
4.5% |
15 |
15.3% |
14 |
12.60% |
| Current cancer site |
Mouth and Pharynx |
8 |
4.4% |
4 |
18.2% |
21 |
21.4% |
8 |
7.20% |
0 |
| Oesophagus |
0 |
0% |
0 |
0% |
0 |
0% |
0 |
0% |
| Stomach |
0 |
0% |
0 |
0% |
2 |
2.0% |
0 |
0% |
| Colon and Rectum |
32 |
17.7% |
12 |
54.5% |
22 |
22.4% |
24 |
21.60% |
| Liver |
0 |
0% |
0 |
0% |
0 |
0% |
0 |
0% |
| Pancreas |
0 |
0% |
0 |
0% |
0 |
0% |
0 |
0% |
| Trachea, Bronchus and Lung |
9 |
5.0% |
1 |
4.5% |
2 |
2.0% |
4 |
3.6% |
| Melanoma |
0 |
0% |
1 |
4.5% |
0 |
0% |
1 |
0.9% |
| Female Breast |
74 |
40.9% |
2 |
9.1% |
38 |
38.8% |
60 |
54.1% |
| Cervix |
0 |
0% |
0 |
0% |
0 |
0% |
0 |
0% |
| Uterus |
1 |
0.6% |
0 |
0% |
0 |
0% |
0 |
0% |
| Ovary |
0 |
0% |
0 |
0% |
0 |
0% |
0 |
0% |
| Prostate |
2 |
1.1% |
0 |
0% |
2 |
2.0% |
0 |
0% |
| Bladder |
0 |
0% |
1 |
4.5% |
0 |
0% |
1 |
0.9% |
| Lymphomas and Multiple Myeloma |
29 |
16.0% |
0 |
0% |
0 |
0% |
0 |
0% |
| Leukemia |
0 |
0% |
0 |
0% |
0 |
0% |
0 |
0% |
| Other Malignant Neoplasm |
26 |
14.4% |
1 |
4.5% |
11 |
11.2% |
13 |
11.7% |
| Is the cancer metastasis? |
No |
55 |
30.4% |
22 |
100% |
98 |
100% |
111 |
100% |
0 |
| Yes |
126 |
69.6% |
0 |
0% |
0 |
0% |
0 |
0% |
Table 2: Association of demographic data with tumor response among ACTION study patients who qualified for analysis.
Change in quality of life from month 1 to month 12 of treatment
The modal response was “no change” for mobility (64.3%), self-care (64.6%), usual activities (45.1%), pain (100%) and anxiety/depression (43.9%). For patients who indicated change in quality of life, responses signified worse in mobility (21.4%), worse in self-care (27.7%), better in usual activities (33%), and better QOL in terms of anxiety and depression (32.3%).
Most patients (62.6%) reported worse VAS while 29.4% signified better VAS. Only 8% reported no change (Table 3).
| Change in Quality of Life in Month |
Count |
% |
| Mobility |
Better |
59 |
14.30% |
| No change |
265 |
64.30% |
| Worse |
88 |
21.40% |
| Self-Care |
Better |
32 |
7.80% |
| No change |
266 |
64.60% |
| Worse |
144 |
27.70% |
| Usual Activities |
Better |
136 |
33.00% |
| No change |
186 |
45.10% |
| Worse |
90 |
21.80% |
| Pain |
Better |
0 |
0% |
| No change |
412 |
100% |
| Worse |
0 |
0% |
| Anxiety/Depression |
Better |
133 |
32.30% |
| No change |
181 |
43.90% |
| Worse |
98 |
23.80% |
| VAS |
Better |
121 |
29.40% |
| No change |
33 |
8.00% |
| Worse |
258 |
62.60% |
Table 3 Actual count and percentages of patients and their corresponding change in each dimension of the EQ5D-3L questionnaire.
Association of change in quality of life with tumor response
Improvement in quality of life was significantly associated with tumor response. Data showed that complete or partial response tended to relate with better QOL while progressive disease related to worse situations with respect to mobility (p=0.000), self-care (p=0.000), usual activities (p=0.000) and anxiety/depression (p=0.000). On the other hand, both anxiety and usual care dimensions showed improvement in approximately 50% of the patients (among complete responders). No statistical test was done for pain since all patients reported no change (Table 4).
| Tumor Response (All Cases) |
| Change in Quality of Life from Month 1 to 12 |
Complete Response |
Partial Response |
Stable Disease |
Progressive Disease |
p-Value |
| Count |
% |
Count |
% |
Count |
% |
Count |
% |
|
| Mobility |
Better |
29 |
16.0% |
3 |
13.6% |
21 |
21.4% |
6 |
5.4% |
|
| No change |
148 |
81.8% |
16 |
72.7% |
65 |
66.3% |
36 |
32.4% |
0 |
| Worse |
4 |
2.2% |
3 |
13.6% |
12 |
12.2% |
69 |
62.2% |
|
| Self-care |
Better |
20 |
11.0% |
2 |
9.1% |
7 |
7.1% |
3 |
2.7% |
|
| No change |
154 |
85.1% |
13 |
59.1% |
74 |
75.5% |
25 |
22.5% |
0 |
| Worse |
7 |
3.9% |
7 |
31.8% |
17 |
17.3% |
83 |
74.8% |
|
| Usual activities |
Better |
90 |
49.7% |
3 |
13.6% |
32 |
32.7% |
11 |
9.9% |
|
| No change |
86 |
47.5% |
11 |
50.0% |
54 |
55.1% |
35 |
31.5% |
0 |
| Worse |
5 |
2.8% |
8 |
36.4% |
12 |
12.2% |
65 |
58.6% |
|
| Pain |
Better |
0 |
0% |
0 |
0% |
0 |
0% |
0 |
0% |
|
| No change |
181 |
100% |
22 |
100% |
98 |
100% |
111 |
100% |
No Test |
| Worse |
0 |
0% |
0 |
0% |
0 |
0% |
0 |
0% |
|
| Anxiety/Depression |
Better |
85 |
47.0% |
6 |
27.3% |
29 |
29.6% |
13 |
11.7% |
|
| No change |
89 |
49.2% |
12 |
54.5% |
53 |
54.1% |
27 |
24.3% |
0 |
| Worse |
7 |
3.9% |
4 |
18.2% |
16 |
16.3% |
71 |
64.0% |
|
| VAS |
Better |
17 |
9.4% |
5 |
22.7% |
20 |
20.4% |
79 |
71.2% |
|
| No change |
14 |
7.7% |
1 |
4.5% |
10 |
10.2% |
8 |
7.2% |
0 |
| Worse |
150 |
82.9% |
16 |
72.7% |
68 |
69.4% |
24 |
21.6% |
|
Table 4: Association of tumor response to change in in each dimension of the EQ5D-3L questionnaire among all patients in the ACTION study who qualified for analysis.
Association of change in QOL with tumor response among cancer types
Focusing on the four most frequent cases in the database, the general pattern seen above was reflected in female breast cancer cases, colon and rectal cancer, and other malignant neoplasms.
However for mouth and pharynx cancer cases, tumor response did not relate significantly with change in quality of life for mobility (p=0.576), self-care (p=0.709), usual activities (p=0.209), anxiety/depression (p=0.732) and VAS (p=0.140). There was no test done for pain due to the common reply of “No Change” among patients regardless of tumor response (Tables 5-8).
| Tumor Response (Female Breast Cancer) |
| Change in Quality of Life from Month 1 to 12 |
Complete Response |
Partial Response |
Stable Disease |
Progressive Disease |
p-Value |
| |
|
Count |
% |
Count |
% |
Count |
% |
Count |
% |
|
| Mobility |
Better |
16 |
21.6% |
1 |
50.0% |
5 |
13.2% |
1 |
1.7% |
0 |
| |
No change |
57 |
77% |
1 |
50.0% |
28 |
73.7% |
14 |
23.3% |
|
| |
Worse |
1 |
1.4% |
0 |
0.0% |
5 |
13.2% |
45 |
75.0% |
|
| Self-Care |
Better |
9 |
12.2% |
0 |
0.0% |
3 |
7.9% |
1 |
1.7% |
0 |
| |
No change |
64 |
86.5% |
1 |
50.0% |
28 |
73.7% |
9 |
15.0% |
|
| |
Worse |
1 |
1.4% |
1 |
50.0% |
7 |
18.4% |
50 |
83.3% |
|
| Usual Activities |
Better |
39 |
52.7% |
0 |
0.0% |
14 |
36.8% |
6 |
10.0% |
0 |
| |
No change |
34 |
45.9% |
2 |
100.0% |
19 |
50.0% |
13 |
21.7% |
|
| |
Worse |
1 |
1.4% |
0 |
0.0% |
5 |
13.2% |
41 |
68.3% |
|
| Pain |
Better |
0 |
0% |
0 |
0.0% |
0 |
0.0% |
0 |
0.0% |
No Test |
| |
No change |
74 |
100% |
2 |
100.0% |
38 |
100.0% |
60 |
100.0% |
|
| |
Worse |
0 |
0% |
0 |
0.0% |
0 |
0.0% |
0 |
0.0% |
|
| Anxiety/Depression |
Better |
37 |
50.0% |
0 |
0.0% |
9 |
23.7% |
3 |
5.0% |
0 |
| |
No change |
36 |
48.6% |
1 |
50.0% |
24 |
63.2% |
15 |
25.0% |
|
| |
Worse |
1 |
1.4% |
1 |
50.0% |
5 |
13.2% |
42 |
70.0% |
|
| VAS |
Better |
6 |
8.1% |
0 |
0.0% |
7 |
18.4% |
50 |
83.3% |
0 |
| |
No change |
2 |
2.7% |
0 |
0.0% |
5 |
13.2% |
3 |
5.0% |
|
| |
Worse |
66 |
89.2% |
2 |
50.0% |
26 |
68.4% |
7 |
11.7% |
|
Table 5 Association of tumor response to change in in each dimension of the EQ5D-3L questionnaire among all breast cancer patients in the ACTION study who qualified for analysis.
| Tumor Response (Colon and Rectal Cancer) |
| Change in Quality of Life from Month 1 to 12 |
Complete Response |
Partial Response |
Stable Disease |
Progressive Disease |
p-Value |
| Count |
% |
Count |
% |
Count |
% |
Count |
% |
|
| Mobility |
Better |
5 |
15.6% |
0 |
0.0% |
7 |
31.8% |
1 |
4.2% |
|
| No change |
27 |
84.4% |
9 |
75.0% |
12 |
54.5% |
7 |
29.2% |
0 |
| Worse |
0 |
0.0% |
3 |
25.0% |
3 |
13.6% |
16 |
66.7% |
|
| Self-Care |
Better |
3 |
9.4% |
1 |
8.3% |
2 |
9.1% |
0 |
0.0% |
|
| No change |
29 |
90.6% |
6 |
50.0% |
16 |
72.7% |
3 |
12.5% |
0 |
| Worse |
0 |
0.0% |
5 |
41.7% |
4 |
18.2% |
21 |
87.5% |
|
| Usual Activities |
Better |
14 |
43.8% |
2 |
16.7% |
4 |
18.2% |
1 |
4.2% |
|
| No change |
18 |
56.3% |
4 |
33.3% |
15 |
68.2% |
9 |
37.5% |
0 |
| Worse |
0 |
0.0% |
6 |
50.0% |
3 |
13.6% |
14 |
58.3% |
|
| Pain |
Better |
0 |
0% |
0 |
0% |
0 |
0% |
0 |
0% |
|
| No change |
32 |
100% |
12 |
100% |
22 |
100% |
24 |
100% |
No Test |
| Worse |
0 |
0% |
0 |
0% |
0 |
0% |
0 |
0% |
|
| Anxiety/Depression |
Better |
15 |
46.9% |
4 |
33.3% |
8 |
36.4% |
3 |
12.5% |
|
| No change |
16 |
50.0% |
6 |
50.0% |
10 |
45.5% |
4 |
16.7% |
0 |
| Worse |
1 |
3.1% |
2 |
16.7% |
4 |
18.2% |
17 |
70.8% |
|
| VAS |
Better |
1 |
3.1% |
3 |
25.0% |
5 |
22.7% |
16 |
66.7% |
|
| No change |
4 |
12.5% |
1 |
8.3% |
1 |
4.5% |
2 |
8.3% |
0 |
| Worse |
27 |
84.4% |
8 |
66.7% |
16 |
72.7% |
6 |
25.0% |
|
Table 6 Association of tumor response to change in in each dimension of the EQ 5D 3L questionnaire among all colorectal cancer patients in the ACTION study who qualified for analysis.
| Tumor Response (Other Malignant Neoplasm) |
| Change in Quality of Life from Month 1 to 12 |
Complete Response |
Partial Response |
Stable Disease |
Progressive Disease |
p-Value |
| Count |
% |
Count |
% |
Count |
% |
Count |
% |
|
| Mobility |
Better |
2 |
7.7% |
1 |
100.0% |
1 |
9.1% |
0 |
0.0% |
|
| No change |
21 |
80.8% |
0 |
0.0% |
8 |
72.7% |
5 |
38.5% |
0.001 |
| Worse |
3 |
11.5% |
0 |
0.0% |
2 |
18.2% |
8 |
61.5% |
|
| Self-care |
Better |
2 |
7.7% |
0 |
0.0% |
0 |
0.0% |
0 |
0.0% |
|
| No change |
22 |
84.6% |
1 |
100.0% |
8 |
72.7% |
3 |
23.1% |
0.001 |
| Worse |
2 |
7.7% |
0 |
0.0% |
3 |
27.3% |
10 |
76.9% |
|
| Usual activities |
Better |
13 |
50.0% |
0 |
0.0% |
2 |
18.2% |
2 |
15.4% |
|
| No change |
11 |
42.3% |
1 |
100.0% |
8 |
72.7% |
3 |
23.1% |
0.002 |
| Worse |
2 |
7.7% |
0 |
0.0% |
1 |
9.1% |
8 |
61.5% |
|
| Pain |
Better |
0 |
0% |
0 |
0.0% |
0 |
0.0% |
0 |
0.0% |
|
| No change |
26 |
100% |
1 |
100.0% |
11 |
100.0% |
1 |
100.0% |
No Test |
| Worse |
0 |
0% |
0 |
0.0% |
0 |
0.0% |
0 |
0.0% |
|
| Anxiety/Depression |
Better |
11 |
42.3% |
0 |
0.0% |
1 |
9.1% |
2 |
15.4% |
|
| No change |
12 |
46.2% |
1 |
100.0% |
8 |
72.7% |
2 |
15.4% |
0.002 |
| Worse |
3 |
11.5% |
0 |
0.0% |
2 |
18.2% |
9 |
69.2% |
|
| VAS |
Better |
3 |
11.5% |
0 |
0.0% |
6 |
54.5% |
10 |
76.9% |
|
| No change |
2 |
7.7% |
0 |
0.0% |
2 |
18.2% |
0 |
0.0% |
0.002 |
| Worse |
21 |
80.8% |
1 |
100.0% |
3 |
27.3% |
3 |
23.1% |
|
Table 7 Association of tumor response to change in in each dimension of the EQ5D-3L questionnaire among all cancer patients with other malignancies in the ACTION study who qualified for analysis.
| Tumor Response (Mouth and Pharynx Cancer) |
| Change in Quality of Life from Month 1 to 12 |
Complete Response |
Partial Response |
Stable Disease |
Progressive Disease |
p-Value |
| Count |
% |
Count |
% |
Count |
% |
Count |
% |
|
| Mobility |
Better |
0 |
0.0% |
1 |
25.0% |
7 |
33.3% |
2 |
25.0% |
|
| No change |
8 |
100% |
3 |
75.0% |
13 |
61.9% |
6 |
75.0% |
0.576 |
| Worse |
0 |
0.0% |
0 |
0.0% |
1 |
4.8% |
0 |
0.0% |
|
| Self-care |
Better |
2 |
25.0% |
1 |
25.0% |
2 |
9.5% |
1 |
12.5% |
|
| No change |
6 |
75.0% |
2 |
50.0% |
16 |
76.2% |
5 |
62.5% |
0.709 |
| Worse |
0 |
0.0% |
1 |
25.0% |
3 |
14.3% |
2 |
25.0% |
|
| Usual activities |
Better |
5 |
62.5% |
1 |
25.0% |
10 |
47.6% |
1 |
12.5% |
|
| No change |
3 |
37.5% |
1 |
25.0% |
8 |
38.1% |
5 |
62.5% |
0.209 |
| Worse |
0 |
0.0% |
2 |
50.0% |
3 |
14.3% |
2 |
25.0% |
|
| Pain |
Better |
0 |
0.0% |
0 |
0.0% |
0 |
0.0% |
0 |
0.0% |
|
| No change |
8 |
100.0% |
4 |
100.0% |
21 |
100.0% |
8 |
100.0% |
No Test |
| Worse |
0 |
0.0% |
0 |
0.0% |
0 |
0.0% |
0 |
0.0% |
|
| Anxiety/Depression |
Better |
5 |
62.5% |
2 |
50.0% |
7 |
33.3% |
3 |
37.5% |
|
| No change |
3 |
37.5% |
1 |
25.0% |
10 |
47.6% |
4 |
50.0% |
0.732 |
| Worse |
0 |
0% |
1 |
25.0% |
4 |
19.0% |
1 |
12.5% |
|
| VAS |
Better |
0 |
0.0% |
1 |
25.0% |
1 |
4.8% |
2 |
25.0% |
|
| No change |
2 |
25.0% |
0 |
0.0% |
2 |
9.5% |
3 |
37.5% |
0.14 |
| Worse |
6 |
75.0% |
3 |
75.0% |
18 |
85.7% |
3 |
37.5% |
|
Table 8 Association of tumor response to change in in each dimension of the EQ5D-3L questionnaire among all head and neck cancer patients in the ACTION study who qualified for analysis.
Discussion
The only demographic data in this analysis showing correlation with tumor response in published articles was sex [13]. Neither age, marital status nor education was associated with tumor response. Specific cancer types are strongly correlated with tumor response. 40% of patients who had breast cancer showed complete response. This is probably because of the sheer number of patients (statistical) or the improved management options provided by the latest advancements in breast cancer management [14].
In this study, improvement in quality of life was significantly associated with tumor response. Complete or partial responders answered improvement in their QoL while progressive disease related to worse situations. Breaking down the EQ 5D 3L into domains further strengthen the impact of tumor response to QoL. Improvement in mobility, self-care, usual activities and anxiety/depression was statistically correlated with complete and partial responders. More importantly, both anxiety and usual care dimensions showed improvement in approximately 50% of the patients (among complete responders). This is reflective of the previous study by Ngelangel that improvement in the anxiety and depression, and usual activity dimensions should be seen post chemotherapy in the Filipino population [15]. Despite different cancer types, the general trend of improving anxiety and depression and usual activities dimensions is reflective for breast cancer, colorectal and other cancer types among patients who respond completely to treatment. Further strengthening the observation in the previous study.
However, in this study it was noted that for domains mobility and self-care, majority of complete responders showed no change (81% and 85%, respectively). The explanation maybe cultural in nature, Tchen et al., noted that different cultures tend to respond differently to different aspects of the QoL [16]. Majority of the patients in this study belong to the working class and working age group (92%). These patients tend to negate the negative effects of the oncologic intervention (i.e., still mention that they are still in best of health) as assurance of their capability as financial providers. The overwhelming importance of the ability to provide food for the family surpasses all aspects of the quality of life questionnaire. This may be partly reflective of the modal response “no change” which becomes acceptable among this group of patients.
The question of acceptability of use of universally accepted questionnaires is also challenged in this study. Despite the wide use of the EQ 5D 3L, the main limitation of this scale is the limited range it covers: positive, neutral, negative. More importantly, a similar study locally has established the role of cultural differences which might also affect the results of these questionnaires. The UP-DOH QoL scale is an excellent example of a culturally centered questionnaire [17]. This QoL scale was established using 5 domains with a range of 1 to 7, higher scores showed better QoL. Unlike the EQ 5D3L, the UP-DOH QoL scale is culturally centered and validated among Filipinos which may better reflect the changes in QoL.
Another important finding seen in this study is the use of secondary data in assuming relationships needing more careful attention. It should be speculated that since a different objective was proposed in the previous trial, the results in the quality of life might change as well. If so, the differences in the objectives of both studies may hinder the formation of realistic associations. However, despite this, the use of secondary data should still offer insights which may strengthen previous facts. In general, caution should be exercised in using these data and its interpretations
Conclusion
Quality of life does correlate to tumor response. In the clinics, we see patients with good response and also mentioning of their improved QOL. However, this is not similar among all cancer types.
The use of EQ5D-3L is limited to placing the post chemotherapeutic experience a range of three (3). This may limit the descriptive power as a whole especially when comparing pre and post chemotherapy QoL. This may be reflective of the results in our study. However, cultural trends might have also greatly influence the decision of patients in answering the EQ5D-3L questionnaire. Filipino resilience and coping mechanism to the 5 dimensions is reflective of the results in this study. In general, majority of Filipinos tend to disregard mobility, self-care, usual activities, pain and anxiety/ depression as long as cancer therapeutics is continued without delay.
True enough, cancer patients may benefit greatly, despite cancer therapy, if their normal functioning is preserved. Although no current molecular explanation is available, it is always best to consider QoL in determining the most appropriate cancer therapy.
Glossary
EQ5D-3L standardised measure of health status developed by the EuroQol Group in order to provide a simple, generic measure of health for clinical and economic appraisal Invalid Source Specified.
Complete Response (CR) – Disappearance of all extranodal target lesions. All pathological lymph nodes must have decreased to <10mm in short axis
Partial Response (PR) – At least a 30% decrease in the sum of diameters of target lesions, taking as reference the baseline sum of diameters
Progressive Disease (PD) – Sum of diameters increased by at least 20% from the smallest value on study (including baseline, if that is the smallest). The sum of diameters must also demonstrate an absolute increase of at least 5mm.
Stable Disease (SD) – Neither sufficient shrinkage to qualify for PR nor sufficient increase to qualify for PD.
19620
References
- David O (2011) Health related quality of life and cancer clinical trials. Ther Adv Med Oncol 3: 57–71.
- Eisenhauer EA, Therasse P, Bogaerts J, Schwartz LH, Sargent D, et al. (2009) New response evaluation criteria in solid tumours: Revised RECIST guideline (version 1.1). Eur J Cancer 45: 228-247.
- Anderson JR, Cain KC, Gelber RD (2006) Analysis of survival by tumor response and other comparisons of time-to-event by outcome variables. J Clin Oncol 26: 3913-3915.
- Modi S, Panageas KS, Duck ET, Bach A, Weinstock N, et al. (2002) Prospective exploratory analysis of the association between tumor response, quality of life, and expenditures among patients receiving paclitaxel monotherapy for refractory metastatic breast cancer. J Clin Oncol 20: 3665-3673.
- Shin DB, Bang SM, Park SH, Kang HG, Jue JI, et al. (2008) Correlation of quality of life with tumor response in patients receiving palliative chemotherapy for advanced gastrointestinal tumors. Med Oncol 25: 81-87.
- Wu YL, Fukuoka M, Mok TS, Saijo N, Thongprasert S, et al. (2013) Tumor response and health-related quality of life in clinically selected patients from Asia with advanced non-small-cell lung cancer treated with first-line gefitinib: Post hoc analyses from the IPASS study. Lung Cancer 81: 280-287.
- Kenne SE, Oden A, Ohlen J, Gaston-Johansson F, Holmberg SB (2009) Changes in health-related quality of life may predict recurrent breast cancer. Eur J Oncol Nurs 13: 323-329.
- Siddiqui F, Pajak T, Watkins-Bruner D, Konski AA, Coyne JC, et al. Pretreatment quality of life predicts for locoregional control in head and neck cancer patients: A Radiation Therapy Oncology Group Analysis. Int J Radiat Oncol Biol Phys 70: 353–360.
- Demegillo KJ, Ngelangel CA (2016) Association between baseline EQ5D quality of life with 1-year survival among cancer patients from two Philippine Government Medical Oncology Clinics. Section of Medical Oncology, UP- Philippine General Hospital.
- Kimman M, Jan S, Kingston D, Monaghan H, Sokha E, et al. (2012) Socioeconomic impact of cancer in member countries of the Association of Southeast Asian Nations (ASEAN): the ACTION study protocol. Asian Pac J Cancer Prev 13: 421-425.
- The EuroQol Group (1990) EuroQol-A new facility for the measurement of health-related quality of life. Health Policy 16: 199-208.
- De Vita VT, Lawrence TS, Rosenberg SA, Hellman D (2015) Cancer: Principle and practice of oncology (10th edn) Wolters Kluwer Health.
- Ngelangel CA, Wang EH (2002) Cancer and the Philippine Cancer Control Program. Jpn J Clin Oncol 32: 52-61.
- Ngelangel CA (2008) Quality of life of Filipino cancer patients. Asia-Pacific Ocology & Haematology 1: 18–19.
- Tchen N, Bedard P, Yi QL, Klein M, Cella D, et al. (2003) Quality of life and understanding of disease status among cancer patients of different ethnic origin. Br J Cancer. 89: 641-647.
- Ramiro LS, Ngelangel CA, Amarillo ML (1996) The UP-DOH QOL Scale: Measures of quality of life of Filipino cancer patients. J Clin Epidemiol 49: 19.