Keywords
Dyslexia; Genetic markers; Learning disabilities; Immune diseases; KIAA gene; OR
Introduction
A unique human gift is language. It is a complex process that enables social functioning and communication. Language gave humans an increased chance of survival thus giving the humans an enormous edge over others [1]. Most children acquire language naturally in the sequence of listening, speaking, reading and writing. Failure in any of these processes may lead to lifelong mental health consequences and social deficits [2].
Dyslexia is a difficulty in learning to read and spell despite adequate education, intelligence and socio-cultural opportunities and without any obvious sensory deficits [3]. Dyslexia accounts for 80% of learning disabilities. Prevalence of the trait ranges from 3% to 17.5% of school-age children [3].
Hormonal factors such as fetal testosterone levels during late pregnancy may play a critical role. This is possibly reflected in the large male predominance of dyslexia boys [4] more often than girls are affected by all the cognitive developmental disorders of childhood. Dyslexia has a complex link with sex hormones and immune diseases especially with testosterone [5].
The incidence of neurological, allergic, and immune reactive conditions such as dyslexia, eczema, psoriasis, childhood diabetes, allergies, asthma, etc. have been increasing rapidly in recent years. A report by the National Research Council in 2000 found that 50% of all pregnancies in the USA were resulting in prenatal or postnatal mortality, significant birth defects, developmental disabilities or otherwise chronically unhealthy babies. Recent studies published in JAMA report found similar trends continuing with huge increases in children’s chronic conditions.
Incidence of chronic developmental conditions in infants more than doubled between 1988 and 2006, especially learning and behavioral problems, asthma and obesity. There has been a similar sharp increase in developmental disabilities in Canadian children over the last 2 decades (CICH; 2000), including learning disabilities and behavioral problems, asthma and allergies, and childhood cancer. Studies have documented that the primary cause of the increased developmental conditions are increased toxic exposures, including increased use of vaccines with toxic and inflammatory ingredients (Windham).
Pushpa savior showed that allergy, delayed milestones, low level of blood cholesterol migraine and certain fatty acid deficiency signs were found to be associated with dyslexia. Since complex array of symptoms are associated with dyslexia an integrated research approach is needed for effective diagnosis and remediation of dyslexia.
High levels of unconjugated bilirubin and kernicterus affects the basal ganglia and the formation of astrocytes, and possibly also the hippocampus, the thalamus and central parts of the cerebellum. The hippocampus has important functions in the storing of new information in forms that can be used in longterm memory. Damage to the left region of the hippocampus impairs verbal memory in all its modalities.
Impaired formation of astrocytes associated with high levels of unconjugated bilirubin should be considered as an etiological factor in poor memory. It is recommended that pediatricians should suggest early screening procedures to infants at risk. With early screening for possible deficiencies of attention, memory, and visual-motor integration functioning as well as intervention programs the learning difficulties can be addressed and remediation started earlier in life.
Multiple etiologies are proposed for this complex trait, the exact cause still remains unknown; but substantial evidence from genetic and neurological studies suggests that dyslexia is a disorder which is influenced by genetic factors and the underlying deficit is in the language areas of the brain. Many theories are put forward to explain the etiology of dyslexia.
Twin studies have shown a concordance rate of 68% in monozygotic twins versus 38% in dizygotic twins [6]. An autosomal dominant pattern of inheritance of dyslexia has been hypothesized in families collected in southern India [7,8], performed a genome scan with 320 markers showing a novel dominant locus linked to dyslexia in the peri-centromeric region of chromosome 3 with a multipoint lod score of 3.84. Nineteen out of 21 affected pedigree members shared this region identical by descent (corrected p<0.001).
Numerous candidate genes have emerged from genetic association studies and the characterization of chromosomal translocations in individuals with Dyslexia, including DYX1C1 on 15q21 [9], ROBO1 on 3p12 [10] DCDC2 [11] and KIAA0319 [12] on 6p22, and MRPL19 and C2ORF3 on 2p12 [13]. Several of these genes have been implicated in brain development [14]. In particular, RNAi-knockdown studies suggest that DYX1C1, DCDC2 [11], and KIAA0319 [15] play a role in neuronal migration during the development of the rat cortex. Altered neuronal migration has been implicated in Dyslexia based on the only post-mortem anatomical study conducted to date [16]; specifically, the brains of dyslexic individuals were found to have subtle structural anomalies consistent with defective neuronal migration.
In individuals with dyslexia, an association between dyslexia and a 77 kb region on chromosome 6p22.2 spanning the TTRAP gene (605764) and the first 4 exons of KIAA0319. One main risk haplotype (1-1-2) for reading disability (frequency of approximately 12%) was found in both UK and USA samples: the 1-1-2 haplotype comprised rs4504469, rs2038137, and rs2143340 [12].
6 SNPs in the 6p22.2 region showed significant evidence of association with dyslexia, including a SNP in exon 4 of the KIAA0319 gene that changed an amino acid (A311T, rs4504469). Haplotype data implicated KIAA0319 as a susceptibility gene for dyslexia [17].
The reading disability may be related to irregularities in neuronal migration, and down regulation of KIAA0319 may be a susceptibility factor in the development of dyslexia when combined with other genetic and environmental factors. KIAA0319 has turned out to be involved with controlling the early development of the brain. It may also underlie the unfortunate tendency of the immune system of dyslexics to cause allergies, eczema etc. [18].
A risk haplotype associated with dyslexia on chromosome 6p22.2 which span the TTRAP gene and portions of THEM2 and KIAA0319 has been shown [18].
A pathophysiological correlates of dyslexia of the candidate genes discussed to date, shows the most convincing evidence for DCDC2 and KIAA0319 on chromosome 6. With DCDC2, as with KIAA0319, inhibition leads to poorer neuronal migration in the neo cortex of fetal rats through specific small interfering RNAs [18,19].
(a) a dyslexia associated haplotype has been implicated in the reduced expression of KIAA0319, and (b) the strongest association has been found for the region spanning exon 1 of KIAA0319 [20]. The variant (s) responsible for reduced KIAA0319 expression resides on the risk haplotype close to the gene’s transcription start site. Seven single nucleotide polymorphisms on the risk haplotype immediately upstream of KIAA0319, were determined that three of these are strongly associated with multiple reading-related traits.
A variant residing outside of the protein-coding region of KIAA0319 has been discovered that reduces expression of the gene [21]. This variant creates a binding site for the transcription factor OCT-1. In this case, reduced KIAA0319 expression could lead to improper development of regions of the brain involved in reading ability. This is the first study to identify a functional variant implicated in dyslexia.
Using luciferase-expressing constructs containing the KIAA0319 upstream region [22], characterized the minimal promoter and additional putative transcriptional regulator regions. This revealed that the minor allele of rs9461045, which shows the strongest association with dyslexia in the sample (max p-value = 0.0001), confers reduced luciferase expression in both neuronal and non-neuronal cell lines.
Several putative functional variants including a microsatellite (JA04) and rs71815143, of which JA04 showed evidence for association to Dyslexia [22]. The microsatellite may create risk for Dyslexia by transitioning from B to Z-DNA, which can increase or decrease gene expression, depending on the gene context.
The first evidence that decreased expression of the dyslexiaassociated gene KIAA0319 can alter cortical responses and impair phoneme processing in auditory cortex [23].
Shyamala K, Venkatesh, screened twenty SNPs located within the coding region of these three candidate genes (KIAA, DCDC2, DYX1C1) by mass ARRAY technique. At this point, there was no statistical evidence of association between the allelic variation in the three candidate genes and Dyslexia in the sample.
Venkatesh SK, et al. has showed the most consistent evidence of linkage for Dyslexia and two susceptible genes KIAA0319 and DCDC2 at DYX2 locus which showed significant association. Specific candidate gene-association studies have identified variants, risk haplotypes and microsatellites of KIAA0319 and DCDC2 correlated with wide range of readingrelated traits. The study demonstrated the association of Dyslexia with SNP rs4504469 of KIAA0319 and not with any SNPs of DCDC2.
Even though interest and knowledge about dyslexia is increasing, decades of multidisciplinary research in this area in different parts of the world does not provide proper diagnostic criteria. In this regard, genetic analysis promises some insights into the problem. Several phenotypes have been found in dyslexia, but the etiological link between these related phenotypes and genotype is yet to be established. Much study is needed in this area to prove a definitive relationship between phenotype and genotype of dyslexia. Thus, isolation and analysis of the genetic variants will initiate a new phase of research which will provide a more fundamental understanding of the nature of dyslexia, eventually leading to early diagnosis, risk estimation, better methods of treatment and prevention.
Dyslexia is a major educational problem in our country and its wide presence has to be acknowledged and dealt with. Pupils with dyslexia are generally ignored and passed unnoticed in schools, until they become dropouts or delinquents. There is a great dearth of proper statistical data to show the incidence of dyslexia among pupils in India. No substantial and significant research work has been undertaken in our country in this regard.
If this area is neglected any more, our country may face a high dropout rate of pupils at the elementary stage of education. There should be implementation of legislation in the country to take utmost care of these children, because dyslexia is an invisible handicap.
So far, no studies have been conducted in Telangana population, regarding the association of four candidate genes for Dyslexia except, for one study from India [7], who have conducted a study regarding the association of KIAA gene with only 50 Dyslexia cases (not statistically significant). They found a negative association for this gene. Our study will be the first of its kind in India to carry out screening of SNPs in statistically significant number of 100 for Dyslexia. This will identify the Single Nucleotide Polymorphisms which are associated with Dyslexia.
The present study also shows the association of dyslexia with allergy, eczema and increased unconjugated bilirubin. This study is the first of its kind to find the association of dyslexia with increased unconjugated bilirubin.
The present study may reveal the complex molecular mechanisms behind the development of the brain and lead to new treatments in the future.
Methodology
Study subjects
The study samples were selected from the Department of Child Psychiatry, Niloufer Hospital and Institute of Child Health, Hyderabad. With the help of psychiatrists and psychologists 100 samples and 100 control samples have been selected for the study subject. All the samples and controls are matched with age and sex. All the affected individuals were assessed by the psychiatrist and psychologist by taking clinical history, family history and age at diagnosis. Also consent of each individual (parent) has been taken in the prescribed format for the study. Care was taken to avoid population admixture and only unrelated subjects from Indian origin was considered for the study.
Inclusion criteria
Dyslexic subjects were selected based on the following criteria: Age between 6-15 years, IQ>90, Discrepancy between ability and achievements, IQ test (Binet Kamath); Malin’s Intelligence Scale for Indian children (MISIC).
Diagnostic criteria based on DSM IV-R criteria for reading and spelling was followed. Schonell’s Graded word reading ability test, Schonell’s Graded word spelling test were done.
Exclusion criteria
Acquired Dyslexia, Dyscalculia, Dysphasia (articulation difficulty), Speech sound disorder (SSD), Specific language disorder (SLI), Mental retardation due to birth trauma, epilepsy and infections, like meningitis and encephalitis Emotional, environmental and educational causes were excluded.
Controls
Controls were collected from Niloufer Hospital, children in the age group of 6 to 15 years without learning difficulty.
Measurement of clinical and biochemical variables: History of birth weight, swallowing of meconium, birth cry delay, nausea and vomiting during pregnancy was taken. History of unconjugated bilirubin levels (cases with values between 10-15 mg/dl) after birth to 3 weeks was taken. History of phototherapy given was taken. History of allergy and eczema in the first 3 years was taken.
DNA was extracted from EDTA anti-coagulated whole blood by QIA am DNA Blood Mini Kit. The quantity and purity of each sample were determined by ND-1000 Spectrophotometer (NanoDrop Technologies, Wilmington, USA). After quantitation, the genomic DNA was diluted in to a concentration of 20 ng/l in 96 well plate for all mass array (Sequenom) based genotyping.
Genotyping was performed using Sequenom’s newly developed genotyping assay termed iPLEX Gold chemistry (www.sequenom.com). Briefly, the assay consists of an initial locus-specific PCR reaction, followed by single base extension using mass-modified di-deoxynucleotide terminators of an oligonucleotide primer which anneals immediately upstream of the polymorphic site of interest.
The Mass ARRAY Designer software can automatically design both PCR and Mass EXTEND primers for multiplexed assays. The software checks for and avoids primer combinations and non-template extension products that could possibly result in nonspecific extension. Briefly the flanking sequence (FASTA file) was retrieved from https:// www.ncbi.nlm.nih.gov/snp/ and the input FASTA file includes 500 base pairs of specific genomic sequences, 250 upstream and downstream from the SNP of interest.
The mass array genotyping involve the following steps a) Assay Design b) PCR Amplification, c) SAP Treatment, d) iPLEX Reaction, e) Clean Resin, f) Dispensing to Spectro-CHIP and g) MALDI-TOF MS Analysis.
Data analysis and software using SPSS
Phenotypic and genotypic data were analyzed using Statistical package for Social Sciences (SPSS) Windows, version 16.0. Estimation of allele frequencies; the standard casecontrol allelic association, One-way ANOVA and Logistic regression etc. were done. The statistical significance was defined as P<0.05.
Power was estimated using PS Power and Sample Size Calculations (Nashville, TN).
Plink
Plink is an open-source tool (https://pngu.mgh.harvard.edu/ purcell/plink/;Purcell) set for whole genome association and population based linkage analyses. PLINK enables the user to manage large genome wide datasets and perform standard summary statistics and association analyses. For PLINK the following file formats were made There are sets of map files and ped files for cases and controls. PED files contain six mandatory columns: Family ID; Individual ID; Paternal ID; Maternal ID; Sex. The map files contain information about the SNP genetic markers i.e., Chromosome; rs number or SNP identifier; Genetic distance; and Base-pair position.
The following comments were used in PLINK
Missing rate genotype & phenotype
plink --file chid. phd--missing --out chid. phd _missing
Genotype frequency
plink --file chid. phd --freq --out chid. phd _freq
Hardy-Weinberg equilibrium
plink --file chid. phd --hardy2 --out chid. phd _hardy2
Case/control association test
plink --file chid. phd --assoc --out chid. phd _assoc
Fisher’s Exact test (allelic association)
plink --file chid. phd --fisher --out chid. phd _fisher
Model association test
plink --file chid. phd --model --out chid. phd _model
Linear models
plink --file chid. phd --linear --out chid. phd _linear
Logistic models
plink --file chid. phd --logistic --out chid. phd _logistic
Haplotype
plink --file chid. phd --hap-window 4 --hap-assoc --out chid. phd _haps_haplo
Haploview
Linkage disequilibrium (LD) and Haplotype frequencies were estimated using Haploview software (https:// www.broad.mit.edu/mpg/haploview/). It generates LD information, haplotype blocks and population haplotype frequencies.
Results
The present study included 103 Dyslexic subjects and 100 controls. The gender wise association with dyslexia is done in the study. Association with unconjugated bilirubin levels and allergy is done statistically. The results of the molecular study in the patients are presented. The association analysis was carried out in this study by using Chi-square test and odd’s ratio.
Table 1 and Figure 1 show the gender distribution in dyslexia. The number of male cases is significantly high in dyslexia.
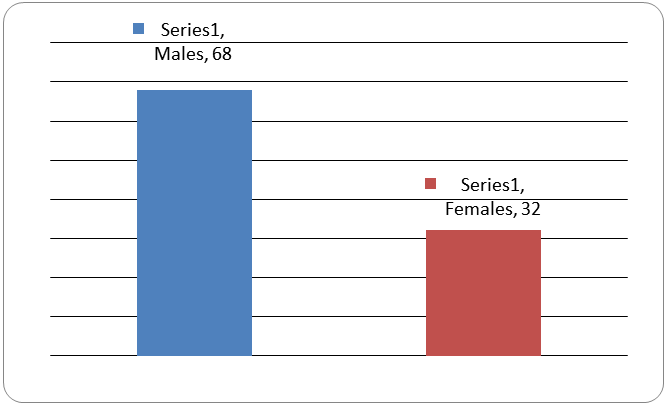
Figure 1: Showing the gender distribution in dyslexia.
| Cases (male) |
Cases (Female) |
p-value |
| 68 |
32 |
<0.0001 |
Table 1: Showing the gender distribution in dyslexia.
Table 2 and Figure 2 showing the unconjugated bilurubin levels in cases and controls in the first 3 weeks of neonatal period. This shows that there is significant association of dyslexia with increased unconjugated biluribin levels.
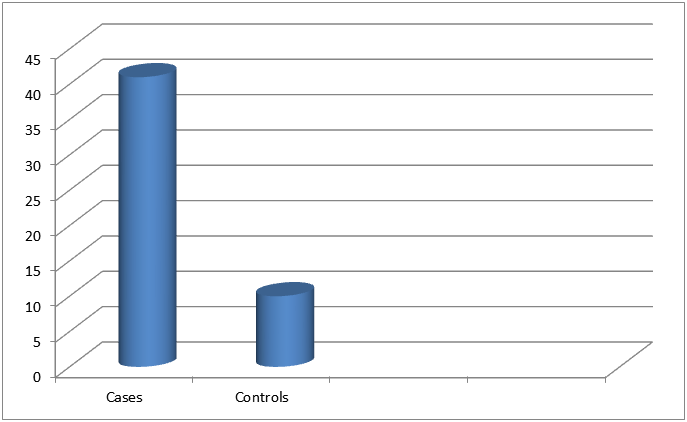
Figure 2: Showing increased unconjugated bilurubin levels (upto 3 weeks of birth) in cases and controls.
| |
Cases (103) |
Controls (100) |
Z Test (p-value) |
| Unconjugatedbilurubin levels (10-15 mg/dl) |
29 (29%) |
6 (6%) |
4.28 (<0.0001) |
Table 2: Showing increased unconjugated bilurubin levels (upto 3 weeks of birth) in cases and controls.
Table 3 and Figure 3 showing the history of allergy level in cases and controls in the first 3 years of birth. This shows that there is significant association of dyslexia with history of allergy.
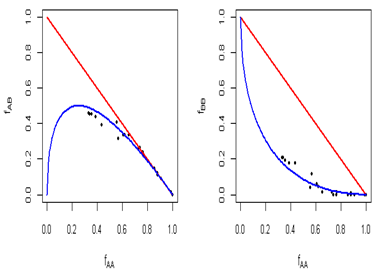
Figure 3: Showing history of allergy in cases and controls (<3 years of birth).
| |
Cases (100) |
Controls (100) |
Z Test (p-value) |
| History of allergy (<3 Years of Age) |
41 (41%) |
10 (10%) |
5. 02 (<0.0001) |
Table 3: Showing history of allergy in cases and controls (<3 years of birth).
Hardy-Weinberg Equilibrium
The above graphs are scattered plots which help to explore the relationship between genotype frequencies, such as fAB versus fAA or fBB versus fAA. In these scattered plots, genetic markers tend to follow a particular curve described by the Hardy-Weinberg law (blue curve). If there are any markers that do not fall in HW equilibrium, they are shown by red points. Both the plots generated from the sample dataset indicate that SNPs fall closely around HWE curve (Figure 4).
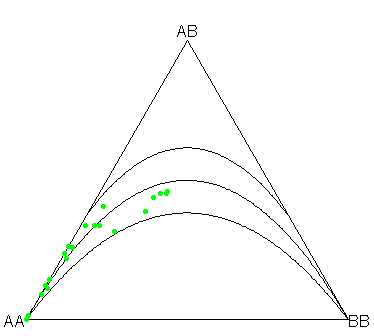
Figure 4: Scattered plots which help to explore the relationship between genotype frequencies, such as fAB versus fAA or fBB versus fAA.
The above plot is the ternary plot it is an information-rich graphical display, which helps to recover genotype frequencies, allele frequencies, and infer the equilibrium status of a genetic marker at a glance. The HWE condition and acceptance region for chi-square test are shown as parabolas in the plot. Markers deviating from HWE are shown with red points. In the ternary plot generated from the sample dataset, all the SNPs fall closely around HWE parabola within the acceptance region i.e., p-value of 0.001 (Figure 5).
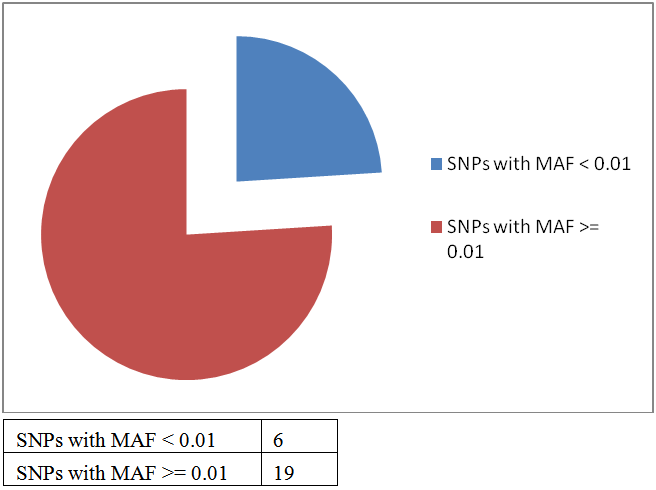
Figure 5: The ternary plot it is an information-rich graphical display.
Allele frequencies
Table 4 indicates the frequency of minor allele calculated from the samples considered in the study.
| SNP |
Genes |
A1 |
A2 |
MAF |
NCHROBS |
Chromosome |
chromo position |
aa_change |
| rs2143340 |
KIAA0319 |
C |
T |
0.2122 |
410 |
|
|
|
| rs2744550 |
KIAA0319 |
0 |
T |
0 |
410 |
chr6 |
24576631 |
558 |
| rs2744559 |
KIAA0319 |
0 |
C |
0 |
410 |
chr6 |
24576631 |
522 |
| rs28501680 |
KIAA0319 |
0 |
G |
0 |
410 |
|
|
|
| rs3212236 |
KIAA0319 |
G |
A |
0.4366 |
410 |
chr6 |
24648455 |
|
| rs3756821 |
KIAA0319 |
A |
G |
0.2756 |
410 |
chr6 |
24646821 |
|
| rs4576240 |
KIAA0319 |
T |
G |
0.04634 |
410 |
chr6 |
24596472 |
133 |
| rs807535 |
KIAA0319 |
C |
T |
0.07317 |
410 |
chr6 |
24551729 |
982 |
| rs807541 |
KIAA0319 |
C |
T |
0.2415 |
410 |
chr6 |
24559281 |
889 |
| rs9461045 |
KIAA0319 |
T |
C |
0.439 |
410 |
chr6 |
24649061 |
|
| rs9467247 |
KIAA0319 |
A |
C |
0.4171 |
410 |
Chr6 |
26467219 |
|
A1: Minor Allele; A2: Major Allele; MAF: Minor Allele Frequency; NCHROBS: Non-missing allele count b
Table 4: The frequency of minor allele calculated from the samples considered in the study.
Zero MAF value indicates the presence of only one allele in the entire set of samples. SNPs with MAF <0.01 can be deleted from further analysis (highlighted in red).
Filters considered
• Filter out SNPs with Minor Allele Frequency (MAF) <0.01 (rs10946705, rs16976354, rs2744550, rs2744559, rs28501680 and rs34647318 got filtered out.
• Filter out SNPs that are not in Hardy Weinberg Equilibrium (p-value threshold: 0.001) (No such SNPs) (Figure 6).
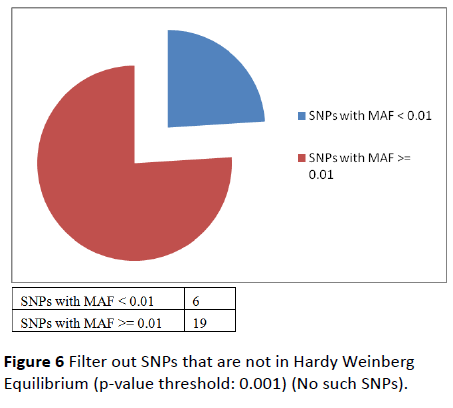
Figure 6: Filter out SNPs that are not in Hardy Weinberg Equilibrium (p-value threshold: 0.001) (No such SNPs).
Allelic association
Table 5 shows allelic association between cases and controls. OR are calculated for minor alleles with reference to the major alleles. SNP’s which Odd’s Ratio>1.2. SNP’s with FD adjusted p-value for chi-square <0.1 is marked. There are 4 SNP’s which are significant.
| Genes |
SNP |
A1 |
F_A |
F_U |
A2 |
OR |
L95 |
U95 |
CHISQ |
P |
FDR_BH |
|
| KIAA0319 |
rs3212236 |
G |
0.4429 |
0.43 |
A |
1. 054 |
0.713 |
1.557 |
0.0688 |
0.793 |
0.9066 |
|
| KIAA0319 |
rs3756821 |
A |
0.3429 |
0.205 |
G |
2. 023 |
1.295 |
3.161 |
9.751 |
0.0018 |
0.03353 |
* |
| KIAA0319 |
rs4576240 |
T |
0.0714 |
0.02 |
G |
3.769 |
1.229 |
11.56 |
6.131 |
0.0133 |
0.0631 |
* |
| KIAA0319 |
rs6935076 |
T |
0.2857 |
0.165 |
C |
2. 024 |
1.254 |
3.267 |
8.512 |
0.0035 |
0.03353 |
* |
| KIAA0319 |
rs807534 |
C |
0.0714 |
0.06 |
T |
1.205 |
0.5496 |
2.642 |
0.2175 |
0.641 |
0.9066 |
|
| KIAA0319 |
rs807535 |
C |
0.0714 |
0.075 |
T |
0.9487 |
0.4511 |
1.995 |
0.0193 |
0.8896 |
0.9066 |
|
| KIAA0319 |
rs807541 |
C |
0.2143 |
0.27 |
T |
0.7374 |
0.4683 |
1.161 |
1.736 |
0.1876 |
0.4456 |
|
| KIAA0319 |
rs9461045 |
T |
0.4429 |
0.435 |
C |
1. 032 |
0.6988 |
1.525 |
0.0257 |
0.8727 |
0.9066 |
|
A1: Minor allele name (based on whole sample); F_A: Frequency of minor allele in cases; F_U: Frequency of minor allele in controls; A2: Major allele name; OR: Estimated odds ratio (for A1, i.e., A2 is reference)
Table 5: Allelic association between cases and controls.
Genotypic distribution
Table 6 shows the genotypic distribution between affected and controls. The genotypes are compared and p-value significant for rs3786821.
| SNP |
A1 |
A2 |
Test |
Cases |
Controls |
Chi-square score |
p-value |
FDR_BH |
|
| rs3756821 |
A |
G |
GENO |
18/36/51 |
6/29/65 |
8.327 |
0.01556 |
0.09336 |
* |
| rs4576240 |
T |
G |
GENO |
0/15/90 |
0/4/96 |
NA |
NA |
NA |
|
| rs6935076 |
T |
C |
GENO |
12/36/57 |
0/33/67 |
NA |
NA |
NA |
|
| rs807534 |
C |
T |
GENO |
0/15/90 |
2/8/90 |
NA |
NA |
NA |
|
| rs807535 |
C |
T |
GENO |
0/15/90 |
0/15/85 |
NA |
NA |
NA |
|
| rs807541 |
C |
T |
GENO |
3/39/63 |
5/44/51 |
NA |
NA |
NA |
|
| rs9461045 |
T |
C |
GENO |
24/45/36 |
19/49/32 |
0.8655 |
0.6487 |
0.7602 |
|
| rs3212236 |
G |
A |
GENO |
24/45/36 |
19/48/33 |
0.6871 |
0.7093 |
0.7602 |
|
| rs9467247 |
A |
C |
GENO |
21/45/39 |
18/48/34 |
0.5484 |
0.7602 |
0.7602 |
|
Table 6: The genotypic distribution between affected and controls.
SNPs with FDR_BH less than 0.1 can be considered as significantly associated with the disease (denoted with *).
For example the SNP's rs3756821, the distribution of genotypes in cases and controls is given below.
The conclusion from the Table 6 for the SNP's rs3756821, is that there is significant genotypic association between Dyslexia cases and controls (Table 7).
| |
Cases |
Controls |
| AA |
18 |
6 |
| AG |
36 |
29 |
| GG |
51 |
65 |
Table 7: Significant genotypic association between dyslexia cases and controls.
Discussion
The present study showed a male preponderance for dyslexia with significant p-value in 100 dyslexic individuals from the state of Telangana. This is the first study with statistical evidence to show the male preponderance in the state of Telangana.
The Table 1 shows that association of allergy and eczema in the first 3 years of life with dyslexia (p-value < 0.0001). This study also correlates with the only Indian study done on 50 dyslexic patients by Pushpa savior 2009, which showed that Allergy, migraine, delayed milestones, low level of blood cholesterol and certain fatty acid deficiency signs were found to be associated with dyslexia. Since complex array of symptoms are associated with dyslexia an integrated research approach is needed for effective diagnosis and remediation of dyslexia.
The present study was done on 100 dyslexic individuals in the state of Telangana and statistical association was found between history of allergy and dyslexia.
Table 2, shows an association of dyslexic cases with increased unconjugated bilirubin (first 3 weeks of birth in the range of 10 to 15 mg/dl) was found to be significant with pvalue of <0.001. The present study is the only study which shows the positive association of increased unconjugated bilirubin levels with dyslexia worldwide., shows an association of dyslexic cases with increased unconjugated bilirubin (first 3 weeks of birth in the range of 10 to 15 mg/dl) was found to be significant with pvalue of <0.001. The present study is the only study which shows the positive association of increased unconjugated bilirubin levels with dyslexia worldwide.
The present study is the first study on the genetic markers (SNPs) associated with dyslexia in the state of Telangana and the second study in India.
Table 5, shows 13 SNPs from KIAA0319 gene (rs2744559, rs28501680, rs28501680, rs2744550, rs6935076, rs807534, rs9467247, rs10946705, rs807541, rs3212236, rs4576240, rs9461045, rs807535 were analyzed. Significant association was found with SNPs rs3756821, rs6935076, rs4576240 of KIAA gene and dyslexia.
Shyamala K and Venkatesh in 2011 analyzed 20 coding SNPs located within the three candidate genes KIAA0319, DCDC2, DYX1C1 and found no association. This study was done on only 50 dyslexics who are not statistically significant and the study does not fall in the Hardy Weinberg equilibrium. Whereas the present study has 100 dyslexic individuals and 100 controls which is statistically significant. The present study falls in the Hardy Weinberg equilibrium.
The present study is the first study on the genetic markers (SNPs) associated with dyslexia in the state of Telangana and the second study in India. The importance of this study is that 100 dyslexic children and 100 controls are taken which has given a statistical significant result unlike the first study from Mysore which had only 50 dyslexic children and hardy Weinberg equilibrium is not mentioned.
Since dyslexia is a major educational problem, there is a need for detailed genetic analysis to find out the genes in the ethnic population which are responsible for dyslexia. This will in turn provide simple diagnostic tools to ease the clinicians for early diagnosis of the disorder and treatment. An attempt is made to verify whether allelic variants of candidate genes are responsible for dyslexia in 100 dyslexic children of Indian population.
Analysis of SNPs is essential for finding genes that predispose people to more common conditions in which inheritance patterns are complex. This will have a wide range of applications for developing diagnostic, therapeutic, and preventative strategies.
Because SNPs are inherited and do not change much from generation to generation, analysis of SNPs is essential for finding genes that predispose people to more common conditions in which inheritance patterns are complex. This will have a wide range of applications for developing diagnostic, therapeutic, and preventive strategies.
9822
References
- Gayan J, Smith SD, Cherny SS (1999) Quantitative-trait locus for specific language and reading deficits on chromosome 6p. Am J Hum Genet 64: 157-164.
- Meng H, Smith SD, Hager K, Held M, Liu J, et al. (2005) DCDC2 is associated with reading disability and modulates neuronal development in the brain. Proc Natl Acad Sci USA 102: 17053-17058.
- Tonnessen FE (1990) Testosterone and dyslexia. Pediatr. Rehabil 45: 417-426.
- Nicolson RI, Fawcett AJ, Dean P (1995) Time estimation deficits in developmental dyslexia: evidence of cerebellar involvement. Proceedings of the Royal Society of London B: Biological Sciences 259: 43-47.
- DeFries JC, Fulker DW, LaBuda MC (1987) Evidence for a genetic etiology in reading disability of twins. Nature 329: 537-539.
- Saviour P, Kumar S, Kiran U, Ravuri RR, Rao VR, et al. (2008) Allelic variants of DYX1C1 are not associated with dyslexia in India. Indian J Hum Genet 14: 99-102.
- Nopola HJ, Myllyluoma B, Haltia T, Taipale M, Ollikainen V, et al. (2001) A dominant gene for developmental dyslexia on chromosome 3. Journal of Medical Genetics 38:658-64.
- Burbridge TJ, Wang Y, Volz AJ, Peschansky VJ, Lisann L (2008) Postnatal analysis of the effect of embryonic knockdown and overexpression of candidate dyslexia susceptibility gene homolog DCDC2 in the rat. Neuroscience 3: 723-733.
- Hannula JK, Kaminen AN, Taipale M, Eklund R, Nopola HJ, et al. (2005) The axon guidance receptor gene ROBO1 is a candidate gene for developmental dyslexia. PLoS Genet 1: e50.
- Meng H, Hager K, Held M, Page GP, Olson RK, et al. (2005) TDT-association analysis of EKN1 and dyslexia in a Colorado twin cohort. Human Genetics 118: 87-90.
- Francks C, Paracchini S, Smith SD, Richardson AJ, Scerri TS (2004) A 77-kilobase region of chromosome 6p22.2 is associated with dyslexia in families from the United Kingdom and from the United States. Am J Hum Genet 75: 1046-1058.
- Cardon LR, Smith SD, Fulker DW, Kimberling WJ, Pennington BF, et al. (1995). Quantitative trait locus for reading disability: correction. Science.
- Cecilia M, Haiying M, Sara M, Marianna R, Natalie C, et al. (2012) DCDC2 Genetic variants and susceptibility to developmental dyslexia. Psychiatr Genet 22: 25-30.
- De Kovel CG, Franke B, Hol FA, Lebrec JJ, Maassen B, et al. (2008) Confirmation of dyslexia susceptibility loci on chromosomes 1p and 2p, but not 6p in a Dutch sib-pair collection. American Journal of Medical Genetics Part-B: Neuropsychiatric Genetics 147: 294-300.
- Galaburda AM, Sherman GF, Rosen GD, Aboitiz F, Geschwind N (1985) Developmental dyslexia: Four consecutive patients with cortical anomalies. Ann. Neurol 18: 222-233.
- Cope N, Harold D, Hill G, Moskvina V, Stevenson J, et al. (2005) Strong evidence that KIAA0319 on chromosome 6p is a susceptibility gene for developmental dyslexia. The American Journal of Human Genetics 76: 581-591.
- Harold D, Paracchini S, Scerri T, Dennis M, Cope N (2006) Further evidence that the KIAA0319 gene confers susceptibility to developmental dyslexia. Mol Psychiatry 11: 1061.
- Meng H, Smith SD, Hager K, Held M, Liu J, et al. (2005) DCDC2 is associated with reading disability and modulates neuronal development in the brain. Proceedings of the National Academy of Science USA 102: 17053-17058.
- Meng H, Powers NR, Tang L, Cope NA, Zhang PX, et al. (2011) Dyslexia-associated variant in DCDC2 changes gene expression. Behav Genet 41: 58-66.
- Dennis MY, Paracchini S, Scerri TS, Prokunina OL, Knight JC, et al. (2009) A common variant associated with dyslexia reduces expression of the KIAA0319 Gene. PLoS Genet 5: e1000436.
- Grether J, Croen L, Theis C, Blaxill M, Haley B, et al. (2011) Genetic variation in the KIAA0319 5’region as a possible contributor to dyslexia. Behav Genet 41: 77-89.
- Centanni TM, Engineer CT, Kilgard MP (2013) Cortical speech-evoked response patterns in multiple auditory fields are correlated with behavioral discrimination ability. J Neurophysiol 10: 177-189.