Keywords
Resistance; Vancomycin; Staphylococci; Coagulase; Hydrophobicity; Biofilm; Autolysis
Introduction
Staphylococci have been recognized as an important cause of wide range of infections [1]. Moreover, they are resistant to multiple antimicrobial agents including vancomycin which is considered as the last treatment option for staphylococci [2]. Many researches were conducted to understand characters of vancomycin resistant Staphylococcus aureus (VRSA). Morphologically, colonies of VRSA isolates often look smaller than their susceptible counterparts, which can lead to be confused with coagulase negative staphylococci (CoNS) [3]. Furthermore, VRSA isolates may require more incubation time for coagulase detection. If the coagulase reactions are incubated for less than 4 hrs, the result may be falsely negative and the isolate may be misclassified as CoNS [4]. A common characteristic among VRSA isolates is a thickened cell wall, although the explanation for this phenomenon is unknown. One hypothesized mechanism is a decrease in autolytic activity [5]. Also, hydrophobicity in VRSA may be different from the vancomycin sensitive isolates. Hydrophobic interactions play a role in the adherence of microorganisms to a wide variety of surfaces [6] and facilitate biofilm formation due to bacterial adhesion [7]. Therefore, increased cell surface hydrophobicity is considered as a factor in the ability of staphylococci to form biofilms [8]. It is well established that bacteria embedded in biofilm are much more resistant to antimicrobial treatment when compared to their planktonic counterparts [9]. A biofilm is a community of bacterial cells that is enclosed in a self-produced polymeric matrix and adheres to inert or living surfaces [10]. So it was interesting to study biological characters of VRSA isolates and to find the relation between such characters and vancomycin MICs.
Materials and Methods
Collection of samples and identification of bacteria
Blood, urine, nasal swaps, pus and sputum samples were collected according to [11]. Then they were cultured on mannitol salt agar and blood agar to isolate Staphylococcus aureus which were then confirmed by standard biochemical tests like coagulase, DNase and catalase tests.
Detection of vancomycin resistance among isolates
This was performed according to [12] guidelines. S. aureus isolates with vancomycin MIC ≥ 32 μg/ml was considered vancomycin resistant.
Determination of autolytic activity
The test was carried out according to the procedures described by [13]. Briefly, cells were grown to an OD600 of 0.7 in TSB broth at 37°C, and were centrifuged at 3700 rpm for 5 min. The pellet was washed once with saline, and resuspended in 0.01 M phosphate buffer (pH 7.0) to about 0.8 at OD600.The cell suspension was incubated at 37°C with continuous shaking. Autolytic activity was measured as the decrease in OD600 values that was monitored every 1 hr with spectrophotometer (SCHIMADZU, Japan).
Determination of coagulase activity
Coagulase activity of VRSA isolates was determined using dye diffusion test as described by [14]. Two drops of S. aureus bacterial suspension were added to an eppendroff containing 4 drops of citrated plasma solution, then the mixture was incubated at 37°C for 2 hrs to allow coagulation to occur. A drop of crystal violet solution was added to the mixture and allowed to diffuse for 1.5 hrs. The assumption of this test is that the rate of diffusion of the dye is inversely proportional to the amount of coagulation.

Determination of cell surface hydrophobicity
Cell surface hydrophobicity of VRSA isolates was determined using the method described by [15]. A single colony of staphylococci isolate was inoculated into MHB for 16-18 hrs with shaking at 37°C. Bacterial cultures (10 ml) were centrifuged at 13.000 rpm for 15 min. Pelleted bacterial cells were washed twice with saline followed by centrifugation at 13.000 rpm for 15 min. Pelleted bacterial cells were resuspended in saline and 2 ml of bacterial suspension was transferred to a prewarmed MHB, then incubated for 1 hr at 37°C and centrifuged again. Pelleted bacterial cells were resuspended in PUM (Phosphate urea magnesium sulphate) buffer (pH 6.9). To 4.8 ml of cell suspension in PUM buffer, different volumes (0.3, 0.9, 1.2, 1.8 ml) of n-hexane were added and mixed well for 2 min. After complete phase separation, aqueous phase was separated carefully and the absorbance of the tested isolates as well as the sensitive control strain remaining in the aqueous phase was measured at 540 nm. The hydrophobicity index (HI) was then calculated as follow:
HI = (A540 control – A540 test) /A540 control
Detection of biofilm production
Biofilm formation was evaluated by the microtitration plate method using crystal violet for semi-quantitative measurement of biofilm production as described by [16]. After adjusting the OD600 of overnight bacterial suspensions at 1, they were diluted 1 100 in sterile BHI, and 100 μL of bacterial suspension were seeded in 96-well flat bottom plates. Three wells were used for each isolate. Negative control wells contained BHI alone.
After 24 and 48 hrs of growth at 37°C, the contents of each well were removed gently, and the wells were washed three times with water to suppress the free-floating cells. Biofilms formed by adherent bacteria were fixed using 100 μL of methanol solution per well for 20 min and air dried for 1 hr. Fixed bacteria were stained with 100 μL of crystal violet solution per well for 10 min, and the excess stain was rinsed off by washing 5 times with water before air-drying. Dye bound to the biofilm was resolubilized with 100 μl of acetic acid solution per well. The OD490 was measured in each well with ELIZA AutoReader (Sunrise Tecan, Austria).
Results
Bacteria
A total of 982 clinical samples including urine (98), blood (166), nasal swabs (168), sputum (181) and wound pus (369) were obtained from departments of Tanta university hospital from October 2011 to August 2012. Out of 437 staphylococci isolates, 88 were VRSA distributed as shown in Figure 1.
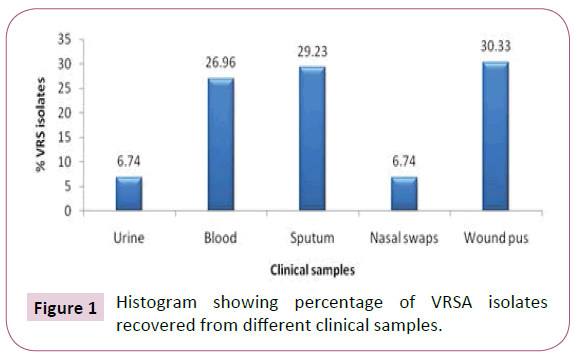
Figure 1: Histogram showing percentage of VRSA isolates recovered from different clinical samples.
Determination of autolytic activity
Autolytic activity was measured in selected VRSA isolates with different vancomycin MICs during incubation at 37°C as the decrease in OD600 values. As shown in Figure 2, autolytic activity was relatively higher in sensitive control strain in comparison with the tested VRSA isolates that showed a slight decrease in autolytic activity by the increase in vancomycin MICs.
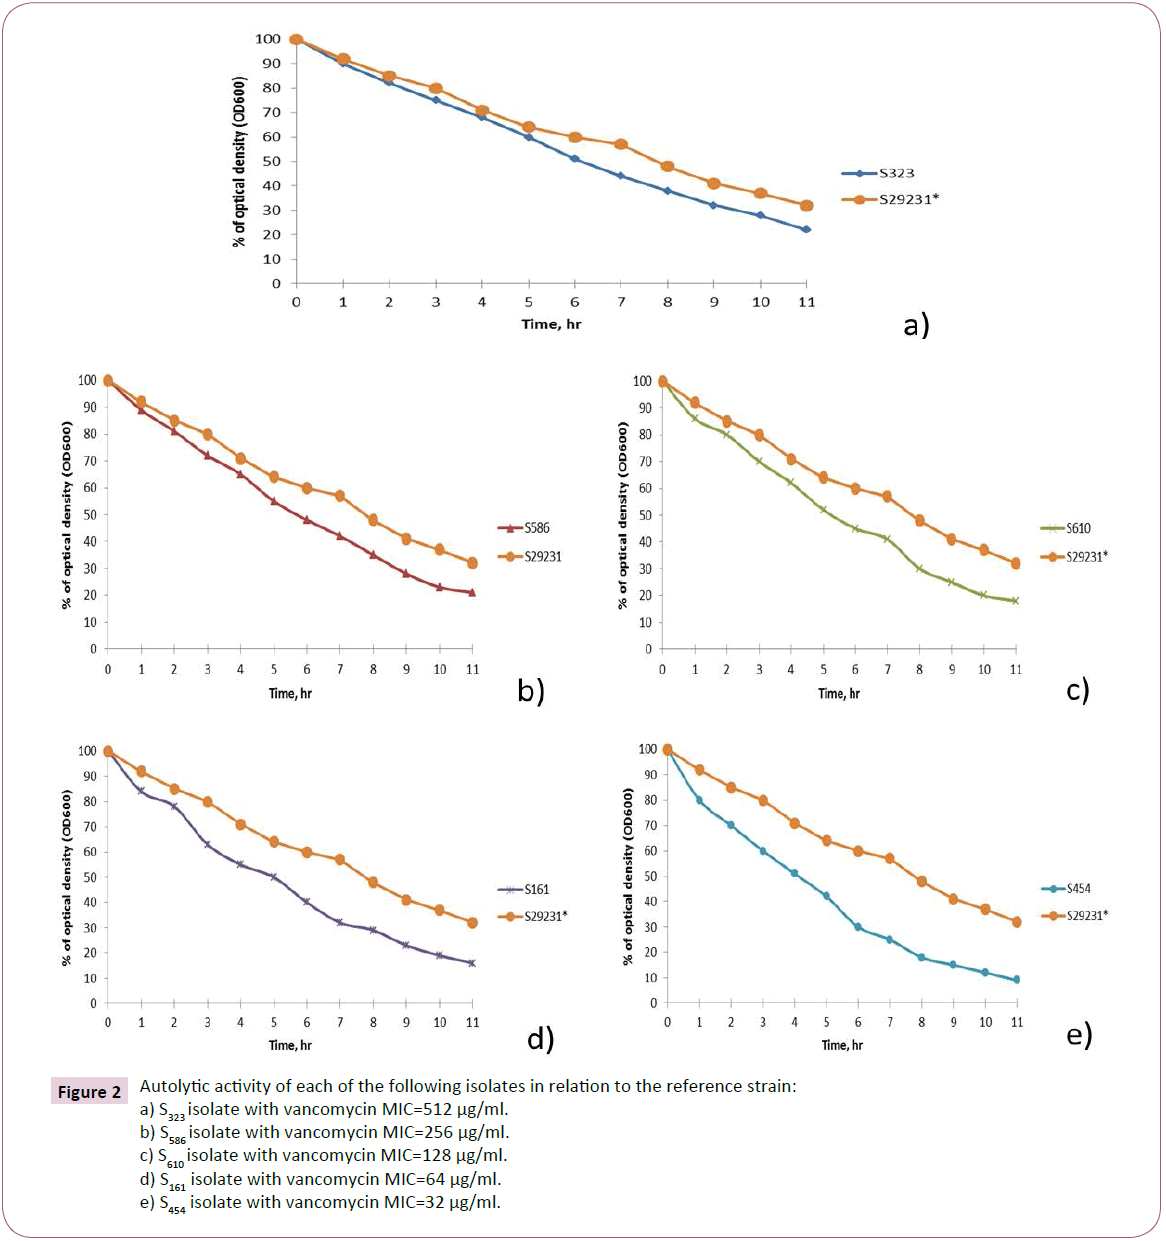
Figure 2:Autolytic activity of each of the following isolates in relation to the reference strain:
a) S323 isolate with vancomycin MIC=512 μg/ml.
b) S586 isolate with vancomycin MIC=256 μg/ml.
c) S610 isolate with vancomycin MIC=128 μg/ml.
d) S161 isolate with vancomycin MIC=64 μg/ml.
e) S454 isolate with vancomycin MIC=32 μg/ml.
Determination of coagulase activity
Coagulase assay was performed on the selected VRSA isolates. The rate of diffusion was found to be inversely proportional to the extent of coagulation of plasma due to presence of free coagulase enzyme; the more the coagulation, the less the dye diffusion. The total length of the mixture of bacteria and plasma in the eppendorf tube was measured using a ruler and it was found to be 18 mm. It was found that the amount of coagulase enzyme secreted by bacteria was markedly reduced as the vancomycin MICs of staphylococci isolates increased which in turn resulted in an increased diffusion of crystal violet in the mixture as shown in Table 1.
| Isolate code |
Vancomycin MICs (µg/ml) |
Length of crystal violet diffusion (%)* |
| S323 |
512 |
12 mm (66.7%) |
| S586 |
256 |
9 mm (50%) |
| S610 |
128 |
8 mm (44.4%) |
| S161 |
64 |
6 mm (33.3%) |
| S454 |
32 |
4 mm (22.2%) |
| S 29231** |
0.5 |
1 mm (5.6%) |
*The percentage calculated relative to total length of the mixture of bacteria and plasma in the eppendorf tube (18mm).
**The sensitive control strain (S.aureus ATCC 29231).
Table 1: Percentages of diffusion of crystal violet in relation to vanomycin MICs of VRSA isolates.
Determination of cell surface hydrophobicity
Cell surface hydrophobicity of the selected VRSA isolates was determined. The absorbance at 540 nm of the aqueous phase was measured after partitioning of the bacterial cells between aqueous and organic phases. Cell surface hydrophobicity index (HI) of the tested isolates was calculated, as shown in Figure 3 HI is directly proportional to the MICs of VRS isolates.
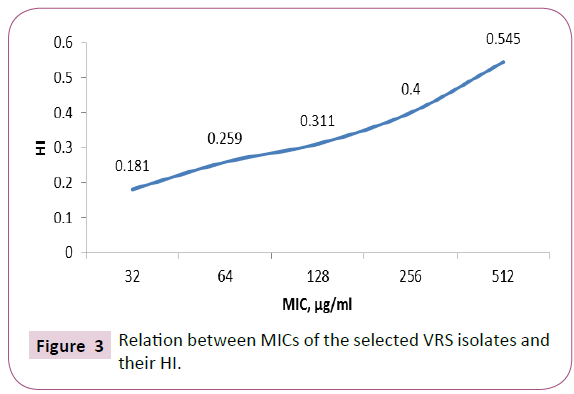
Figure 3: Relation between MICs of the selected VRS isolates and their HI.
Detection of biofilm production by selected VRS isolates
The selected VRSA isolates with different vancomycin MICs were screened for their ability to adhere to the wells of microtitration plates and hence biofilm production as shown in Figure 4. Biofilm OD values were measured using at wavelength of 570 nm. As shown in Table 2, vancomycin MICs of the tested isolates were directly proportional to their biofilm production.
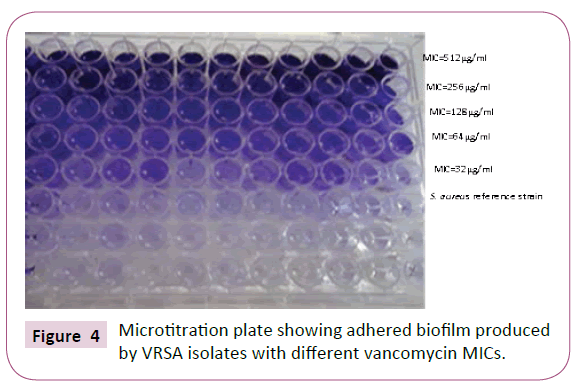
Figure 4: Microtitration plate showing adhered biofilm produced by VRSA isolates with different vancomycin MICs.
| Isolate code |
Vancomycin MICs (µg/ml) |
Length of crystal violet diffusion (%)* |
| S323 |
512 |
12 mm (66.7%) |
| S586 |
256 |
9 mm (50%) |
| S610 |
128 |
8 mm (44.4%) |
| S161 |
64 |
6 mm (33.3%) |
| S454 |
32 |
4 mm (22.2%) |
| S 29231** |
0.5 |
1 mm (5.6%) |
*The percentage calculated relative to total length of the mixture of bacteria and plasma in the eppendorf tube (18mm).
**The sensitive control strain (S.aureus ATCC 29231).
Table 2: Relation between vancomycin MICs and the average biofilm OD values of the tested isolates.
Discussion
In this study, 88 (20%) VRSA isolates were detected. This finding was comparable to the percentage reported by Ghoniem et al. in Egypt which was 20.68%. The highest percentage of VRSA isolates was from wound pus (30.33%) while the least percentage was from nasal swabs and urine (6.74%). This finding was consistent with that reported by Thati et al. and Olayinka et al. who reported that 28.5% and 29% of VRSA isolates, respectively, were detected in wound pus. On the other hand, Abo-Shady et al. reported that 60% of VRSA isolates were recovered from wound pus and no VRSA isolates detected in nasal swab and sputum.
There are some biological changes which are prerequisite for expression of vancomycin resistance in staphylococci such as decreased autolytic activity, decreased coagulase activity, increased cell surface hydrophobicity and increased biofilm formation [13].
In the late 1990s, Sieradzki et al. suggested that alterations in cell wall structure inhibit vancomycin access to its active site in VRSA isolates. These alterations include overproduction and accumulation (in part through reduced autolytic activity) of cell wall material, activated cell wall synthesis leading to cell wall thickening and reduced vancomycin access to its active site [21]. Sieradzki et al. have demonstrated that vancomycin resistance is related to a decrease in autolytic activity in staphylococci isolates. In the current study, autolytic activity of selected VRSA isolates was assessed. Interestingly, it was found that autolytic activity in VRSA isolates relatively decreased in comparison to S. aureus reference strain. Similar results were reported by several authors in this field [5,22-26].
Coagulase enzyme is a major phenotypic determinant of S. aureus and is usually used to identify it. However, it has been reported that coagulase activity decreased in VRSA isolates, occasionally leading to misidenti?cation if coagulase test is incubated for less than 4 hrs [27]. In this study, coagulase activity was assayed by dye diffusion test. It was found that coagulase activity decreased as the vancomycin MICs increased. This finding was in accordance with [4,27] and who reported that coagulase activity decreased in VRSA isolates which has led to misidentification of VRSA as coagulase negative staphylococci. The reason of this phenomenon is still unknown. It might be due to low expression of coagulase enzyme gene or the enzyme activity affected by the thickened bacterial cell wall [27].
The molecular nature of the bacterial cell surface is critical in the interaction between the microorganism and the host. The hydrophobic or hydrophilic nature of the bacterial cell surface is an important determinant in the adherence of bacteria to living and non-living surfaces [28,29].
In the current study, cell surface hydrophobicity and biofilm formation in selected VRSA isolates were investigated. It was found that MICs of vancomycin were directly proportional to hydrophobicity index and biofilm production. Antune et al. reported that there was no significant correlation between the biofilm production and the hospital unit, previous use of antimicrobials, length of stay in the hospital, associated infections, predisposing conditions, outcome, age or gender. The only correlation they found was that the biofilm-producing isolates showed higher rates of resistance to some antimicrobials used in therapy like vancomycin compared to the non-producing biofilm isolates. Similar results were obtained by [30-32]. This finding can be explained by the slow diffusion of vancomycin into the deeper layers of bacterial biofilms, which may lead to resistance due to the gradual exposure of the bacterial cells to low concentrations of the antimicrobial [10,33]. More research in the future should be conducted to help to determine additional characters of VRSA to further understand all aspects of these organisms to help to develop optimal treatment and to establish suitable control implications.
21961
References
- Srinivasan A, Dick JD, Perl TM (2002) Vancomycin resistance in staphylococci. ClinMicrobiol Rev 15: 430-438.
- Jensen SO, Lyon BR (2009) Genetics of antimicrobial resistance in Staphylococcus aureus. Future Microbiol 4: 565-582.
- Sieradzki K, Wu SW, Tomasz A (1999) Inactivation of the methicillin resistance gene mecA in vancomycin-resistant Staphylococcus aureus. Microbial Drug Resistance 5: 253-257.
- Moreira B, Boyle-Vavra S, deJonge BL, Daum RS (1997) Increased production of penicillin-binding protein 2, increased detection of other penicillin-binding proteins, and decreased coagulase activity associated with glycopeptide resistance in Staphylococcus aureus. Antimicrob Agents Chemother 41:1788-1793.
- Boyle-Vavra S, Challapalli M, DaumRS (2003) Resistance to autolysis in vancomycin-selected Staphylococcus aureusisolates precedes vancomycin-intermediate resistance. Antimicrob Agents Chemother 47: 2036-2039.
- Rosenberg M (1981) Bacrerialadherence to polystyrene. ApplEnvir Micro 42: 375-377.
- Grivet M, Morrier JJ, Benay G, Barsotti O (2000) Effect of hydrophobicity on in vitro streptococcal adhesion to dental alloys. J mater Sci 11: 637-642.
- Stewart PS (2002) Mechanism of antibiotic resistance in bacterial biofilm. Int J med Microbiol 292: 107-113.
- Antunes AS, Bonfanti JW, Perez LR, Pinto CF, de Freitas AA, et al. (2011) High vancomycin resistance among biofilms produced by staphylococcus species isolated from central venous catheters. MemInstOswaldo Cruz 106: 51-55.
- Cheesbrough M (2000) District Laboratory Practice in Tropical countries. Cambridge University press 22: 182-184.
- Clinical and Laboratory Standards Institute (CLSI) (2016) Performance standards for antimicrobial susceptibility testing; twenty seven informational supplement. Wayne, Pennsylvania, USA 12: 121-128.
- Hanaki H, Kuwahara-Arai K, Boyle-Vavra S, Daum RS, LabischinskiH, et al. (1998) Activated cell-wall synthesis is associated with vancomycin resistance in methicillin-resistant Staphylococcus aureus clinical strains Mu3 and Mu50. Antimicrob Agents Chemother 42:199-209.
- Fung DY, Kraft AA (1986) Dye diffusion test for semiquantitativestaphylocoagulase assay. J applied microbial 16:1608-1609.
- Rosenberg M, Gleiser CA, Carey KD (1984) Spinal coccidioidomycosis in a baboon. J Am Vet Med Assoc 185: 1379-1381.
- Stepanovic S, Vukovic D, Hola V, Di Bonaventura G, Djukic S, et al. (2007) Quantification of biofilm in microtiter plates: overview of testing conditions and practical recommendations for assessment of biofilm production by staphylococci. Apmis 115: 891-899.
- Ghoniem EM, El Hendawy GR, Abdel Moteleb TM, Hassan HA, Khali HAE (2014) Characterization of vancomycin-resistant Staphylococcus aureus in the National Liver Institute. Menoufia Medical Journal 27:825-832.
- Thati V, Shivannavar CT, GaddadSM (2011) Vancomycin resistance among methicillin resistant Staphylococcus aureus isolates from intensive care units of tertiary care hospitals in Hyderabad. Indian J Med Res 134: 704-708.
- Olayinka BO, Olayinka AT, Onaolapo JA, Olurinola PF (2005) Pattern of resistance to vancomycin and other antimicrobial agents in staphylococcal isolates in a university teaching hospital. AJCEM 6:21-27.
- Abo-Shady HM, El-Essawy AK, Salama MS, El-Ayesh AM (2012) Detection and molecular characterization of vancomycin resistant Staphylococcus aureusfrom clinical isolates. African Journal of Biotechnology 11: 16494-16503.
- Howden BP, Davies JK, Stinear TP, Johnson PDR, Grayson ML (2010) Reduced vancomycin susceptibility in Staphylococcus aureus, including vancomycin-intermediate and heterogeneous vancomycin-intermediate strains: resistance mechanisms, laboratory detection, and clinical implications. ClinMicrobiolRev 23:99-139.
- Boyle-Vavra S, Labischinski H, Ebert CC, Ehlert K, Daum RS (2001) A spectrum of changes occurs in peptidoglycan composition of glycopeptide-intermediate clinical Staphylococcus aureus isolates. Antimicrob Agents Chemother 45: 280-287.
- Pereira PM, Filipe SR, Tomasz A, Pinho MG (2007) Fluorescence ratio imaging microscopy shows decreased access of vancomycin to cell wall synthetic sites in vancomycin-resistant Staphylococcus aureus. Antimicrob Agents Chemother 51: 3627-3633.
- Renzoni A, Francois P, Li D, Kelley WL, Lew DP, et al. (2004) Modulation of fibronectinadhesins and other virulence factors in a teicoplanin-resistant derivative of methicillin-resistant Staphylococcus aureus.Antimicrob Agents Chemother 48: 2958-2965.
- Renzoni AC, Barras P, Francois Y, Charbonnier E, Huggler C et al. (2006) Transcriptomic and functional analysis of an autolysis deficient, teicoplanin-resistant derivative of methicillin-resistant Staphylococcus aureus. Antimicrob Agents Chemother 50: 3048-3061.
- Vaudaux P, Francois P, Berger-Bachi B, Lew DP (2001) In vivo emergence of subpopulations expressing teicoplanin or vancomycin resistance phenotypes in a glycopeptide-susceptible, methicillin-resistant strain of Staphylococcus aureus. Antimicrob Agents Chemother 47: 163-170.
- Dai YY, Ma XL and Zhou X (2012) Be alert to the alterations in the biological characteristics in heterogeneous vancomycin-intermediate Staphylococcus aureus. Indian Journal of Medical Microbiology 30:215-217.
- Rosenberg M, Gutnick D, Rosenberg E (1980) Adherence of bacteria to hydrocarbons: a simple method for measuring cell-surface hydrophobicity. FEMS MicrobiolLett 9: 29-33.
- Rosenberg M (1984) Bacterial adherence to hydrocarbons: a useful technique for studying cell surface hydrophobicity. FEMS MicrobiolLett 22: 289-295.
- Saify H, Patidar RK, Khare M, Sahare KN, Singh V (2013) Difference in biofilm development capability of vancomycin and ciprofloxacin resistant Staphylococcus aureusclinical isolates. Res J Infect Dis 8: 1-4.
- Howden BP, Johnson PD, Ward PB, Stinear TB, Davies JK (2006) Isolates with low-level vancomycin resistance associated with persistent methicillin-resistant Staphylococcus aureusbacteremia. Antimicrob Agents Chemother 50: 3039-3047.
- Hsu C, Lin MH, Chen CC, Chien SC, Cheng YH, et al. (2011) Vancomycin promotes the bacterial autolysis, release of extracellular DNA and biofilm formation in vancomycin non-susceptible Staphylococcus aureus. FEMS Immunol Med Microbiol 63: 236-247.
- Rice LB (2006) Antimicrobial resistance in Gram-positive bacteria. Am J Med 119: S11–S19.