Keywords
Transfusion; Blood management strategy; Blood components; Consumption predict model (CPM)
Introduction
Blood transfusion is instrumental in clinic therapy [1], but there is a great contradiction between supply and consumption worldwide [2]. According to analysis by World Health Organization (WHO), approximately 69 million units of blood were collected from 150 countries in 2006.
Among these 69 million blood units, fewer than 30 million units (45%) were collected in developing and transitional countries, which comprised nearly 80% of the world’s populations. The average blood donation rate is 10 times higher in developed countries and 3 times higher in transitional nations than that of developing countries.
There are great variations in blood administration practices between developed and developing countries. Compared with high-income countries with high frequency use of blood products (more than 91%), only 58% of clinical cases in low- and middle-income countries were involved with the administering of blood transfusion. What’s more, because of lagging information technologies, the actual data and analysis information in developing nations, including China, is much limited.
Irrational transfusion administration and unnecessary transfusion practices increased the frequency of blood transfusion reactions, as well as incidence of transmissible pathogens [3].
And also, unnecessary transfusions contribute to wasting of blood resources, which is unfair and inhumane to patients who urgently need transfusion [4]. The average volume of blood transfusion is 23 ml per person in American; it is 18.8 ml per person in Europe, and it is 15.4 ml per person in Canada [5].
In China, however, the volume in 2011 was only 2.8 ml per person, which is a big gap to catch up with the high-income countries. Therefore, collecting the transfusion data and taking measures is one of the urgent way that make great contributions to scientific and reasonable blood transfusion.
Transfusion of blood components is an important way to promote reasonable blood transfusion. With the development of blood transfusion practices, whole blood supply in China has decreased to 1.13%, red blood cell supply is about 48%.
Platelet supply is growing at an annual rate of 10%, creating great pressure for the blood bank in China [6]. With the increase in demand for blood transfusion and the advance of medical technology, effective and safety blood transfusion and administration strategies are urgently demanded. However, the information about the consumption of blood products in hospital is limited, although the blood collection data is available in China at national level.
The current study performed a retrospective study to develop a highly accurate model for prediction of the consumption of blood transfusion. In this approach, we observed the use of blood components amounts over an 11-year period retrospectively, predicted the demand consumption of blood components in 2014 that was developed from the CPM, which was then compared with the actual usage of blood transfusion in 2014.
Finallyour results of prediction, comparing with the actual consumption, reached a comparatively high accuracy and may helpful to develop predictive models to administrating blood resources and reducing waste of blood.
Materials and Methods
Data collection and plot make-up
From 2003, only blood components-not whole blood-could be used in China’s Xijing Hospital. Thus, we retrospectively recorded information about the amount of blood used in Xijing Hospital from 2003 to 2013.
In brief, the red blood cell, Plasma, Platelet, and Cryoprecipitate consumption amounts were collected based on the data of usage, which was collected from the local blood administration software system.
Statistical analysis
In the current study, annual blood consumption of the each blood components was counted as a single data and then analyzed by IBM SPSS Statistics 19 and Graphpad Prism 5 software respectively.
The blood constituent usage amounts were counted by quarters (titled Q1, Q2, Q3 and Q4) in each year to revealing consumption trends and predicting future utilization. For development of the prediction volume, the Time Series Forecasting Method was used.
CPM capability validation
We counted the consumption of blood components (RBC, Plasma, Platelet, Cryoprecipitate ) by quarters in 2014, and then compared with the prediction value(mean value) using T-test. For each test, the difference was considered significant if the pvalue was 0.05.
Result
Blood components consumption show different trends
Red blood cells (RBC) comprised the most-used blood components in transfusion. In order to looking into RBC consumption in recent years, we reviewed the data of the past 11-years in the Xijing hospital. The amount of RBC transfusion is shown in Figure 1A. The use of red blood cells increased approximately three-fold from 2003 to 2011 that the total volumes were 4510800 ml in 2003 and 13906000 ml in 2011.
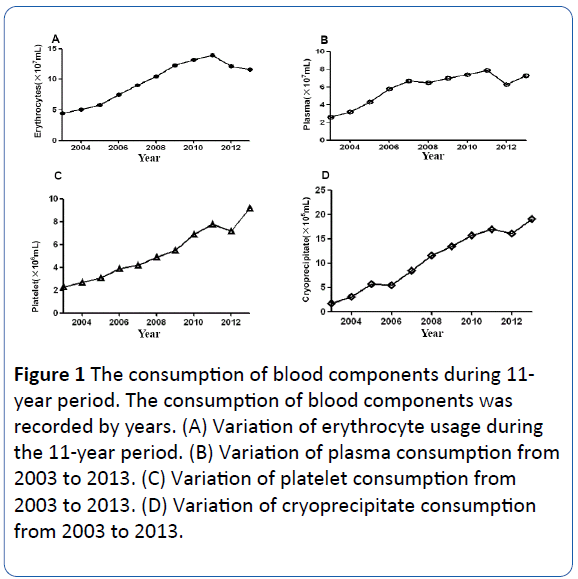
Figure 1: The consumption of blood components during 11- year period. The consumption of blood components was recorded by years. (A) Variation of erythrocyte usage during the 11-year period. (B) Variation of plasma consumption from 2003 to 2013. (C) Variation of platelet consumption from 2003 to 2013. (D) Variation of cryoprecipitate consumption from 2003 to 2013.
However, from 2012, the consumption dropped sharply. When to 2013, it was 10288200 ml, a decrease of 26%, compared with 2011. These data suggested that after a dramatic increase, the RBC expend decreased in the past two years.
Plasma serves many functions, including thrombin function, immunity support, and maintenance of blood pressure and volume, which is very important to clinical treatment. Having observed the amount of RBC usage in the 11-year span, we considered how much Plasma was used locally. As shown in Figure 1B, the usage of plasma expanded from 2003 to 2008 that is, from 2652570 ml to 6967860 ml which was a very significant increase, almost triple to the consumption at the beginning of the period. From 2008, the growth rate maintained a relatively stable level, holding the growth rate of 6% per year. Surprisingly, the consumption decreased from 2012. These data indicated that the first 6 years witnessed a great creasement of plasma usage, while over the next 5 years. Plasma consumption maintained a more relatively stable level.
As major players in blood-clotting, Platelets and Cryoprecipitate were widely used in clinic. Currently in Xijing Hospital, more than 80,000 surgeries were performed per year, so it’s necessary to analyze the volume of platelets and cryoprecipitate consumed. As shown in Figure 1C, the consumption of Platelets continued to increase at a rate of 10% per year over the 11-year period. Compared with the dosage of 233640 ml in 2003, the consumption volume of Platelets reached 917040 ml in 2013. The usage of Cryoprecipitate was even more energetic. From 2003 to 2008, the growth rate of was about 50% per year (Figure 1D). The volume of Cryoprecipitate used was 17140 ml in 2003 and 116060 ml in 2008, respectively. But from 2009, the growth slowed, with the average rate of growth at 11% per year over the past 5 years. On the whole, these results demonstrated that the local consumption of Platelets and Cryoprecipitate hold at a high level of increase during the period studied.
Blood components consumption prediction for the year of 2014
Observing the recently decreased usage of RBC, we considered the consumption trends for the subsequent year. Thus, we grouped the consumption of the past 11 years by seasons, and then predicted the usage for 2014. As shown in Table 1, summer represents the season of the greatest consumer of red blood cells, which is 3086390 ml. In autumn, using 55811 ml is less than the summer usage, and there was no significant difference between spring and winter consumption. The total volume for red blood cells demand in 2014 would be 11806700 ml.
| |
Q1 |
Q2 |
Q3 |
Q4 |
| Mean |
2848279 |
3086390 |
3030579 |
2841473 |
| UCL |
3397448 |
3863033 |
3981769 |
3939812 |
| LCL |
2299109 |
2309747 |
2079390 |
1743134 |
Table 1: The result of RBC prediction model for demand volume in 2014.
After predicting RBC demand for the following year, we thus wanted to calculate future Plasma consumption. As shown in Table 2, the total demand for Plasma in 2014 should be 7259770 ml. Just like the situation of RBC, we found that summer is also the season of greatest Plasma transfusion consumer (the consumption volume is 2104140 ml). However, the predicted plasma consumption volume of spring, autumn, and winter were different from each other that winter is the least consumer which is 1516580 ml.
| |
Q1 |
Q2 |
Q3 |
Q4 |
| Mean |
1760880 |
2104142 |
1878174 |
1516501 |
| UCL |
2184234 |
2597880 |
2433446 |
2127136 |
| LCL |
1337525 |
1610404 |
1322903 |
905866 |
Table 2 The result of plasma prediction model for demand volume in 2014.
Since we observed the great increase in consumption of Platelets and Cryoprecipitate, and the supply condition of these two blood components is not optimistic, it’s significant to predict the local clinical demand. Firstly, we looked further into the usage volume of platelets and cryoprecipitate by quarter seasons. We then predicted the demand for 2014 and found that for platelets, winter of 2014 would be the biggest consumption season at 240960 ml, and the season of lowest usage would be spring, at 228030 ml (Table 3). The same situation occurred in cryoprecipitate consume (Table 4). Consumption of Cryoprecipitate in the winter of 2014 is predicted at 78610 ml. In conclusion, these data suggested that winter would be the largest consumption season for the demand of Platelets in 2014, and for Cryoprecipitate, the situation is also the same.
| |
Q1 |
Q2 |
Q3 |
Q4 |
| Mean |
228033 |
232343 |
236653 |
240963 |
| UCL |
305064 |
309512 |
313960 |
318407 |
| LCL |
151001 |
155173 |
159346 |
163518 |
Table 3 The result of platelet prediction model for demand volume in 2014.
| |
Q1 |
Q2 |
Q3 |
Q4 |
| Mean |
73731 |
75359 |
76988 |
78617 |
| UCL |
96578 |
98317 |
100055 |
101793 |
| LCL |
50883 |
52402 |
53921 |
55441 |
Table 4 The result of cryoprecipitate prediction model for demand volume in 2014.
Comparison of the consumption predict-model capability using the actual consumption case analysis in order to test the accuracy of our consumption predict-model, we statistical the actual amount of blood components consumption in 2014. As shown in Table 5, we divided 2014 into 4 groups (Q1, Q2, Q3, and Q4) by quarter, and operated the comparison between the actual consumption and the predicted volume using T-test. In the T-test analysis, P value ranges were 0.193(RBC MODEL), 0.690(Plasma MODEL), 0.006(PLT MODEL) and 0.898(Cryoprecipitate MODEL). The highest correct classification was observed in the RBC Model. Most of the models demonstrated higher predictive accuracy as compared with the original statistical results. As for PLT MODEL, due to the effect of policy advocacy and the improvement of public awareness of blood donation, the number of platelet appeared relatively large fluctuations.
| |
|
Q1 |
Q2 |
Q3 |
Q4 |
P value |
| RBC |
Consumption |
2787800 |
2941600 |
2644800 |
2897600 |
0.193 |
| Prediction |
2848279 |
3086390 |
3030579 |
2841473 |
|
| Plasma |
Consumption |
1920700 |
2064240 |
1282236 |
2445700 |
0.69 |
| Prediction |
1760880 |
2104142 |
1878174 |
1516581 |
|
| PLT |
Consumption |
302460 |
294440 |
260200 |
263920 |
0.006 |
| Prediction |
228033 |
232343 |
236653 |
240963 |
|
| Cryo |
Consumption |
66000 |
79960 |
75520 |
81280 |
0.898 |
| Prediction |
73731 |
75359 |
76988 |
78617 |
|
Table 5 Comparison of predictive model capability using the actual consumption case analysis.
Discussion
Blood administration policy in China since 1998, from a paid blood donation system to a volunteer donation regime that guaranteed blood safety, protected donors health [7-9], and significantly promoted a shift from a whole blood approach to component therapy [10]. We witnessed the fundamental adjustment in blood donation. However, blood donor selection policy is not formulated according to the actual situation in many countries. Moreover, some governments have adopted their criteria from other, more advanced nations without full consideration of population structure, prevailing epidemiology, local culture, and available resources [11]. At the same time, many countries have taken a highly precautionary approach to choosing blood donors in order to maximize safety [12-14]. The knowledge, attitude, and feelings of a single donor might have a significant impact on encouraging other donors or not which will determine the volume of blood collection [15]. On the other hand, whole blood administration has been advocated and replaced by the components blood practice in clinics in China since the early 21st century. These changes in principle consequently reduced risks associated with transfusion practices [16]. Moreover, blood components administration reduced the economic burden and conserved blood recourse [17].
But data analysis of blood components consumption in a large hospital over a long period has not been available, hindering improvement of the blood supply and administration. The reality changes in blood components consumption remind us that a scientific and reasonable blood administration strategy maybe a helpful option. Thus, in the present study, we investigated the usage of blood components over the 11-year period, and predicted the consumption of blood components in 2014.
The obtained data showed that red blood cell consumption has decreased since 2012, which is reasonable in association with improved blood transfusion practices. Actually, from 2010. The health department of china produced strict policy to monitor RBC transfusion. The guidelines stated that for surgery, only when a patient’s hemoglobin is lower than 100 gL-1 can RBC be administered, while for internal patients, only when the hemoglobin is lower than 60 gL-1 can RBC components be given. What’s more, before and after the RBC consumption, the medical record must be presented to show the reason and efficacy of RBC transfusion. So it’s no wonder we observed a great local reduction in RBC consumption. We also observed that blood components consumption changed in the past years which were significant to our clinical transfusion practices. With the increasing usage of Platelet and Cryoprecipitate, it is helpful to reduce the use of red blood cells because several investigative reports showed that providing ABO-identical Platelets and Cryoprecipitate might be useful to reduce red cell transfusion [18]. Other more, surgery has significantly improved, including and increasing in such practices as providing blood substitutes [19] and autologous blood transfusion [20], which is meaningful to blood consumption and administration.
In CPM, these strategies included: more prospective data collection, standardized blood administration software system, and detailed data analysis. Another useful strategy to improve data quality, especially in studies with limited resources, requires maintaining a more accurate research focus and detailed information collected to only necessary variables.
In summary, in the current investigation, we observed the use of blood components amounts over an 11-year period retrospectively, and predicted the demand consumption of blood components in 2014 that was developed from the CPM. Our results confirmed that the predication model was helpful to the blood transfusion administration. This kind of study gave a new sight into the patient blood management in local hospital.
Acknowledgments
The Authors are grateful to the Department of Transfusion Medicine in Xijing hospital and the Department of Plastic Surgery in Xibei Hospital for supporting this work.
Compliance with Ethical Standards
This was a retrospective study involving only the study done from the records. This article does not contain any studies with human participants or animals performed by any of the authors.
18986
References
- Oldham J, Sinclair L, Hendry C (2009) Right patient, right blood, right care: Safe transfusion practice. Br J Nurs 18: 316-320.
- Lau EH, He XQ, Lee CK, Wu JT (2013) Predicting future blood demand from thalassemia major patients in Hong Kong. PLoS One 8: e81846.
- Shaz BH, Dente CJ, Harris RS, MacLeod JB, Hillyer CD (2009) Transfusion management of trauma patients. Anesth Analg 108: 1760-1768.
- Zoric L, Daurat G, Demattei C, Macheboeuf M, Boisson C, et al. (2013) Blood wastage reduction: A 10-year observational evaluation in a large teaching institution in France. Eur J Anaesthesiol 30: 250-255.
- Williamson LM, Devine DV (2013) Challenges in the management of the blood supply. Lancet 381: 1866-1875.
- Reiss RF (2011) Blood donor well-being: A primary responsibility of blood collection agencies. Annals of Clinical & Laboratory Science. 41: 3-7.
- WHO (2002) Aide-memoire for national blood programmes: Quality systems for blood safety.
- WHO (2009) The melbourne declaration on 100% voluntary non-remunerated donation of blood and blood components.
- Behr-Gross ME, Heiden M, Norda R (2013) Contributions of the Council of Europe’s Blood Transfusion Steering Committee to the determination of rules for the selection of donors of blood and blood components and the study of sexual behaviors having an impact on blood safety. Transfus Clin Biol 20: 127-138.
- WHO (2012) Blood donor selection: Guidelines on assessing donor suitability for blood donation.
- Eder A, Goldman M, Rossmann S, Waxman D, Bianco C (2009) Selection criteria to protect the blood donor in North America and Europe: past (dogma), present (evidence), and future (hemovigilance). Transf Med Rev 23: 205-220.
- Moreno JD (2003) "Creeping precautionism" and the blood supply. Transfusion 43: 840-842.
- Farrugia A (2004) The mantra of blood safety: Time for a new tune? Vox Sang 86: 1-7.
- Uma S, Arun R, Arumugam P (2013) The knowledge, attitude and practice towards blood donation among voluntary blood donors in chennai, India. J Clin Diagn Res 7:1043-1046.
- Hirayama F (2013) Current understanding of allergic transfusion reactions: Incidence, pathogenesis, laboratory tests, prevention and treatment. Br J Haematol 160: 434-444.
- O’Keeffe T, Refaai M, Tchorz K, Forestner J, Sarode R (2008) A massive transfusion protocol to decrease blood component use and costs. Arch Surg 143: 686-690.
- Refaai MA, Fialkow LB, Heal JM, Henrichs KF, Spinelli SL, et al. (2011) An association of ABO non-identical platelet and cryoprecipitate transfusions with altered red cell transfusion needs in surgical patients. Vox Sang 101: 55-60.
- Spahn DR, Goodnough LT (2013) Alternatives to blood transfusion. Lancet 381: 1855-1865.
- Perazzo P, Viganò M, de Girolamo L, Verde F, Vinci A, et al. (2013) Blood management and transfusion strategies in 600 patients undergoing total joint arthroplasty: An analysis of pre-operative autologous blood donation. Blood transf 11: 370-376.