Keywords
Oxaliplatin-based therapy; Metastatic colorectal cancer; Metabolic response; Adenocarcinoma
Introduction
Adenocarcinoma of the colon and rectum is one of the most common human malignancies. It is a major public health issue in developing and underdeveloped countries [1]. In terms of incidence, colorectal cancers rank fourth in frequency in men and third in women worldwide. In 2002, colorectal cancers accounted for about 1 million new cases. Prevalence is second only to that of breast cancer worldwide, with an estimated 2.8 million persons alive with colorectal cancer diagnosed within 5 years of diagnosis. Overall, the prognosis is relatively good with mortality about one half that of incidence (about 529,000 deaths in 2002) [2].
Surveillance, Epidemiology and End Results (SEER) showed that from 2004-2008 the median age at diagnosis for colorectal cancer was 70 years of age. The age-adjusted incidence rate was 47.2 per 100,000 men and women per year.
From 2003-2007, the median age at death for cancer of the colon and rectum was 75 years of age. The age-adjusted death rate was 17.6 per 100,000 men and women per year. The overall 5-year relative survival for 2001-2007 was 64.3%. Based on rates from 2005-2007, 5.12% of men and women will be have lifetime risk of developing colorectal cancer [3].
Compared to the American SEER, the European and Indian tumour registries reported a significantly lower 5-year survival rate of 54% in Western Europe, 34% in Eastern Europe, and 30% in India respectively [2].
Oxaliplatin (trans-l-1, 2-diaminocyclohexane oxaloplatinum) is a cell-cycle phase-non-specific alkylating agent. A novel 3rd generation platinum coordination compound in which a platinum atom is complexed with an oxalate leaving ligand and trans-l-1, 2-diaminocyclohexane (DACH) carrier ligand. After displacement of the oxalate leaving ligand, active oxaliplatin derivatives, such as monoaquo and diaquo DACH platinum, alkylate DNA forming platinum-DNA adducts. In addition, oxaliplatin induces intra-strand DNA crosslinks, DNA-protein crosslinks and, to a lesser extent, inter-strand DNA crosslinks. The resulting DNA adducts and crosslinks inhibit DNA replication and transcription and induce apoptosis. Oxaliplatin is FDA approved to be used with other drugs for treatment of metastatic colorectal cancer. The benefit of FOLFOX4 (biweekly bolus 5-fluorouracil/leucovorin and 5-fluorouracil continuous infusion plus oxaliplatin) was initially established in the pivotal North Central Cancer Treatment Group (NCCTG)/US Intergroup trial N9741, which incorporated different treatment arms comparing FOLFOX4 to IFL (weekly bolus 5-florouracil/ leucovorin plus irinotecan for four of every six weeks) and to a combination of irinotecan plus oxaliplatin without 5- florouracil. All efficacy parameters as well as the toxicity profile favoured the FOLFOX4 regimen with a significant time to progression of 8.7 months versus 6.9 months for the IFL regimen (p=0.0014), response rates were 45% versus 31% and survival advantage was 19.5 months versus 15 months (p=0.0001) [4].
A series of combinations of oxaliplatin on the background of de Gramont bolus and infusions of 5-florouracil/leucovorin have been published, referred to collectively as FOLFOX 1-7 [1].
Oxaliplatin has also been combined with capecitabine, an oral prodrug producing 5-florouracil intracellularly. Oxaliplatin (130 mg/m2 on day 1) and capecitabine (1250 mg/m2 twice daily on days 1-14 every 3 weeks) produced a partial response rate of 49% in 42 patients without prior therapy and 15% in 26 patients with prior 5-fluorouracil. Borner et al. recommended a reduced dose of capecitabine (to 1000 mg/m2 twice daily) for patients with prior therapy. In another phase II study, oxaliplatin and capecitabine were given to 43 patients, with a response rate of 44%, median overall survival of 20 months and dose limiting diarrhoea occurring in 28% of the patients [5]. Two- and three-week courses of oxaliplatin and capecitabine combinations were explored in a randomized trial. The bi-weekly regimen had a higher response rate (54.5% vs. 42.2%) and a longer progression-free survival (10.5 months vs. 6 months, p=0.013) [6].
Materials and Methods
Study design
An observational single center study conducted with an unblinded case-control design. Two groups, metastatic colon cancer patients with disease progression at 6 months after receiving oxaliplatin-based therapy (cases) and metastatic colon cancer patients with stable disease, disease with partial remission or disease with complete remission at 6 months after receiving oxaliplatin-based therapy (controls) were compared. Two endpoints are addressed in this cohort of metastatic colon cancer patients. The primary endpoint addressed is disease progression at 6 months after receiving oxaliplatin-based therapy, while the secondary endpoint addressed is the time to disease progression.
Settings
The study recruited metastatic colon cancer patients from Saad Specialist Hospital’s cancer registry in AlKhobar, Eastern province, Saudi Arabia. The patients were diagnosed with the disease and received oxaliplatin-based therapy from November 2009 to April 2010. Ten patients with histologically proven metastatic colorectal cancer (6 female patients, 4 male patients; mean age 51.4 years, range 33-72 years) underwent baseline PET-CT before exposure to cycle 1 of the oxaliplatinbased therapy and re-evaluation PET-CT after exposure to cycle 3 of the oxaliplatin-based therapy. The baseline is exposure to cycle 1 of the oxaliplatin-based therapy. The predictor variable that is expected to predict the end point is the absence of metabolic response. The patients who didn’t reach the primary endpoint at 6 months of receiving oxaliplatin-based therapy were followed up every 3 months until disease progression. The data collection started long after the exposure of interest existed, and its source was the patients’ medical records.
Participants
The participants (both the cases and the controls diagnosed and treated in late 2009 and early 2010) were identified and selected based on the following eligibility criteria:
Inclusion criteria:
• Patients to be given oxaliplatin-based therapy
• Patients having histopathologically confirmed metastatic colon cancer
• Prior adjuvant chemotherapy for non-metastatic colon cancer completed more than 4 weeks before enrolment and the patient has disease recurrence identified on CT
• Objectively measurable disease on CT
• Eastern Cooperative Oncology Group performance status score 0 to 2
• Adequate bone marrow (granulocytes ≥ 1,500/μL, platelets ≥ 100,000/μL), renal (Creatinine ≤ 1.5 mg/dL or Creatinine clearance ≥ 60 mL/min), and hepatic function (total bilirubin ≤1 × upper limit of normal, AST ≤ 2.5 × upper limit of normal)
• Patients were at least 18 years old and had a life expectancy of at least 12 weeks.
Exclusion criteria:
• Prior palliative chemotherapy for metastatic colon cancer
• History of Inflammatory diseases because inflammatory diseases may lead to misinterpretation [False Positives] of FDG-PET scans secondary to increased FDG uptake at sites of inflammation [7].
• History of radiation therapy in the last 6 months because FDG uptake immediately following radiation may be due to inflammatory changes and isn’t always associated with residual tumour and thus may lead to false positives [8].
• Poorly controlled Diabetes Mellitus requiring Insulin
• Pregnancy
• History of contrast allergy (relative contraindication)
Disease response assessment
The predictor variable included in the analysis was the absence of metabolic response. Less than 30% reduction in the re-evaluation PET-CT SUV compared to the baseline PET-CT SUV was considered absence of metabolic response while more than 30% reduction in the re-evaluation PET-CT SUV compared to the baseline PET-CT SUV was considered metabolic response. PET-CT SUV depends on the time interval between injection and scanning, duration of scanning, plasma clearance of 18F-FDG, plasma glucose concentration, and method of image reconstruction [9].
According to Turku PET Centre (2010), SUV (g/mL) is calculated as the ratio of tissue radioactivity concentration (C) at time (T) (kBq/mL) to the injected dose (MBq) divided by body weight (kg) [10].
SUVbw = CPET(T)/(Injected dose/Patient's weight)
Calculation of SUV does not require blood sampling or dynamic imaging. The imaging must take place at a late time point, and always at the same time point, if results are to be compared [11].
SUV calculation assumes that 18F-FDG uptake has reached steady state and that dephosphorylation of FDG-6-phosphate is negligible, so that net accumulation of FDG-6-phosphate is proportional to the rate of glycolysis thus giving a simple semi quantitative measure of tumour metabolism [9].
Positron Emission Tomography Response Criteria in Solid Tumours (PERCIST), based on PET measurements of changes of tumour metabolism, defines the four metabolic response categories of complete metabolic response (CMR), partial metabolic response (PMR), stable metabolic disease (SMD) and progressive metabolic disease (PMD). Criteria for CMR are: complete resolution of 18F-FDG uptake within measurable target lesion so that it is less than mean liver activity and indistinguishable from surrounding background blood-pool levels; disappearance of all other lesions to background bloodpool levels; and no new 18F-FDG avid lesions in pattern typical of cancer. Criteria for PMR are: reduction of minimum of 30% in target measurable tumour 18F-FDG standardized uptake value corrected for lean body mass (SUL) peak; absolute drop in SUL must be at least 0.8 SUL units, as well; target measurable lesion is the same lesion as baseline but can be another lesion if that lesion was previously present and is the most active lesion after treatment; and region of interest (ROI) does not have to be in precisely same area as baseline scan, though typically it is. SMD isn’t CMR, PMR, or PMD. Criteria for PMD include: more than 30% increase in 18F-FDG SUL peak, with more than 0.8 SUL units increase in tumour SUV peak from baseline scan in pattern typical of tumour and not of infection or treatment effect; or visible increase in extent of 18F-FDG tumour uptake (75% in total lesion glycolysis (TLG) volume with no decline in SUL); or new 18F-FDG avid lesions typical of cancer and unrelated to treatment effect or infection [12]. Response Evaluation Criteria in Solid Tumours (RECIST), based on CT measurements of changes of tumour size in one dimension, define the four therapeutic response categories of complete response (CR), partial response (PR), stable disease (SD) and progressive disease (PD). RECIST specified the number of target lesions to assess (up to 10, maximum 5 per organ). RECIST also specified the minimum size of the lesions to be assessed, typically 1 cm using modern CT with 5 mm or thinner slices. Lesions of adequate size for measurement are described as ‘‘measurable”. There are also designations of ‘‘target’’ and ‘‘non-target’’ lesions. All target lesions are measurable. Some non-target lesions are measurable. Both can contribute to disease progression and to complete response. CR is disappearance of all target lesions, confirmed at or more than 4 weeks later. PR is more than or equal to 30% decrease in the sum of longest diameter (LD) of all target lesions from baseline, confirmed at 4 weeks later. SD isn’t CR, PR, or PD. PD is either more than or equal to 20% increase in the sum of LD of all target lesions from baseline, or appearance of new lesions. A newer version of RECIST, RECIST 1.1, reported in January 2009, includes several updates and modifications to refine the prior RECIST criteria. In RECIST 1.1, the number of target lesions to assess is up to 5, maximum 2 per organ. Also the overall definition of progressive disease has changed in RECIST 1.1 by requiring an absolute increase in the sum of LD of all target lesions from baseline of at least 5 mm. This requirement prevents a minimal (less than 5 mm sum of LD of all target lesions from baseline) 20% increase from being categorized as progressive disease. RECIST 1.1 dealt with lymph nodes differently than did the original RECIST criteria. In the original RECIST, the longest axis of lymph nodes was to be measured and the lymph nodes had to disappear completely to secure a complete response. In RECIST 1.1, the short axis of lymph nodes is measured and nodes with short axes under 1 cm are considered normal [9,12].
Study size
The number of metastatic colon cancer patients diagnosed and treated during the study period determined the sample size.
Quantitative variables
Metastatic colon cancer patients who received oxaliplatinbased therapy and had less than 30% reduction in the reevaluation PET-CT SUV (after exposure to cycle 3 of the oxaliplatin-based therapy) compared to the baseline PET-CT SUV (before exposure to cycle 1 of the oxaliplatin-based therapy) were considered non-metabolic responders. More than 30% reduction in the re-evaluation PET-CT SUV compared to the baseline PET-CT SUV was considered metabolic response. The case-control study examined the absence of metabolic response as a predictable variable for the occurrence of disease progression at 6 months of receiving oxaliplatin-based therapy
Statistical methods
The incidence rate of disease progression at 6 months of receiving oxaliplatin-based therapy in both the group with absent metabolic response and the group with metabolic response can be estimated. Also, the incidence rate of stable disease, disease with partial remission or disease with complete remission at 6 months of receiving oxaliplatin-based therapy in both the group with absent metabolic response and the group with metabolic response can be estimated.
The PET-CT data of the 10 patients with metastatic colorectal cancer who have previously received oxaliplatinbased therapy was collected and analysed retrospectively and accordingly the patients were classified into non-metabolic responders (patients who responded to the oxaliplatin by PETCT criteria, defined as having less than 30% reduction in the re-evaluation PET-CT SUV) versus metabolic responders (patients who responded to the oxaliplatin by PET-CT criteria, defined as having more than 30% reduction in the reevaluation PET-CT SUV).
Using the MedCalc software version 11.5.1.0, the Cox proportional hazards regression survival curve was computed as follows:
Required data input to the Cox proportional hazards regression model: The sample size is 10, survival time is the time (months) to reach the event of interest, which is disease progression, endpoint is disease progression at 6 months of receiving oxaliplatin-based therapy. This variable contains code 1 for the cases that were with disease progression at 6 months of receiving oxaliplatin-based therapy, or code 0 for the controls that were with stable disease, disease with partial remission or disease with complete remission at 6 months of receiving oxaliplatin-based therapy. The predictor variable that is expected to predict survival is the absence of metabolic response and it is coded 1 in case of non-metabolic response, or 0 in case of metabolic response.
The nominal categorical variable identified is the absence of metabolic response. Absence of metabolic response is also selected to identify graph subgroups.
The results are computed using the software and the graph displayed shows the difference in the survival curves between the non-metabolic response group and the metabolic response group. The graph shows that the metabolic response group is more likely to have longer time to disease progression than the non-metabolic response group.
The best strategy to deal with missing data is maximizing data collection, determining the type of missing data and considering multiple imputations for replacement [13]. To deal with missing data in this case-control study, the analysis was restricted to participants with complete data on all required variables.
Results
Participants
Of the 25 participants assessed for eligibility, only 18 were found to be eligible, matching the inclusion criteria and lacking the exclusion criteria. The 18 eligible participants were included in the study and the remaining participants were not selected because either their eligibility was unable to be determined or wasn't met.
Of the recruited 18 participants, 10 participants continued their follow up until 14 months after study inclusion. Reasons for dropouts include withdrawal of the participants, chemotherapy adverse event, treatment or non-treatment related death and lost to follow up. The clinical and PET-CT data of those 10 participants only were analysed retrospectively.
Descriptive data
The ten participants whose clinical and PET-CT data were analysed at the end of the study were 60% females and 40% males, mean age was 51.4 years (range 33-72 years), mean body weight was 78.8 kg (range 55-114 kg) and mean blood glucose level was 107.9 mg/dL (range 56-175 mg/dL). The standardized uptake values were corrected for lean body mass (SUL) or body surface area (BSA).
The ten participants whose clinical and PET-CT data were analysed at the end of the study were 60% females and 40% males, mean age was 51.4 years (range 33-72 years), mean body weight was 78.8 kg (range 55-114 kg) and mean blood glucose level was 107.9 mg/dL (range 56-175 mg/dL). The standardized uptake values were corrected for lean body mass (SUL) or body surface area (BSA).
Patient 1:
• Diagnosed with histopathologically confirmed metastatic colon cancer to the liver, bones and ovaries on November 7, 2009
• Baseline PET-CT before cycle 1 day 1 of FOLFOX 4 on November 10, 2009
• Received Cycle 1 Day 1 of biweekly FOLFOX 4 regimen on November 14, 2009
• Re-evaluation PET-CT after cycle 3 day 15 of FOLFOX 4 on January 30, 2010 showed 17.6% reduction in SUV and CT abdomen after cycle 5 day 1 of FOLFOX 4 on March 13, 2010 (because of progressive abdominal pain) showed development of new lesions and disease progression
• Changed the chemotherapy regimen to IFL on March 20, 2010
• Time to disease progression was 4 months.
Patient 2:
• Diagnosed with histopathologically confirmed metastatic colon cancer to the liver, peritoneum and para aortic lymph nodes on January 5, 2010
• Underwent baseline PET-CT before cycle 1 of CAPOXBevacizumab combination regimen on January 9, 2010
• Received cycle 1 of CAPOX-Bevacizumab regimen on January 12, 2010
• Underwent re-evaluation PET-CT after cycle 3 of CAPOXBevacizumab regimen on March 6, 2010 which showed 55% reduction in SUV
• CT abdomen after cycle 6 of CAPOX-Bevacizumab regimen on June 5, 2010 showed 30% increase in lesion longest diameter and disease progression
• Started a new regimen (IFL) on June 18, 2010
• Time to disease progression was 5 months.
Patient 3:
• Diagnosed with histopathologically confirmed metastatic colon cancer to the peritoneum on December 17, 2009
• Underwent baseline PET-CT before cycle 1 day 1 of biweekly FOLFOX 6-Bevacizumab combination regimen on December 22, 2009
• Received cycle 1 day 1 of FOLFOX 6-Bevacizumab on December 26, 2009
• Re-evaluation PET-CT after cycle 3 day 15 of FOLFOX 6- Bevacizumab regimen on March 15, 2010 showed 14.5% increase in SUV and CT abdomen after cycle 6 day 15 of FOLFOX 6-Bevacizumab regimen on June 16, 2010 showed 57% increase in lesion longest diameter and disease progression
• Started a new regimen (Capecitabine single agent) on June 27, 2010
• Time to disease progression was 6 months.
Patient 4:
• Diagnosed with histopathologically confirmed metastatic colon cancer to the lungs on November 17, 2009
• Baseline PET-CT before cycle 1 day 1 of FOLFOX 4 on November 22, 2009
• Received cycle 1 day 1 of biweekly FOLFOX 4 regimen on November 25, 2009
• Underwent re-evaluation PET-CT after cycle 3 day 15 of FOLFOX 4 regimen on February 11, 2010 which showed 51.4% reduction in SUV
• Underwent CT thorax after cycle 6 day 15 of FOLFOX 4 regimen on May 9, 2010 which showed disappearance of lesion and complete remission
• Underwent a follow up CT thorax every 3 months until disease recurrence was shown by CT thorax done on December 18, 2010
• Underwent metastatectomy followed by starting a new regimen (IFL) on December 23, 2010
• Time to disease progression was 13 months
Patient 5:
• Diagnosed with histopathologically confirmed metastatic colon cancer to the liver, peritoneum and ovaries on March 16, 2010
• Baseline PET-CT before cycle 1 day 1 of FOLFOX 4 on March 20, 2010
• Received cycle 1 day 1 of biweekly FOLFOX 4 regimen on March 24, 2010
• Underwent re-evaluation PET-CT after cycle 3 day 15 of FOLFOX 4 regimen on June 15, 2010 which showed 44.85% reduction in SUV
• Underwent CT abdomen after cycle 6 day 15 of FOLFOX 4 regimen on September 7, 2010 which showed 43% decrease in lesion longest diameter and partial remission
• Follow up CT abdomen on November 10, 2010 showed disease progression
• Started a new regimen (CAPOX-Bevacizumab) on November 24, 2010
• Time to disease progression was 8 months
Patient 6:
• Diagnosed with histopathologically confirmed metastatic colon cancer to the lungs on January 20, 2010
• Underwent baseline PET-CT before cycle 1 of CAPOX on January 24, 2010
• Received cycle 1 of CAPOX regimen on January 28, 2010
• Underwent re-evaluation PET-CT after cycle 3 of CAPOX regimen on March 21, 2010 which showed 45% reduction in SUV
• Underwent CT thorax after cycle 6 of CAPOX regimen on May 27, 2010 which showed 71% decrease in lesion longest diameter and partial remission
• Underwent a follow up CT thorax every 3 months until disease progression was shown by CT thorax done on September 14, 2010
• Started a new regimen (Irinotecan-Bevacizumab) on September 25, 2010
• Time to disease progression was 8 months
Patient 7:
• Diagnosed with histopathologically confirmed metastatic colon cancer to the liver on April 5, 2010
• Underwent baseline PET-CT before Cycle 1 Day 1 of FOLFOX 4 on April 8, 2010
• Received Cycle 1 Day 1 of the biweekly FOLFOX 4 regimen on April 13, 2010
• Underwent re-evaluation PET-CT after cycle 3 Day 15 of FOLFOX 4 regimen on July 1, 2010 which showed 49% reduction in SUV
• CT abdomen after cycle 6 Day 15 of FOLFOX 4 regimen on September 23, 2010 showed disappearance of lesion and complete remission
• Underwent a follow up CT abdomen every 3 months until disease recurrence was shown by CT abdomen on December 9, 2010
• Started radiofrequency ablation on December 15, 2010
• Time to disease progression was 10 months
Patient 8:
• Diagnosed with histopathologically confirmed metastatic colon cancer to the liver on February 11, 2010
• Underwent baseline PET-CT before Cycle 1 of CAPOX on February 14, 2010
• Received Cycle 1 of CAPOX regimen on February 21, 2010
• Re-evaluation PET-CT after cycle 3 of CAPOX regimen on April 17, 2010 which showed 26.8% increase in SUV and CT abdomen after cycle 6 CAPOX on June 17, 2010 showed development of new lesions and disease progression
• Started a new regimen (Irinotecan-Bevacizumab) on June 25, 2010
• Time to disease progression was 4 months
Patient 9:
• Diagnosed with histopathologically confirmed metastatic colon cancer to the liver, hepatic, hilar and peripancreatic lymph nodes on November 22, 2009
• Baseline PET-CT before cycle 1 day 1 of FOLFOX 4 on November 26, 2009
• Received cycle 1 day 1 of biweekly FOLFOX 4 regimen on November 30, 2009
• Underwent re-evaluation PET-CT after cycle 3 day 15 of FOLFOX 4 regimen on February 18, 2010 which showed 42.8% reduction in SUV
• CT abdomen after cycle 6 day 15 of FOLFOX 4 regimen on May 15, 2010 showed 65% decrease in lesion longest diameter and partial remission
• Underwent a follow up CT abdomen every 3 months until disease progression was shown by CT abdomen on November 16, 2010
• Started a new regimen (IFL) on November 23, 2010
• Time to disease progression was 12 months
Patient 10:
• Diagnosed with histopathologically confirmed metastatic colon cancer to the liver, peritoneum and ovaries on December 9, 2009
• Baseline PET-CT before cycle 1 of CAPOX-Bevacizumab combination regimen on December 14, 2009
• Received cycle 1 of CAPOX-Bevacizumab on December 17, 2009
• Re-evaluation PET-CT after cycle 3 of CAPOX-Bevacizumab on February 6, 2010 showed 9.2% reduction in SUV and CT abdomen after cycle 6 of CAPOX-Bevacizumab on April 10, 2010 showed development of new lesions and disease progression
• Started a new chemotherapy regimen (IFL) on April 20, 2010
• Time to disease progression was 4 months
• Cases with disease progression at 6 months of receiving oxaliplatin-based therapy are coded 1 while controls with stable disease, disease with partial remission or disease with complete remission at 6 months of receiving oxaliplatin-based therapy are coded 0
• Non- metabolic responders are coded 1 while metabolic responders are coded 0
Outcome data
• Incidence rate of disease progression in non-metabolic responders =4/4=100%
• Incidence rate of disease progression in metabolic responders =1/6 17%
• Relative risk of disease progression in non-metabolic responders =6.0
Main results
The PET data of the study are presented according to Positron Emission Tomography Response Criteria in Solid Tumours (PERCIST), version 1.0.
The CT measurements of the study are presented according to Response Evaluation Criteria in Solid Tumours (RECIST), version 1.1 (Tables 1-6 and Figures 1 and 2).
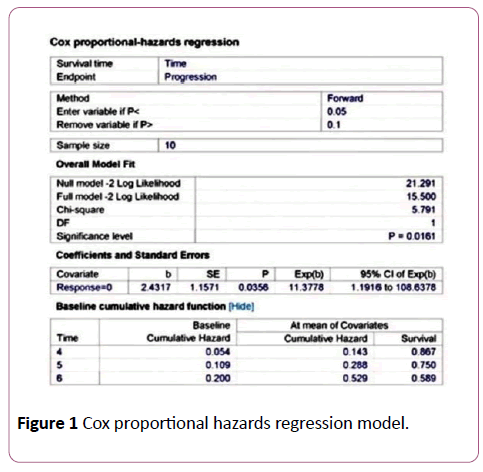
Figure 1: Cox proportional hazards regression model.
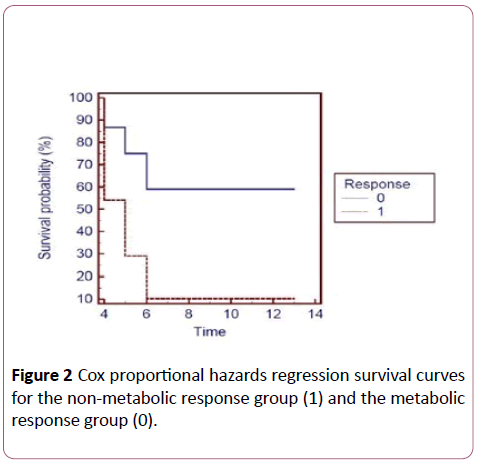
Figure 2: Cox proportional hazards regression survival curves for the non-metabolic response group (1) and the metabolic response group (0).
| Patient number |
Sex |
Age |
Body Weight |
Blood glucose level |
| 1 |
Female |
33-years-old |
60 kg |
90 mg/dL |
| 2 |
Female |
53-years-old |
85 kg |
165 mg/dL |
| 3 |
Male |
40-years-old |
108 kg |
127 mg/dL |
| 4 |
Female |
72-years-old |
55 kg |
65 mg/dL |
| 5 |
Female |
47-years-old |
66 kg |
79 mg/dL |
| 6 |
Male |
58-years-old |
114 kg |
175 mg/dL |
| 7 |
Male |
52-years-old |
78 kg |
92 mg/dL |
| 8 |
Male |
53-years-old |
62 kg |
56 mg/dL |
| 9 |
Female |
43-years-old |
67 kg |
82 mg/dL |
| 10 |
Female |
63-years-old |
93 kg |
148 mg/dL |
Table 1: Patient characteristics.
| Patient number |
Base line no of organs involved |
Base line no of lesions |
Base line SUV |
Re-evaluation no of organs involved |
Re-evaluation no: of lesions |
Re-evaluation SUV |
Metabolic response status |
Time to disease progression |
| 1 |
3 |
6 |
10.8 |
3 |
24 |
8.9 |
Non-responder |
4 months |
| 2 |
3 |
9 |
17 |
3 |
7 |
7.6 |
Responder |
5 months |
| 3 |
1 |
2 |
6.2 |
1 |
2 |
7.1 |
Non-responder |
6 months |
| 4 |
1 |
1 |
3.5 |
1 |
1 |
1.7 |
Responder |
13 months |
| 5 |
3 |
7 |
13.6 |
3 |
6 |
7.5 |
Responder |
8 months |
| 6 |
1 |
1 |
7.1 |
1 |
1 |
3.9 |
Responder |
8 months |
| 7 |
1 |
1 |
4.7 |
1 |
1 |
2.4 |
Responder |
10 months |
| 8 |
1 |
8 |
9.3 |
1 |
10 |
11.8 |
Non-responder |
4 months |
| 9 |
2 |
4 |
5.6 |
2 |
2 |
3.2 |
Responder |
12 months |
| 10 |
3 |
5 |
7.6 |
3 |
8 |
6.9 |
Non-responder |
4 months |
| Total No of Patients |
Total No
of Organs |
Total No
of Lesions |
No of Responders |
No of Non- Responders |
| 10 |
19 |
67 |
6 |
4 |
Table 2: Descriptive PET data.
| Patient number |
Time to disease progression (months) |
Disease progression at 6 months of receiving oxaliplatin-based therapy |
Metabolic response |
| 1 |
4 |
1 |
1 |
| 2 |
5 |
1 |
0 |
| 3 |
6 |
1 |
1 |
| 4 |
13 |
0 |
0 |
| 5 |
8 |
0 |
0 |
| 6 |
8 |
0 |
0 |
| 7 |
10 |
0 |
0 |
| 8 |
4 |
1 |
1 |
| 9 |
12 |
0 |
0 |
| 10 |
4 |
1 |
1 |
Table 3: Therapeutic response at 6 months of receiving oxaliplatin-based therapy and time to disease progression by metabolic response group.
| Variables |
Disease progression at 6 months of receiving oxaliplatin-based therapy |
|
| Positive |
Negative |
Total |
| Absence of metabolic response |
Present |
4 |
0 |
4 |
| Absent |
1 |
5 |
6 |
| |
Total |
5 |
5 |
10 |
Table 4: Incidence rates and relative risk of disease progression.
| Patient number |
Measurable target lesion baseline SUV (g/mL) |
Measurable target lesion Follow up SUV (g/mL) |
Objective metabolic response |
Overall metabolic response |
Duration of metabolic response |
| 1 |
10.8 |
8.9 |
SMD |
SMD |
4 months |
| 2 |
17 |
7.6 |
PMR |
PMR |
3 months |
| 3 |
6.2 |
7.1 |
SMD |
SMD |
6 months |
| 4 |
3.5 |
1.7 |
PMR |
PMR |
10 months |
| 5 |
13.6 |
7.5 |
PMR |
PMR |
5 months |
| 6 |
7.1 |
3.9 |
PMR |
PMR |
6 months |
| 7 |
4.7 |
2.4 |
PMR |
PMR |
5 months |
| 8 |
9.3 |
11.8 |
SMD |
SMD |
4 months |
| 9 |
5.6 |
3.2 |
PMR |
PMR |
9 months |
| 10 |
7.6 |
6.9 |
SMD |
SMD |
4 months |
Table 5: PET data according to PERCIST, Version 1.0.
| Patient number |
Measurable target lesion baseline longest diameter (mm) |
Measurable target lesion Follow up longest diameter (mm) |
Objective anatomic response |
Overall anatomic response |
Duration of anatomic response |
| 1 |
32 |
29 |
PD |
PD |
4 months |
| 2 |
53 |
69 |
PD |
PD |
5 months |
| 3 |
21 |
33 |
PD |
PD |
6 months |
| 4 |
17 |
0 |
CR |
CR |
13 months |
| 5 |
35 |
20 |
PR |
PR |
8 months |
| 6 |
24 |
7 |
PR |
PR |
8 months |
| 7 |
15 |
0 |
CR |
CR |
10 months |
| 8 |
29 |
33 |
PD |
PD |
4 months |
| 9 |
26 |
9 |
PR |
PR |
12 months |
| 10 |
45 |
281 |
PD |
PD |
4 months |
Table 6: CT measurements according to RECIST, Version 1.1.
Discussion
Key results
This case-control study hypothesized that:
• Absence of metabolic response to oxaliplatin-based therapy is a possible risk factor for progressive metastatic colorectal cancer
• Metastatic colon cancer patients exposed to metabolic response have longer time to disease progression compared to metastatic colon cancer patients exposed to absence of metabolic response
Analysis of the PET data and CT measurements of the study participants was according to Positron Emission Tomography Response Criteria in Solid Tumours (PERCIST), version 1.0 and Response Evaluation Criteria in Solid Tumours (RECIST), version 1.1 respectively. Correlation of the analysed PET data and CT measurements showed that non-metabolic responders had higher incidence rate of disease progression at 6 months of receiving oxaliplatin-based therapy compared to metabolic responders. Using the MedCalc software version 11.5.1.0, the Cox proportional hazards regression survival curve was computed showing the metabolic responders more likely to have longer time to disease progression compared to the nonmetabolic responders. Being a case-control study makes it the first step in testing the two previously mentioned hypotheses that can be validated in a cohort study.
The consequence (effect) of the exposure (risk factor) was observed without trying to influence what happened. Interpretation of the study results and explanation of the exposure-consequence relationship was according to Bradford- Hill criteria for causation [14].
The strength of the association between the exposure (absence of metabolic response to oxaliplatin-based therapy) and the consequence (disease progression at 6 months of receiving oxaliplatin-based therapy) was confirmed in different studies. Bender, et al. concluded that all metastases responding to therapy (n=6) exerted a statistically significant decrease of FDG uptake (-22 ± 10%), metastases showing a short-term effect (duration of tumour reduction <3 months) (n=2) had a slightly diminished decrease of FDG uptake, and progressing metastases (n=3) had an enhanced FDG uptake (13 ± 17%; p ≤ 0.01) [15]. Calvo et al. studied 25 patients with locally advanced colorectal cancer in Spain and showed that post-treatment SUV was smaller in the patients who responded [16]. Capirci, et al. conducted a study on 81 patients in Italy. PET was used to restage patients with stage II–III adenocarcinoma who had received neoadjuvant chemoradiotherapy and were to undergo surgery 8-9 weeks later. In terms of clinical response 10 out of 12 clinical responders were PET negative. In terms of pathological response, 22 out of 28 complete responders were PET negative [17].
The exposure-consequence relationship is consistently observed in different studies and settings. Two prognostic studies addressed the prognostic value of FDG-PET in patients with metastatic colorectal carcinoma and concluded that pretreatment FDG uptake in metastatic colorectal cancer predicted outcome, irrespective of the subsequent treatment modality, as patients with FDG avid disease showed reduced overall survival and patients with low FDG uptake had a significant survival benefit. The first study by De Geus-Oei, et al. concluded that SUV in metastases was a significant predictor for overall survival (hazard ratio 1.17, 95% confidence interval 1.06-1.30, p= 0.002), independent of the subsequent treatment. According to the median value of the patient population a low (SUV<4.26) and high (SUV>4.26) uptake groups were defined. The median survival and the 2 and 3-year survival rates were 32 months, 59% and 45%, respectively, in the low-uptake group and 19 months, 37% and 28%, respectively, in the high-uptake group (p=0.017) [18]. The second study by Riedl, et al. showed that survival was significantly longer for patients with a low SUV than for patients with a high SUV, with p values of 0.014, 0.025, and 0.0095 for SUV cut-offs of 5, 7, and 10, respectively [19].
Generalizability
How applicable are the key results of this case-control study to other metastatic colon cancer patients? Can results from study participants be extrapolated to patients of the target population? There is an element of selection bias caused by enrolling a highly selected cohort of metastatic colon cancer patients that didn’t receive prior palliative chemotherapy. Also, the patients who withdrew, discontinued their treatment because of chemotherapy adverse event, deceased due to treatment or non-treatment related event, or lost to follow up were systematically excluded at enrolment and their clinical and PET-CT data weren’t analysed retrospectively. Only the participants with complete data on all required variables were analysed. This strategy for dealing with missing data [perprotocol analysis] aims at determining the maximum potential effectiveness of PET-CT as an imaging biomarker for assessing the absence of metabolic response to oxaliplatin-based therapy as a possible risk factor for progressive metastatic colorectal cancer but can lead to loss of efficiency. What justifies using per-protocol analysis is that being a case-control study makes it the first step in testing the two previously mentioned hypotheses that can be validated in a cohort study.
Conclusion
Many malignancies, including colorectal carcinoma, have increased glucose metabolism. They accumulate the positron emitting glucose analog FDG and can thus be visualized using PET. Previous studies clearly indicated that FDG-PET is of value in the diagnostic work-up of patients with colorectal liver metastases and that FDG-PET as a complementary staging method improves the therapeutic management, especially by detecting unsuspected extrahepatic disease [20-23]. A recent study reported on therapy response monitoring with FDG-PET and the biologic basis of the change of tumour FDG uptake in patients treated with neo-adjuvant chemotherapy [23]. Several investigators have speculated that the amount of FDG uptake correlated with biologic factors such as Ki-67, proliferating cell nuclear antigen, Glut-1 and hexokinase [23], and that FDG uptake resembles the biological behaviour of the tumour and might be associated with intrinsic biologic characteristics, such as hypoxia [24], low apoptosis rate [25], cell viability [26], proliferative activity [27] and p53 overexpression [28]. These characteristics are all potentially adverse factors in patients treated with radiotherapy or chemotherapy, while some of them may also impact negatively in patients treated surgically. The advantage of FDGPET is that it is a non-invasive, in vivo method that can, not only subjectively, but also quantify FDG uptake to distinguish metabolically active from less active tumour and depict therapy-induced changes in tumour, impacting on patient management. Findlay, et al. showed that, 4-5 weeks after start of chemotherapy (5-fluorouracil with or without interferon-α), FDG uptake differentiated responders and nonresponders, both in a patient-based and in a lesion-based analysis [29]. Furthermore, Dimitrakopoulou-Strauss, et al. reported similar findings in patients treated with 5-fluorouracil, folinic acid and oxaliplatin (FOLFOX regimen) [30].
A potential area for further research which hasn’t been approached and studied in-depth yet is the quantitative analysis of FDG uptake by the tumour before chemotherapeutic treatment where the pre-treatment FDGPET can be predictive for response. This may enable appropriate selection of high-risk candidates for aggressive therapies and treatment combinations and could be useful as an early indicator of tumour chemosensitivity, helping to refine therapeutic strategies.
23691
References
- Niederhuber JE, Armitage JO, Doroshow JH, Kastan MB, Tepper JE (2012) Abeloff's Clinical Oncology: E-Book. Elsevier Health Sciences.
- Parkin D, Bray F, Ferlay J, Pisani P (2005) Global Cancer Statistics, 2002. CA: CA: Cancer J. Clin 55(2): 74-108.
- https://seer.cancer.gov/statfacts/html/colorect.html#incidence-mortality
- Goldberg RM, Sargent DJ, Morton RF, Fuchs CS, Ramanathan RK, et al. (2004) A randomized controlled trial of fluorouracil plus leucovorin, irinotecan, and oxaliplatin combinations in patients with previously untreated metastatic colorectal cancer. J Clin Oncol 22(1): 23-30.
- Zeuli M, Nardoni C, Pino MS, Gamucci T, Gabriele A, et al. (2003) Phase II study of capecitabine and oxaliplatin as first-line treatment in advanced colorectal cancer. Ann Oncol 14(9): 13781382.
- Scheithauer W, Kornek GV, Raderer M, Schu¨ll B, Schmid K, et al. (2003) Randomized multicenter phase II trial of two different schedules of capecitabine plus oxaliplatin as first-line treatment in advanced colorectal cancer. J Clin Oncol 21(7): 1307-1312.
- Huebner RH, Park KC, Shepherd JE, Schwimmer J, Czernin J, et al. (2000) A meta-analysis of the literature for whole-body FDG PET detection of recurrent colorectal cancer. J Nucl Med 41(7): 1177-1189.
- Haberkorn U, Strauss LG, Dimitrakopoulou A, Engenhart R, Oberdorfer F, et al. (1991) PET studies of fluorodeoxyglucose metabolism in patients with recurrent colorectal tumors receiving radiotherapy. J Nucl Med 32(8): 1485-1490.
- O'Connor JP, Jackson A, Asselin MC, Buckley DL, Parker GJ, et al. (2008) Quantitative imaging biomarkers in the clinical development of targeted therapeutics: current and future perspectives. Lancet Oncol 9(8): 766-776.
- https://www.pet.fi/index.php?option=com_content&view=article&id=185%3Asuv&catid=62%3Amodeling&lang=en
- Eckelman WC, Tatum JL, Kurdziel KA, Croft BY (2000) Quantitative analysis of tumor biochemisty using PET and SPECT1. Nucl Med Biol 27(7): 633-635.
- Wahl RL, Jacene H, Kasamon Y, Lodge MA (2009) From RECIST to PERCIST: evolving considerations for PET response criteria in solid tumors. J Nucl Med 50(1): 122.
- Hill AB (1965) The environment and disease: Association or causation?. J Royal Soc Med 58: 295-300.
- Bender H, Bangar DN, Metten N, Bangard M, Mezger J, et al. (1999) Possible role of FDG-PET in the early prediction of therapy outcome in liver metastases of colorectal cancer. Hybridoma 18(1): 87-91.
- Calvo FA, Domper M, Matute R, MARTinez-Lazaro R, Arranz JA, et al. (2004) 18F-FDG positron emission tomography staging and restaging in rectal cancer treated with preoperative chemoradiation. IJROBP 58(2): 528-535.
- Capirci C, Rubello D, Chierichetti F, Crepaldi G, Carpi A, et al. (2004) Restaging after neoadjuvant chemoradiotherapy for rectal adenocarcinoma: role of F18-FDG PET. Biomed. Pharmacother 58(8): 451-457.
- De Geus-Oei LF, Wiering B, Krabbe PF, Ruers TJ, Punt CJ, et al. (2006) FDG-PET for prediction of survival of patients with metastatic colorectal carcinoma. Ann Oncol 17(11): 1650-1655.
- Riedl CC, Akhurst T, Larson S, Stanziale SF, Tuorto S, et al. (2007) 18F-FDG PET scanning correlates with tissue markers of poor prognosis and predicts mortality for patients after liver resection for colorectal metastases. J Nucl Med 48(5): 771-775.
- Ruers TJ, Langenhoff BS, Neeleman N, Jager GJ, Strijk S, et al. (2002) Value of positron emission tomography with [F-18] fluorodeoxyglucose in patients with colorectal liver metastases: a prospective study. J Clin Oncol 20(2): 388-395.
- Bipat S, Van Leeuwen MS, Comans EF, Pijl ME, Bossuyt PM, et al. (2005) Colorectal liver metastases: CT, MR imaging, and PET for diagnosisâ€Ââ€ÂÃÂmeta-analysis. Radiology 237(1): 123-131.
- Wiering B, Krabbe PF, Jager GJ, Oyen WJ, Ruers TJ (2005) The impact of fluor-18-deoxyglucose-positron emission tomography in the management of colorectal liver metastases: A Systematic Review and Metaanalysis. Cancer 104(12): 2658-2670.
- Akhurst T, Kates TJ, Mazumdar M, Yeung H, Riedel ER (2005) Recent chemotherapy reduces the sensitivity of [18F] fluorodeoxyglucose positron emission tomography in the detection of colorectal metastases. J Clin Oncol 23(34):8713-8716.
- Clavo AC, Brown RS, Wahl RL (1995) Fluorodeoxyglucose uptake in human cancer cell lines is increased by hypoxia. J Nucl Med 36(9): 1625-1632.
- Furuta M, Hasegawa M, Hayakawa K, Yamakawa M, Ishikawa H, et al. (1997) Rapid rise in FDG uptake in an irradiated human tumour xenograft. Eur J Nucl Med Mol 24(4): 435-438.
- Minn H, Clavo AC, Grenman R, Wahl RL (1995) In vitro comparison of cell proliferation kinetics and uptake of tritiated fluorodeoxyglucose and L-methionine in squamous-cell carcinoma of the head and neck. Arbor 1050: 46109-0028.
- Haberkorn U, Strauss LG, Reisser CH, Haag D, Dimitrakopoulou A, et al. (1991) Glucose uptake, perfusion, and cell proliferation in head and neck tumors: relation of positron emission tomography to flow cytometry. J Nucl Med 32(8): 1548.
- Crippa F, Seregni E, Agresti R, Chiesa C, Pascali C, et al. (1998) Association between [18 F] fluorodeoxyglucose uptake and postoperative histopathology, hormone receptor status, thymidine labelling index and p53 in primary breast cancer: a preliminary observation. European J Nucl Med 25(10): 1429-1434.
- Findlay M, Young H, Cunningham D, Iveson A, Cronin B, et al. (1996) Noninvasive monitoring of tumor metabolism using fluorodeoxyglucose and positron emission tomography in colorectal cancer liver metastases: correlation with tumor response to fluorouracil. J Clin Oncol 14(3):700-708.
- Dimitrakopoulou-Strauss A, Strauss LG, Rudi J (2003) PET-FDG as predictor of therapy response in patients with colorectal carcinoma. QJ Nucl Med Mol Imaging 47(1): 8.