Keywords
Fornix; Diffusion tensor imaging; Idiopathic normal pressure hydrocephalus; Alzheimer’s disease
Abbreviations
DTI: Diffusion Tensor Imaging; FA: Fractional Anisotropy, ADC: Apparent Diffusion Coefficient; ROI: Region of Interest; iNPH: Idiopathic Normal Pressure Hydrocephalus; AD: Alzheimer’s Disease
Introduction
The fornix is an arch-shaped, white-matter tract carrying the output fibers of the hippocampus to the mamillary bodies and septal nuclei. It is composed of the crura, the commissure, the body, and the columns [1,2]. The fornix is recognized as a part of the Papez circuit [3], and it plays a vital role in the memory function [4]. Damage to the fornix can result in memory impairment.
DTI is an advanced MRI technique that can be used to investigate early microstructural changes in the brain. Through this technique, the degree of anisotropy of the directional movement of water molecules in particular white matter fibers can be derived and measured with fractional anisotropy (FA), apparent diffusion coefficient (ADC) and fiber tractography. DTI is widely used to evaluate the integrity of various white matter tracts following microstructural changes.
The most common cause of neurodegenerative dementia is Alzheimer’s disease. The pathophysiology begins at the entorhinal cortex with neurofibrillary tangle deposits and neuronal loss. The fornix alteration occurring during Alzheimer’s disease has been histologically proven to be due to neurodegeneration, and the alteration has been recently demonstrated with FA and mean diffusivity (MD) changes using the DTI technique [5-9]. Furthermore, many studies have demonstrated a correlation between FA changes and cognitive function which can be used to predict clinical outcomes.
iNPH is one of the few, treatable causes of dementia, and it was first described by Hakim and Adams in 1965 [10]. Patients present with the classic signs and symptoms of gait disturbance, urinary incontinence, and dementia, and the disease is associated with an imaging finding of ventricular enlargement without elevated cerebrospinal fluid (CSF) pressure. Both the clinical presentations and the radiographic findings of iNPH and Alzheimer’s disease overlap, making diagnosis often challenging for neurologists and neurosurgeons. Many previous studies have demonstrated an FA change in the fornix of patients with Alzheimer’s disease, but few studies have investigated the white matter integrity of iNPH patients [11,12], particularly in the fornix.
Based on the differences in the pathophysiology of these two diseases, we hypothesized that the pattern of white matter tract change might be different in terms of the DTI parameters. We were interested in the fornix fiber because the anatomy of the fornix is very close to the ventricle, which might be one of the most affected tracts and might explain the clinical signs of cognitive impairment evident among iNPH patients.
To date, no study has compared alterations in the fiber tracts of normal, healthy individuals with those of Thai iNPH and Alzheimer’s disease patients. The objective of this study was to explore any microfiber alteration of the fornix among those groups by using diffusion tensor imaging. Furthermore, the study aimed to investigate which DTI parameter(s) could be used to characterize those two diseases.
Materials and Methods
Subject selection
The study was approved by the Siriraj Institutional Review Board. Ten control subjects (6 males and 4 females; mean age 59.0 years; age range 50-72 years) were enrolled. Five of those subjects were part of the study “Thai Language Paradigm for Functional MRI: A Pilot Study in Normal Volunteers” [13], while the other five were undergoing an MRI study due to having non-specific symptoms (like headache or vertigo), with no abnormal neurological examination and no gross MRI abnormality (such as infarction, hemorrhage or tumor mass lesions). The ten iNPH patients (6 males and 4 females; mean age 74.4 years; age range 62-88 years) were diagnosed using the diagnostic criteria for idiopathic normal pressure hydrocephalus [14]. The third group of ten patients were diagnosed with probable Alzheimer’s disease dementia, based on the NINCDS-ADRDA criteria 2011 [15] (5 males and 5 females; mean age 77.1 years; age range 70-82 years). All of the normal controlled subjects, iNPH and AD patients and have no significant white matter hyperintensity on MRI according to the modified criteria of Fazekas et al. [16]. Exclusion criteria is Fazekas score >1 to exclude small vessel disease.
MR imaging data acquisition
The MRI scans were performed on two machines. The first was a 3.0 Tesla MR system (Achieva, Philips, the Netherlands), with an 8-channel head coil. The DTI study was obtained with a single shot, diffusion-weighted spin echo EPI sequence; 32 diffusion encoding directions; diffusion weighting factor b=800 s/mm2 in addition to a single reference image (b=0); acquisition matrix 112 × 112; FOV=22.4 cm; voxel size=2 mm (RL) × 2 mm (AP), with 60 contiguous slices with a slice thickness of 2.3 mm; TR=10,371 ms; TE=54 ms; flip; and angle=90°. The acquisition time was 12:39 min.
The second machine was a 3.0 Tesla MR system (Ingenia, Philips Medical System, Best, the Netherlands), with a 16-channel head coil. The DTI study was obtained with a single shot, diffusionweighted spin echo EPI sequence; 32 diffusion encoding directions; diffusion weighting factor b=800 s/mm2 in addition to a single reference image (b=0); acquisition matrix 112 × 112; FOV=22.4 cm; voxel size=2 mm (RL) × 2 mm (AP), with 60 contiguous slices with a slice thickness of 2.0 mm; TR=9,978 ms; TE=104 ms; flip; and angle=90°. The acquisition time was 12:14 min.
3D-T1 weighted image and fluid-attenuated inversion recovery images were obtained for all patients. In the case of the Alzheimer’s patient group, a coronal oblique T1 weighted image at right angles to the longitudinal axis of the hippocampus was also obtained.
Data analysis
The DTI data were processed and analyzed to perform a diffusion tractography of the fornix with DSI Studio software [17] The method to draw the ROI was based on a basic knowledge of normal anatomy and previous literature [18-21]. In this study, seeding and target ROIs based on paths between two ROI methods were chosen. The ROIs were manually outlined on color images of the major diffusion tensor eigenvector (red=left–right, green=anterior–posterior, and blue=superior–inferior). The first ROI was placed at the crus of the fornix in the coronal plane, which is the most obvious, discrete, green-colored fiber (Figure 1A). The second ROI was placed in the most-anterior coronal view where the body part is visible (a green to blue color, as it is curved); see Figure 1B. A deterministic tractography was done on the right and the left fornix, separately (Figure 2), with a threshold FA value of at least 0.15 and a threshold angle of 60 degrees [5,7,18,22]. The mean FA, ADC, and the axial and radial diffusivities were measured on the left and right fornix, separately. The average of the left- and right-side values was calculated for each parameter. Two investigators performed the tractography using the same method; one of the researchers was a neuroradiologist, and the other was a fellow in neuroradiology. After the tractography was done, the derived fornix tract was compared with the 3D-T1 weighted image to confirm the fiber pathway.
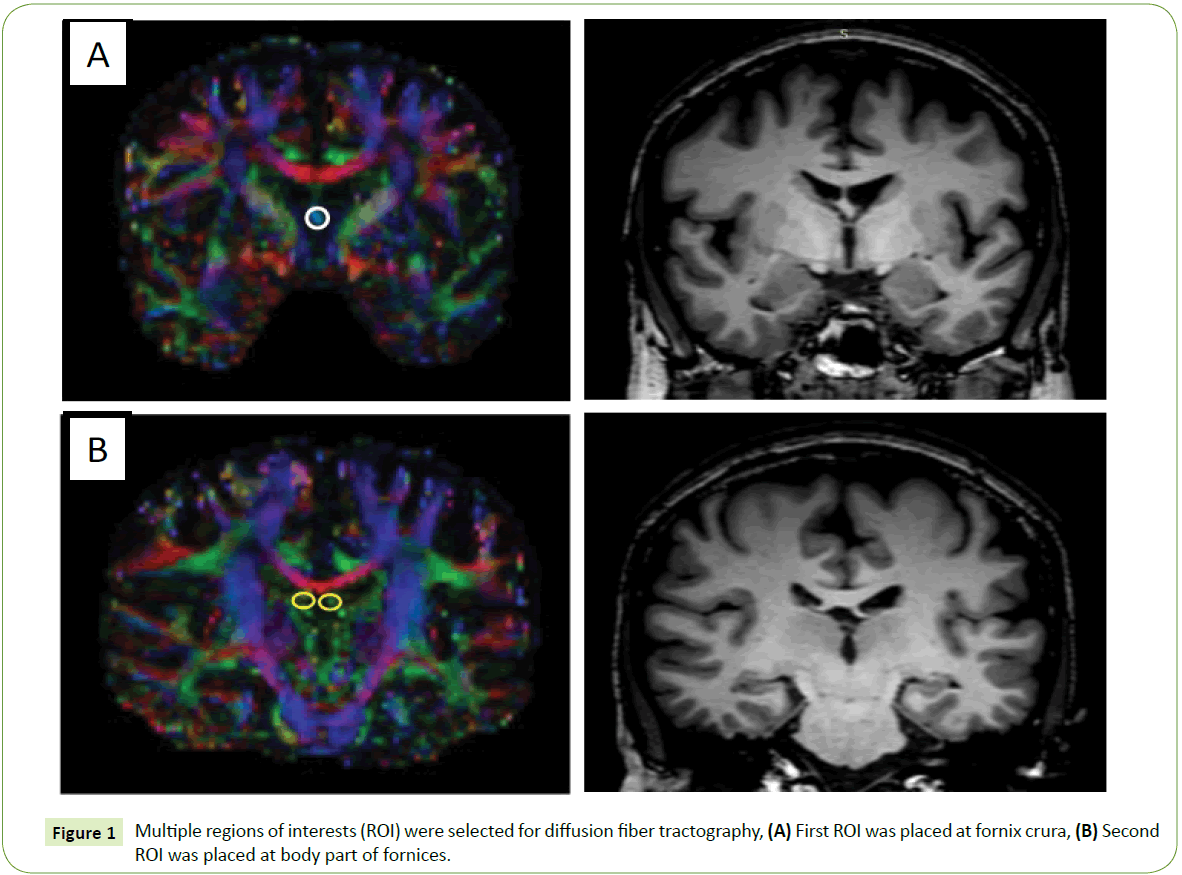
Figure 1: MRI brain DWI and ADC images on clinical presentation.
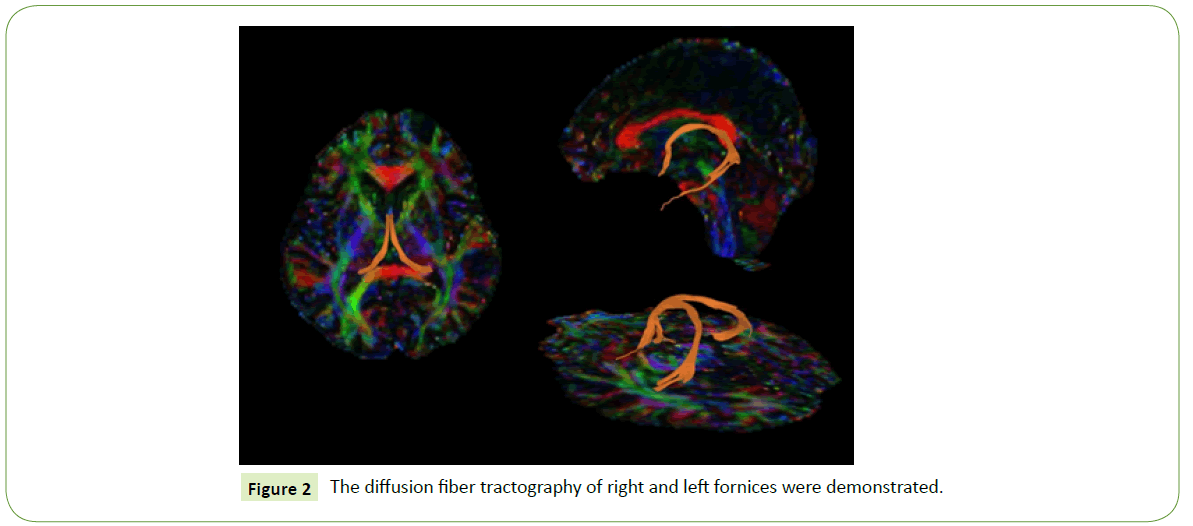
Figure 2: The diffusion fiber tractography of right and left fornices were demonstrated.
Statistical analysis
The resulting data were analyzed by using the Statistical Package for Social Sciences, Version 21 (SPSS Inc, Chicago, Illinois). A comparison of the data of those groups was performed by using one-way ANOVA with a post-hoc Tukey’s Honestly Significant Difference test or Games-Howell for the continuous variables; the Kruskal-Wallis test with post-hoc Mann-Whitney U tests for the non-continuous variables; and Pearson's chi-squared test for the categorical data. The criterion of statistical significance was p<0.05.
The area under the curve (AUC) was calculated from the receiver operating characteristic (ROC) by identifying the optimal cutoff value to distinguish iNPH from Alzheimer’s disease. The size of the area under the ROC curve represented the strength of the cutoff value between the FA, ADC, the mean axial and radial diffusivities, and the diagnostic performance. The PPV (positive predictive value) and NPV (negative predictive value) were also computed.
The interobserver reliability was examined by using the intraclass correlation coefficient (ICC). A kappa (κ) score of less than or equal to 0.4 indicated poor reliability, 0.41-0.59 fair reliability, 0.60-0.74 good reliability, and 0.75-1.00 excellent reliability.
Results
The patients’ demographic data are at Table 1. The mean age of the control group was statistically significantly lower than those of the iNPH and AD groups (p<0.01). However, there was no significant difference in the mean ages of the iNPH and AD groups (p=0.67). There was also no significant difference in the genders of the three groups.
| Characteristics |
Control
(n=10) |
iNPH
(n=10) |
Alzheimer’s disease (n=10) |
| Age (years ± SD) |
59 ± 7.4 |
74.4 ± 8.5 |
77.1 ± 4.6 |
| Gender male: female |
6:4 |
6:4 |
5:5 |
| Evans’ index |
0.25 ± 0.02 |
0.33 ± 0.04 |
0.28 ± 0.02 |
| Vascular risk factors |
| Hypertension (number of patients) |
1 |
7 |
8 |
| Diabetes mellitus (number of patients) |
0 |
4 |
3 |
| Dyslipidemia (number of patients) |
3 |
6 |
8 |
Table 1: Demographic and clinical data of control subjects and of iNPH and Alzheimer’s disease patients.
The vascular risk factors were recorded. The incidence of hypertension in the control group was statistically significantly lower than in the iNPH and AD groups (p<0.01), but there was no significant difference between the iNPH and AD groups (p=0.63). The incidence of diabetes mellitus was statistically significantly lower in the control group than in the iNPH group (p=0.03), but there was a significant difference between the AD group and both the control group (p=0.07) and the iNPH group (p=0.66).
There was a statistically significant lower incidence of dyslipidemia in the control group than in the Alzheimer's disease group (p=0.02). In contrast, there was no significant difference between the control and the iNPH groups (p=0.12), and between the iNPH and the AD groups (p=0.36).
The Evan’s index of all of the control and Alzheimer’s disease subjects did not exceed 0.3. Almost all iNPH patients had an Evan’s index more than 0.3. The only iNPH patient who had a lower Evan’s index (0.29) presented with gait disturbance and urinary incontinence; this patient had shown clinical improvement after a tap test and had been diagnosed as probable iNPH. Seven patients had improved clinically after a ventriculostomy shunt and had been diagnosed as definite iNPH. Another two patients were diagnosed with possible iNPH.
The derived DTI parameters from the tract-specific analysis of the tractography of the fornix are demonstrated at Table 2 and Figure 3. The mean FA of the control group was significantly higher than those of both the iNPH group (p<0.001) and the Alzheimer’s group (p=0.01). Although the mean FA of the iNPH group was lower than that of the Alzheimer’s group, there was no statistical significance (p=0.266).
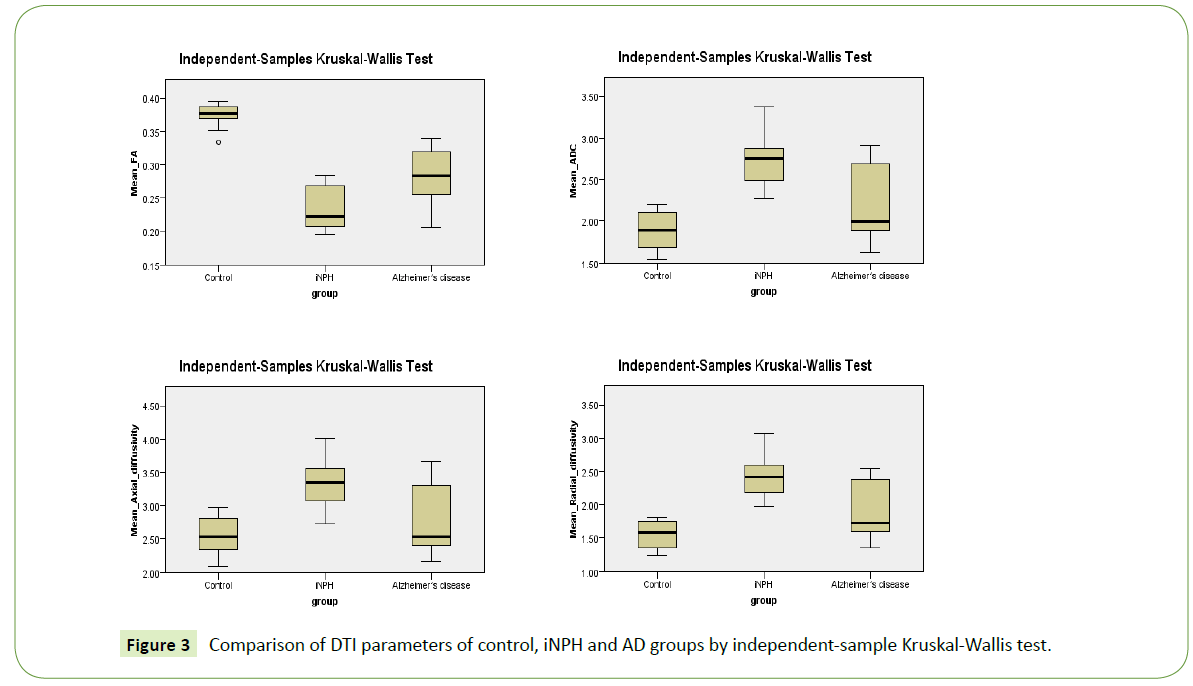
Figure 3: Comparison of DTI parameters of control, iNPH and AD groups by independent-sample Kruskal-Wallis test.
| Parameter |
Control
(n=10) |
iNPH
(n=10) |
AD
(n=10) |
p-value* |
| Control vs. iNPH |
Control vs. Alzheimer’s disease |
iNPH vs. Alzheimer’s disease |
| Mean FA |
0.3746 ± 0.01943 |
0.2322 ± 0.03334 |
0.2849 ± 0.03968 |
<0.001† |
0.010† |
0.266 |
| Mean ADC |
1.8896 ± 0.23707 |
2.7067 ± 0.33466 |
2.1917 ± 0.44779 |
0.001† |
0.535 |
0.047† |
| Mean axial diffusivity |
2.5459 ± 0.30622 |
3.3047 ± 0.37428 |
2.7773 ± 0.50424 |
0.003† |
1.000 |
0.058 |
| Mean radial diffusivity |
1.5615 ± 0.20473 |
2.4077 ± 0.31974 |
1.8989 ± 0.42186 |
<0.001† |
0.364 |
0.051 |
Data are shown as mean ± SD
Mean ADC, axial and radial diffusivity are shown in 10-3 mm2/s
*p-value from the Kruskal-Wallis test; †Statistical difference, p<0.05
Table 2: Tract-specific analysis of tractography of the fornix.
The mean ADC of the control group was significantly lower than that of the iNPH group (p < 0.001). The mean ADC of the iNPH group was significantly higher than that of the Alzheimer’s group (p=0.047). There was no significant difference in the mean ADC of the control and AD groups (p=0.535).
There were statistically significant higher mean axial and radial diffusivities for the iNPH group than the control group (p=0.003 and p<0.001, respectively). However, there were no significant differences in the mean axial and radial diffusivities of the control and the AD groups, or of the iNPH and the AD groups (p>0.05).
The interobserver reliability was excellent for all of the DTI parameters, with a kappa score of 0.958 for the mean FA, 0.898 for the mean ADC, 0.877 for the mean axial diffusivity, and 0.909 for the mean radial diffusivity.
Discussion
The fornix is a part of the Papez circuit and plays an important role in the memory function. In this study, we intended to explore microstructural changes in the fornix and the possibility of using DTI parameters as a supportive tool to differentiate AD from iNPH patients.
Many studies have described the microstructural changes in the fornix of AD and mild cognitive impaired patients (MCI) by using various methods of DTI and tractography. However, only a few studies have used DTI techniques to differentiate iNPH and AD patients. Hong et al. [11], revealed a significantly lower mean FA of the hippocampus of AD and iNPH subjects than of normal, healthy, control subjects, and a significantly lower mean FA of the hippocampus of AD than iNPH subjects. Hattori et al. [23], reported a significantly higher FA value and axial eigenvalue of the corticospinal tract for iNPH subjects than for AD and normal control groups. Kim et al. [12], also revealed a significantly higher FA value of the posterior limb of the internal capsule for the iNPH group than the AD and normal control groups. Hattori et al. [24], showed a significantly decreased FA value of the fornix for the iNPH and AD groups than for the normal control group, but there was no significant difference between the values for the iNPH and AD groups. Furthermore, the antero-posterior directional stretching of the fornix was also described with a significantly lower tract volume for iNPH subjects than for subjects in the AD and normal control groups.
In our study, the lower values for the mean FA of the fornices of iNPH and AD patients than the values of normal control subjects were concordant with a study by Hattori et al. [24]. The decreasing mean FA value of the AD group may be explained by axonal degeneration of the fornix, being the efferent white matter tract from the hippocampus [7]. However, and in contrast with the fall in FA values arising from mechanical compression (as found in the corticospinal tract of iNPH patients, and as reported in previous studies [12,23]), the mean FA values of the fornices of both iNPH and AD patients might reasonably be expected to rise due to the stretching of the fornices resulting from enlarged ventricles. On the other hand, the fornix and the corticospinal tracts are probably inherently different in nature in that the prolonged mechanical pressures on the fornix, caused by enlarged ventricles, likely lead to chronic ischemic changes, axonal loss, interstitial edema or gliosis changes of the fornix fibers, resulting in the decreased FA values described in our study which was in line with previous report [24].
The significantly higher, mean axial diffusivity found among subjects in the iNPH group than in the control group could be explained by the white matter tract stretching. For describing the possible pathogenesis, previous study [23] also revealed increased axial diffusivity in the corticospinal tract which was also stretched in iNPH that could probably described the same mechanism in our finding of increased axial diffusivity in the fornix. As for the AD patients, we assumed that the mean axial diffusivity of the AD group should be lower than that of the control group, but the results revealed a trend of a slightly higher value. This could not be explained by the axonal degeneration mechanism alone.
As the mean radial diffusivity represents myelin integrity [25,26], a higher value for the iNPH and AD groups than for the control group probably demonstrated myelin destruction. Furthermore, a trend of a higher mean radial diffusivity for the iNPH group than for the AD group might be due to a more severe degree of compromised myelin integrity among the iNPH subjects, whereas among the AD patients, demyelination may probably occur after severe axonal loss. However, a previous study of ADlike pathology in mice showed histopathological changes in both the axon and the myelin, yet the DTI parameters demonstrated a significant increase only in the radial diffusivity, with the axial diffusivity still preserved [27]. Therefore, a future human study on AD pathology should be performed for this aspect of imaginghistological correlation.
In order to differentiate iNPH from AD, diagnostic performance, including sensitivity, specificity, PPV and NPV, is demonstrated at Table 3. There were equal diagnostic performances when using a mean ADC of 2.1508, or a mean axial diffusivity of 2.6708, or a mean radial diffusivity of 1.8596, as the threshold values, with a diagnostic accuracy of 80%, a sensitivity of 100%, a specificity of 60%, a PPV of 71.4% and an NPV of 100%. When using a mean FA of 0.2467 as the threshold value, the diagnostic accuracy was 80%, with a sensitivity of 90%, a specificity of 70%, a PPV of 75% and an NPV of 87.5%. However, only the mean ADC of the iNPH group was significantly higher than that of the Alzheimer’s group (p=0.047).
| Variable |
Cutoff Value |
Sensitivity |
Specificity |
PPV |
NPV |
Accuracy |
AUC |
| Mean FA |
0.2467 |
90 |
70 |
75 |
87.5 |
80 |
0.830 |
| 0.2557 |
80 |
70 |
72.7 |
77.8 |
75 |
| 0.2730 |
70 |
80 |
77.8 |
72.7 |
75 |
| Mean ADC |
2.1508 |
100 |
60 |
71.4 |
100 |
80 |
0.810 |
| 2.4098 |
80 |
70 |
72.7 |
77.8 |
75 |
| Mean axial diffusivity |
2.6708 |
100 |
60 |
71.4 |
100 |
80 |
0.790 |
| 3.0199 |
80 |
70 |
72.7 |
77.8 |
75 |
| Mean radial diffusivity |
1.8596 |
100 |
60 |
71.4 |
100 |
80 |
0.830 |
| 2.0230 |
90 |
70 |
75 |
87.5 |
70 |
Table 3: Threshold values and diagnostic discrimination between iNPH and AD groups.
iNPH is one of the few, treatable causes of dementia. The symptoms of iNPH patients can be improved with surgical placement of a CSF shunt (cerebrospinal fluid shunt), and should not be misinterpreted as due to other causes, such as AD. Therefore, we need a diagnostic tool with high sensitivity and NPV to identify iNPH patients. From our results, the mean ADC is probably the most helpful parameter to discriminate iNPH from AD patients.
Interobserver reliability was excellent in all DTI parameters in our results, may be from the ease to recognize by color changing of the DTI parameter at the ROI. These are helpful because the reproducibility of the DTI method for analysis the fornix can be done with effectiveness.
There were some limitations of the study. The first was its small sample size. The second was the possibility of introducing technical errors or inherent differences in DTI values as a result of using two, different MRI machines, notwithstanding that almost the same DTI protocols were provided by the same vendor. The third limitation was the control group, which was not precisely age-matched with the two diseased groups, and did not undergo full cognitive tests, as did the subjects of the iNPH and AD groups. Another limitation was that we did not evaluate the severity of the diseases and the duration of their symptoms; that may have impacted on the white matter integrity. Finally, some previous research studies examined the DTI parameters by using a different method of post-processing analysis [23,28]; therefore, there are some limitations when making direct comparisons with our results.
Conclusion
Our study revealed different microstructural changes in the fornices of iNPH and Alzheimer’s patients evident through differences in their DTI parameters, which probably result from a different pathogenesis of each disease. Overall, our study demonstrated the possibility of using DTI parameters as a supportive tool to discriminate between iNPH and AD patients with high sensitivity and NPV.
Acknowledgements
This research project was supported by the Faculty of Medicine, Siriraj Hospital, Mahidol University (Grant Number R015831056). The authors were funded by a Chalermphakiat Grant from the Faculty of Medicine, Siriraj Hospital, Mahidol University.
The authors thank Mrs. Angkana Jongsawaddipatana and all staff members of the primary care unit of Siriraj Hospital for their contribution to data collection.
24096
References
- Thomas AG, Koumellis P, Dineen RA (2011) The fornix in health and disease: An imaging review. Radiographics 31: 1107-1121.
- Mark LP, Daniels DL, Naidich TP (1993) The fornix. AJNR Am J Neuroradiol 14: 1355-1358.
- Papez JW (1995) A proposed mechanism of emotion. J Neuropsychiatry Clin Neurosci 7: 103-112.
- Aggleton JP, Brown MW (1999) Episodic memory, amnesia, and the hippocampal-anterior thalamic axis. Behav Brain Sci 22: 425-444.
- Bozoki AC, Korolev IO, Davis NC, Hoisington LA, Berger KL (2012) Disruption of limbic white matter pathways in mild cognitive impairment and Alzheimer's disease: A DTI/FDG-PET study. Hum Brain Mapp 33: 1792-1802.
- Nowrangi MA, Rosenberg PB (2015) The fornix in mild cognitive impairment and Alzheimer's disease. Front Aging Neurosci 7: 1.
- Kantarci K (2014) Fractional anisotropy of the fornix and hippocampal atrophy in Alzheimer's disease. Front Aging Neurosci 6: 316.
- Mielke MM, Okonkwo OC, Oishi K, Mori S, Tighe S, et al. (2012) Fornix integrity and hippocampal volume predict memory decline and progression to Alzheimer's disease. Alzheimers Dement 8: 105-113.
- Oishi K, Lyketsos CG (2014) Alzheimer's disease and the fornix. Front Aging Neurosci 6: 241.
- Hakim S, Adams RD (1965) The special clinical problem of symptomatic hydrocephalus with normal cerebrospinal fluid pressure: Observations on cerebrospinal fluid hydrodynamics. J Neurol Sci 2: 307-327.
- Hong YJ, Yoon B, Shim YS, Cho AH, Lim SC, et al. (2010) Differences in microstructural alterations of the hippocampus in Alzheimer disease and idiopathic normal pressure hydrocephalus: A diffusion tensor imaging study. AJNR Am J Neuroradiol 31: 1867-1872.
- Kim MJ, Seo SW, Lee KM, Kim ST, Lee JI, et al. (2011) Differential diagnosis of idiopathic normal pressure hydrocephalus from other dementias using diffusion tensor imaging. AJNR Am J Neuroradiol 32: 1496-1503.
- Chawalparit O, Manochiopinig S, Vichianin Y, Wongsripuemtet J, Siwasattayanon P, et al. (2015) Siriraj Thai language paradigm for functional MRI: A pilot study in normal volunteers. Siriraj Med J 67: 181-186.
- Mori E, Ishikawa M, Kato T, Kazui H, Miyake H, et al. (2012) Guidelines for management of idiopathic normal pressure hydrocephalus: Second edition. Neurol Med Chir (Tokyo) 52: 775-809.
- McKhann GM, Knopman DS, Chertkow H, Hyman BT, Jack CR, et al. (2011) The diagnosis of dementia due to Alzheimer's disease: Recommendations from the National Institute on Aging-Alzheimer's Association workgroups on diagnostic guidelines for Alzheimer's disease. Alzheimers Dement 7: 263-269.
- Fazekas F, Chawluk JB, Alavi A, Hurtig HI, Zimmerman RA (1987) MR signal abnormalities at 1.5 T in Alzheimer's dementia and normal aging. AJR Am J Roentgenol 149: 351-356.
- Yeh FC, Verstynen TD, Wang Y, Fernandez-Miranda JC, Tseng WY (2013) Deterministic diffusion fiber tracking improved by quantitative anisotropy. PLoS One 8: e80713.
- Concha L, Gross DW, Beaulieu C (2005) Diffusion tensor tractography of the limbic system. AJNR Am J Neuroradiol 26: 2267-2274.
- Fitzsimmons J, Kubicki M, Smith K, Bushell G, Estepar RS, et al. (2009) Diffusion tractography of the fornix in schizophrenia. Schizophr Res 107: 39-46.
- Sboto-Frankenstein UN, Lazar T, Bolster RB, Thind S, De-Gervai DP, et al. (2014) Symmetry of the fornix using diffusion tensor imaging. J Magn Reson Imaging 40: 929-936.
- Yeo SS, Seo JP, Kwon YH, Jang SH (2013) Pre-commissural fornix in the human brain: A diffusion tensor tractography study. Yonsei Med J 54: 315-320.
- Zahr NM, Rohlfing T, Pfefferbaum A, Sullivan EV (2009) Problem solving, working memory, and motor correlates of association and commissural fiber bundles in normal aging: A quantitative fiber tracking study. Neuroimage 44: 1050-1062.
- Hattori T, Yuasa T, Aoki S, Sato R, Sawaura H, et al. (2011) Altered microstructure in corticospinal tract in idiopathic normal pressure hydrocephalus: Comparison with Alzheimer disease and Parkinson disease with dementia. AJNR Am J Neuroradiol 32: 1681-1687.
- Hattori T, Sato R, Aoki S, Yuasa T, Mizusawa H (2012) Different patterns of fornix damage in idiopathic normal pressure hydrocephalus and Alzheimer disease. AJNR Am J Neuroradiol 33: 274-279.
- Song SK, Sun SW, Ju WK, Lin SJ, Cross AH, et al. (2003) Diffusion tensor imaging detects and differentiates axon and myelin degeneration in mouse optic nerve after retinal ischemia. Neuroimage 20: 1714-1722.
- Song SK, Sun SW, Ramsbottom MJ, Chang C, Russell J, et al. (2002) Dysmyelination revealed through MRI as increased radial (but unchanged axial) diffusion of water. Neuroimage 17: 1429-1436.
- Song SK, Kim JH, Lin SJ, Brendza RP, Holtzman DM (2004) Diffusion tensor imaging detects age-dependent white matter changes in a transgenic mouse model with amyloid deposition. Neurobiol Dis 15: 640-647.
- Hattori T, Ito K, Aoki S, Yuasa T, Sato R, et al. (2012) White matter alteration in idiopathic normal pressure hydrocephalus: Tract-based spatial statistics study. AJNR Am J Neuroradiol 33: 97-103.