Keywords
ACTs, Correlation coefficient, Minilab, Price, Quality
Introduction
The quality of medicinal drugs in many less-developed countries is inadequate in some cases, use of poor-quality medicines has resulted in treatment failure[1]. The poor quality of drugs has been linked to counterfeiting of medicines[2] chemical instability especially in tropical climates[3] and poor quality control during manufacture[4]. Hard to find is a study that has actually investigated the quality of drugs as a determinant of their market prices. The artemisinins are increasingly being used because of their effectiveness against multi-drug resistant malaria. Artemether (ATM), artesunate (ART) and dihydroartemisinin are derived form the natural product artemisinin. An investigation into the sale of counterfeit drugs in 1999 shows the distribution of counterfeit artesunate tablets in south-east Asia was becoming frequent. Initial testing has shown that 38% of artesunate tablets tested in south-east Asia contained no active ingredients[5]. These drugs have not only been limited to the south-east Asia where they are manufactured but have found their way into other malaria endemic countries like Nigeria.
The economic situation in Nigeria influences the control and treatment of malaria and the choice of use of anti-malarial drugs. The Nigerian pharmaceutical market obtains these drugs from south-east Asian countries where availability and cost of labour is relatively cheap and counterfeiting is on the increase. It would appear that some pharmaceutical marketers procure drugs irrespective of their quality, since the marketers themselves and regulatory bodies do not have well structured quality control systems.
ACTs are relatively expensive when compared with treatment of malaria with chloroquine. The cost of treating a chloroquine sensitive malaria infection with chloroquine could be as slow as 30 cents compared to ACT of between $1 and $33.5.
Following WHO’s recommendation for member states, where malaria is endemic to adopt the artemisinin combination policy to combat the obvious wide spread of resistance of malaria parasite to chloroquine, Nigeria adopted a treatment guideline on malaria treatment with the use of ACT’s as a central focus. A number of other African countries also did the same[6]. Several authors[7]. have written on the economic impact of this policy. In Nigeria the adoption of ACT’s have led to about five fold increament in the treatment of malaria. With the use of chloroquine, an adult malaria case could be treated with as low as N200 ($1.67) but the adoption of ACT’s that same malaria treatment would cost between N500 ($4.3) and N 1,200 ($10).
In Nigeria like most African countries the cost of medicines is not regulated. Difference in the prices within cities and intercity vary greatly. Pricing policy have been developed by the various Ministries of Health or their agents in collaboration with the country’s WHO representatives offices of the various countries.
This project was intended to investigate the relationship between price and cost of ACT’s and their quality as determined using the German Pharma Health Fund (GPHF) minilab concept. Consequently the following hypothesis were proposed
Hypothesis I
Expensive ACT’s are of high quality with respect to quality and quantity of the ACT
Hypothesis II
A simple statistical correlation could be established between price or cost and quality of ACTs
Materials and Methods
Chemicals and reagents:
Analytical grades of methanol, sulphuric acid 96%, Iodine crystals, Acetone, Ethyl acetate, glacial acetic acid, toluene, authentic reference standards of artesunate and Artemether were all gotten from Global Pharma Health Fund (GPHF).Sample drugs were procured from both private and public drug outlets in Nigeria
Equipment:
Pestle, Aluminium foil, laboratory glass bottles with a filling capacity of 25 to 100 ml, funnel, set of straight pipettes (1 to 25 ml), 10 ml vials, merck TLC aluminium plates pre-coated with silica gel 60F254, size 5 × 10 cm, glass microcapillaries of 2 µl filing capacity, Hot plate, TLC developing chamber, filter paper, pair of scissors, pair of tweezers, UV light of 254nm, Iodine chamber, TLC dipping chamber (petri-dish).
Study sites:
Five cities were selected on the basis of their serving as the main centres for drug distribution in Nigeria thus, any ACT found elsewhere in the country is most likely to have emanated from any of the five cities. The selected study sites were: Lagos in the south-west zone, Onitsha in the south-east zone, Kano in the north-west zone, Jos in the north central zone and Calabar in the south-south zone of Nigeria.
Sampling procedures and sample size:
Due to the limited availability of medicines in public sector, sampling was first carried out in the public establishments before the private sector, to ensure adequate coverage of the sectors. In all seventy (70) samples were procured at the different outlets in the five cities bringing the average of the samples per city to fourteen (14) with a standard deviation of 9.5.
Quality Tests Performed
The GPHF minilab concept[8] was applied to all samples. This included the following major tests: labelling, visual inspection, simple disintegration and thin layer chromatographic analysis. Under the labelling requirements, parameters such as brand, generic names, dosage form, batch numbers, name and address of manufacturer, manufacturing and expiry dates as well as storage conditions were evaluated. Visual inspection of the dosage form parameter included, shape, uniformity of shape and colour, physical damage and presence or otherwise of foreign contaminants, marks etc.
Verification of identity and drug content using thin layer chromatography (TLC)
The TLC tests developed by USP/USAID for the survey of the quality of some selected Antimalarial medicines in Africa was used for this purpose[9].
Statistical analysis:
In an attempt to carry out a simple statistical evaluation of the tests and to be able to correlate it to quality, we assigned some arbitrary numbers based on how we perceived the severity and importance of the quality parameter as indicated below.
Compliance with any of the above tests gave full score of +10 while non-compliance gave -10. The results gotten (table I and Table II) were used for the following statistical computation.
Price-quality correlation coefficient: All other factors of determinants of price variations like variation in strengths of active ingredients and differences in price as a result of location were eliminated. The prices of 18 brands of Artesunate of the same strength were plotted against their total drug scores (fig 1) using the SPSS and their Pearson correlation coefficient computed. Likewise, the prices of 18 brands of Artemether of the same strength were plotted against their total drug scores (fig 2) using the SPSS and their Pearson correlation coefficient computed.
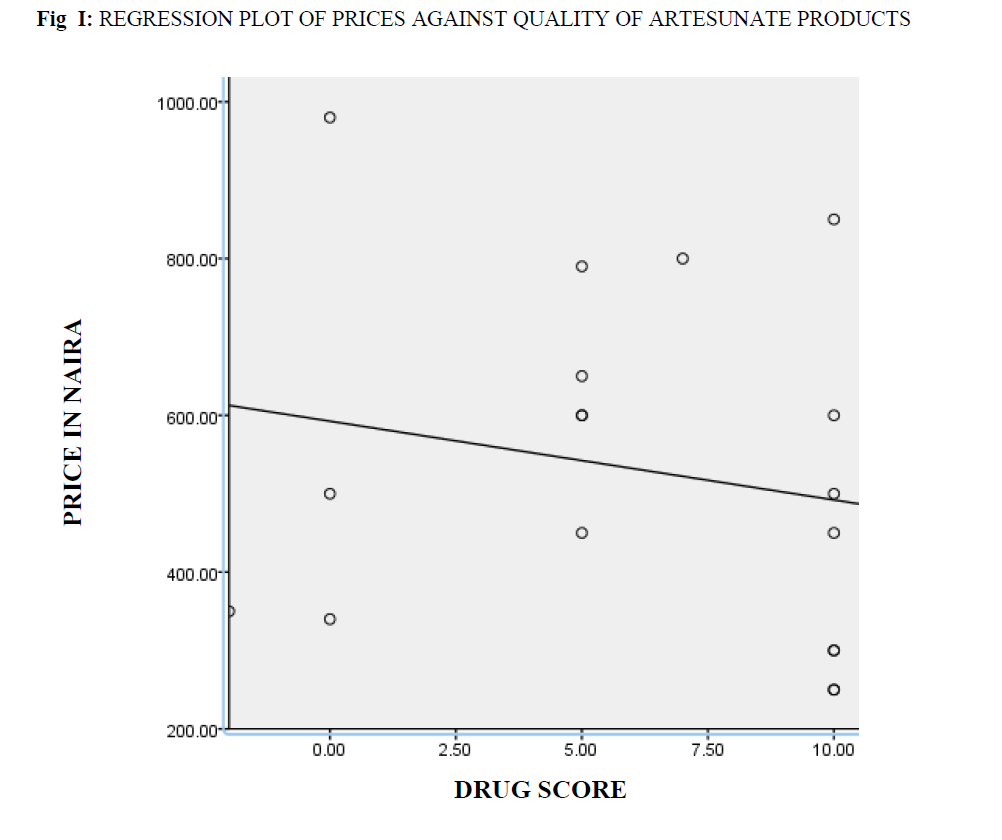
Fig I: Regression Plot Of Prices Against Quality Of Artesunate Products.
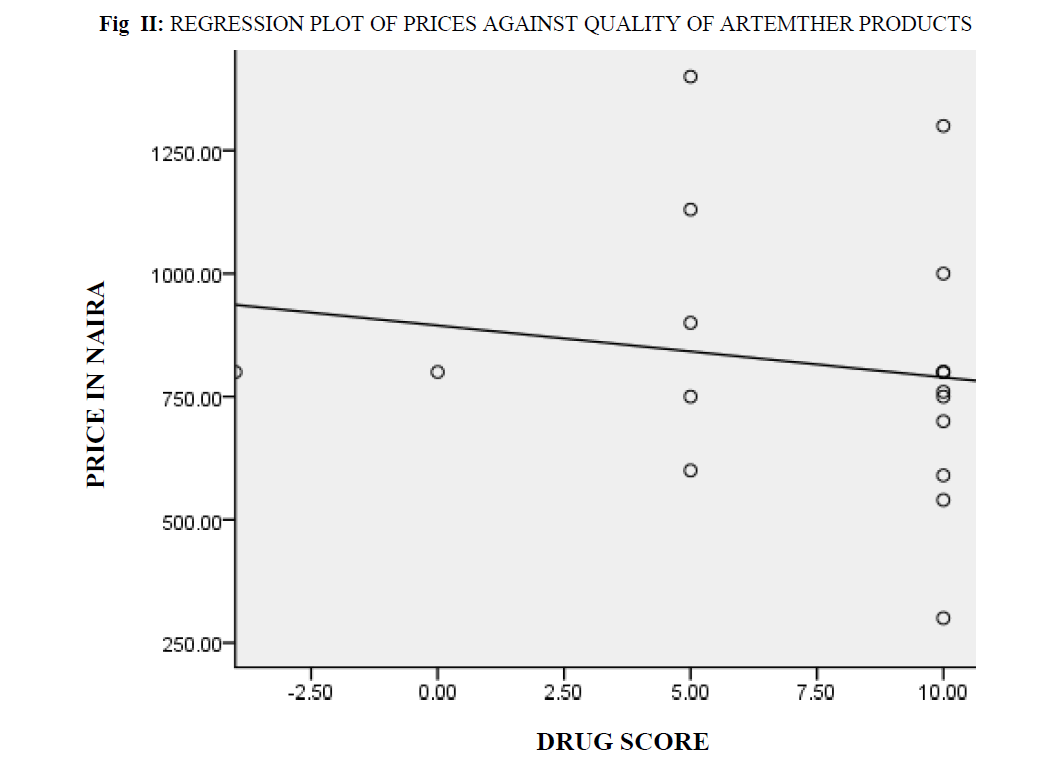
Fig II: Regression Plot Of Prices Against Quality Of Artemther Products
Results
Out of the total of 70 samples, 31(44.3%) failed (table I and table II), i.e. they did not comply with WHO specifications. However, the percentage failure across the five study sites are as follows: Calabar 42.9%, Jos 40.0%, Kano 43.8%, Lagos 51.7% and Onitsha 30.8%. 2 of the samples were found to be completely devoid of the active ingredient (fig 3). By WHO categorization counterfeit ACTs of fake packaging + correct quantity of correct ingredients constituted 1.4%, fake packaging + incorrect quantity of correct ingredient 1.4%, genuine packaging + incorrect quantity of ingredient (less than 80%) constituted 25.7%. Counterfeit ACTs stood at 31.4% while substandard ACTs constituted 12.9% and genuine ACTs 55.7% (table III).
| S/N |
LOCATION |
L |
V |
D |
Q |
A |
C |
DRUG SCORE |
STATUS |
| 1 |
Onitsha |
0.5 |
1.0 |
1.5 |
2.5 |
2 |
2.5 |
10 |
Pass |
| 2 |
Lagos |
0.5 |
1.0 |
1.5 |
2.5 |
2 |
2.5 |
10 |
Pass |
| 3 |
Kano |
0.5 |
1.0 |
1.5 |
2.5 |
2 |
2.5 |
10 |
Pass |
| 4 |
Lagos |
0.5 |
1.0 |
1.5 |
-2.5 |
2 |
2.5 |
5 |
Fail |
| 5 |
Onitsha |
0.5 |
1.0 |
1.5 |
2.5 |
2 |
2.5 |
10 |
Pass |
| 6 |
Kano |
0.5 |
1.0 |
1.5 |
2.5 |
2 |
2.5 |
10 |
Pass |
| 7 |
Lagos |
0.5 |
1.0 |
1.5 |
-2.5 |
2 |
2.5 |
5 |
Fail |
| 8 |
Lagos |
0.5 |
1.0 |
1.5 |
2.5 |
2 |
2.5 |
10 |
Pass |
| 9 |
Onitsha |
0.5 |
1.0 |
1.5 |
2.5 |
2 |
2.5 |
10 |
Pass |
| 10 |
Lagos |
0.5 |
1.0 |
1.5 |
-2.5 |
-2 |
2.5 |
1 |
Fail |
| 11 |
Lagos |
0.5 |
1.0 |
1.5 |
2.5 |
2 |
2.5 |
10 |
Pass |
| 12 |
Kano |
0.5 |
1.0 |
1.5 |
2.5 |
2 |
2.5 |
10 |
Pass |
| 13 |
Lagos |
0.5 |
1.0 |
1.5 |
2.5 |
2 |
-2.5 |
5 |
Fail |
| 14 |
Kano |
0.5 |
1.0 |
1.5 |
2.5 |
2 |
2.5 |
10 |
Pass |
| 15 |
Kano |
0.5 |
1.0 |
1.5 |
2.5 |
2 |
-2.5 |
5 |
Fail |
| 16 |
Onitsha |
0.5 |
1.0 |
1.5 |
2.5 |
2 |
2.5 |
10 |
Pass |
| 17 |
Onitsha |
0.5 |
-1.0 |
1.5 |
-2.5 |
2 |
-2.5 |
-2 |
Fail |
| 18 |
Jos |
0.5 |
1.0 |
1.5 |
2.5 |
2 |
2.5 |
10 |
Pass |
| 19 |
Kano |
0.5 |
1.0 |
-1.5 |
2.5 |
2 |
2.5 |
7 |
Fail |
| 20 |
Lagos |
0.5 |
1.0 |
1.5 |
2.5 |
2 |
-2.5 |
5 |
Fail |
| 21 |
Lagos |
0.5 |
1.0 |
1.5 |
2.5 |
2 |
-2.5 |
5 |
Fail |
| 22 |
Jos |
0.5 |
1.0 |
1.5 |
-2.5 |
2 |
-2.5 |
0 |
Fail |
| 23 |
Lagos |
0.5 |
1.0 |
1.5 |
2.5 |
2 |
-2.5 |
5 |
Fail |
| 24 |
Kano |
0.5 |
1.0 |
1.5 |
2.5 |
2 |
2.5 |
10 |
Pass |
| 25 |
Calabar |
0.5 |
1.0 |
1.5 |
2.5 |
2 |
-2.5 |
5 |
Fail |
| 26 |
Lagos |
0.5 |
1.0 |
1.5 |
2.5 |
2 |
2.5 |
10 |
Pass |
| 27 |
Jos |
0.5 |
1.0 |
1.5 |
2.5 |
2 |
2.5 |
10 |
Pass |
| 28 |
Calabar |
0.5 |
1.0 |
1.5 |
-2.5 |
2 |
-2.5 |
0 |
Fail |
| 29 |
Lagos |
0.5 |
1.0 |
1.5 |
-2.5 |
2 |
-2.5 |
0 |
Fail |
| 30 |
Lagos |
0.5 |
1.0 |
1.5 |
2.5 |
2 |
2.5 |
10 |
Pass |
| 31 |
Lagos |
0.5 |
1.0 |
1.5 |
2.5 |
2 |
2.5 |
10 |
Pass |
| 32 |
Lagos |
0.5 |
1.0 |
1.5 |
2.5 |
2 |
-2.5 |
5 |
Fail |
| 33 |
Kano |
0.5 |
1.0 |
1.5 |
2.5 |
2 |
-2.5 |
5 |
Fail |
| 34 |
Kano |
0.5 |
1.0 |
1.5 |
2.5 |
2 |
-2.5 |
5 |
Fail |
| 35 |
Lagos |
0.5 |
1.0 |
1.5 |
2.5 |
2 |
2.5 |
10 |
Pass |
| 36 |
Lagos |
0.5 |
-1.0 |
1.5 |
2.5 |
2 |
-2.5 |
3 |
Fail |
| 37 |
Kano |
0.5 |
1.0 |
1.5 |
-2.5 |
2 |
-2.5 |
0 |
Fail |
| 38 |
Kano |
0.5 |
1.0 |
1.5 |
-2.5 |
2 |
2.5 |
5 |
Fail |
| 39 |
Calabar |
0.5 |
1.0 |
1.5 |
2.5 |
2 |
-2.5 |
5 |
Fail |
| 40 |
Lagos |
0.5 |
1.0 |
1.5 |
2.5 |
2 |
2.5 |
10 |
Pass |
| 41 |
Lagos |
0.5 |
1.0 |
1.5 |
2.5 |
2 |
2.5 |
10 |
Pass |
| 42 |
Lagos |
0.5 |
1.0 |
1.5 |
2.5 |
2 |
-2.5 |
5 |
Fail |
Table I: Quality Assessments For Selected Artesunate Samples

Fig III: Photographs Of The Tlc Plates Of Artesunate Samples
| S/N |
LOCATION |
L |
V |
D |
Q |
A |
C |
DRUG SCORE |
STATUS |
| 1 |
Lagos |
0.5 |
1.0 |
1.5 |
2.5 |
2 |
2.5 |
10 |
Pass |
| 2 |
Lagos |
0.5 |
1.0 |
1.5 |
2.5 |
2 |
2.5 |
10 |
Pass |
| 3 |
Kano |
0.5 |
1.0 |
1.5 |
2.5 |
2 |
2.5 |
10 |
Pass |
| 4 |
Onitsha |
0.5 |
1.0 |
1.5 |
2.5 |
2 |
2.5 |
10 |
Pass |
| 5 |
Lagos |
0.5 |
1.0 |
1.5 |
-2.5 |
2 |
2.5 |
5 |
Fail |
| 6 |
Lagos |
0.5 |
1.0 |
1.5 |
2.5 |
2 |
2.5 |
10 |
Pass |
| 7 |
Lagos |
0.5 |
1.0 |
1.5 |
2.5 |
2 |
2.5 |
10 |
Pass |
| 8 |
Lagos |
0.5 |
1.0 |
1.5 |
-2.5 |
2 |
2.5 |
5 |
Fail |
| 9 |
Calabar |
0.5 |
1.0 |
1.5 |
2.5 |
2 |
2.5 |
10 |
Pass |
| 10 |
Lagos |
0.5 |
1.0 |
1.5 |
2.5 |
2 |
2.5 |
10 |
Pass |
| 11 |
Lagos |
0.5 |
1.0 |
1.5 |
2.5 |
2 |
2.5 |
10 |
Pass |
| 12 |
Kano |
0.5 |
1.0 |
1.5 |
2.5 |
2 |
2.5 |
10 |
Pass |
| 13 |
Lagos |
0.5 |
1.0 |
1.5 |
2.5 |
2 |
2.5 |
10 |
Pass |
| 14 |
Lagos |
0.5 |
1.0 |
1.5 |
2.5 |
2 |
2.5 |
10 |
Pass |
| 15 |
Jos |
0.5 |
1.0 |
1.5 |
-2.5 |
2 |
-2.5 |
0 |
Fail |
| 16 |
Lagos |
0.5 |
1.0 |
1.5 |
2.5 |
2 |
2.5 |
10 |
Pass |
| 17 |
Calabar |
0.5 |
1.0 |
1.5 |
2.5 |
2 |
2.5 |
10 |
Pass |
| 18 |
Lagos |
0.5 |
1.0 |
1.5 |
-2.5 |
2 |
2.5 |
5 |
Fail |
| 19 |
Lagos |
0.5 |
1.0 |
1.5 |
-2.5 |
2 |
2.5 |
5 |
Fail |
| 20 |
Onitsha |
0.5 |
1.0 |
1.5 |
2.5 |
2 |
2.5 |
10 |
Pass |
| 21 |
Lagos |
0.5 |
1.0 |
1.5 |
-2.5 |
-2 |
-2.5 |
-4 |
Fail |
| 22 |
Lagos |
0.5 |
1.0 |
1.5 |
2.5 |
2 |
2.5 |
10 |
Pass |
| 23 |
Onitsha |
0.5 |
1.0 |
1.5 |
-2.5 |
2 |
2.5 |
5 |
Fail |
| 24 |
Onitsha |
0.5 |
1.0 |
1.5 |
-2.5 |
2 |
2.5 |
5 |
Fail |
| 25 |
Lagos |
0.5 |
1.0 |
1.5 |
-2.5 |
2 |
2.5 |
5 |
Fail |
| 26 |
Kano |
0.5 |
1.0 |
1.5 |
2.5 |
2 |
2.5 |
10 |
Pass |
| 27 |
Jos |
0.5 |
1.0 |
1.5 |
2.5 |
2 |
2.5 |
10 |
Pass |
| 28 |
Onitsha |
0.5 |
1.0 |
1.5 |
2.5 |
2 |
2.5 |
10 |
Pass |
L = Labelling V = Visual Inspection D = Disintegration Test Q = Quantity of Active Ingredient A = Presence of Active Ingredient C = Contaminants.
Table II: Quality Assessments For Selected Artemether Samples.
| S/N |
Description |
Category |
Total
found |
Percentage
(%) |
| 1 |
Fake packaging + wrong ingredient |
Counterfeit |
0 |
0 |
| 2 |
Fake packaging + no active ingredient |
Counterfeit |
0 |
0 |
| 3 |
Genuine packaging + wrong ingredient |
Counterfeit |
0 |
0 |
| 4 |
Genuine packaging + no ingredient (deliberate) |
Counterfeit |
2 |
2.9 |
| 5 |
Fake packaging + correct quantity of correct ingredient |
Counterfeit |
1 |
1.4 |
| 6 |
Fake packaging + incorrect quantity of correct ingredient |
Counterfeit |
1 |
1.4 |
| 7 |
Genuine packaging + incorrect quantity of
ingredient(deliberate) less than 80% |
Counterfeit |
18 |
25.7 |
| 8 |
Substandard: genuine packaging + incorrect quantity of
ingredient (not deliberate) including disintegration test failure |
Substandard |
9 |
12.9 |
| 9 |
Genuine product with genuine packaging + correct quantity of
ingredient |
Genuine |
39 |
55.7 |
Table III: Quality Of The Medicines By Who Categorization.
The square of the Pearson’s price – quality correlation coefficients gotten were 0.038 for preparations containing Artesunate (fig 1) and 0.027 for preparations containing Artemether (fig 2). On hypothesis testing the calculated t-value for low and high quality Artesunate was 0.00013 while tabulated t-value was 2.120 at P=0.05, that of Artemether was 0.00020 and tabulated 2.120 at P=0.05.
Discussion
Our findings confirmed that there is a high rate of substandard ACTs being supplied into Nigerian markets. The relatively low failure rate of samples gotten from Onitsha market is attributable to the effort made by the National Agency for Food and Drug Administration and Control (NAFDAC) to sanitize the market. The high level of contamination revealed could be as a result of degradation of the active ingredient since the contaminants have the same retention factor or deliberate adulteration by manufacturers as cultivated A.annua plants produce the best yields of artemisinin (about 2% [dry weight]); yields from the wild, range from 0.06 to 0.5%, depending on the variety of A.annua used[10] which is very low therefore the tendency for adulteration is high.
The Pearson’s price quality correlation coefficients gotten for Artesunate and Artemether show that there is little or no correlation between the quality of these drugs and their market prices. On hypothesis testing, in both cases the tabulated t-values were found to be higher than the calculated t-values thus, the Ho hypothesis that there is no significant difference between the prices of high quality and those of low quality ACTs in Nigeria is accepted.
Conclusion
The prices of ACTs in Nigeria do not in any way reflect their quality; to effectively ascertain the quality of any ACT procured form Nigerian market it must be subjected to some approved laboratory tests.
5364
References
- Petralanda I. Quality of antimalaria drugs and resistance to plasmodium vivax in Amazonian region. Lancet 1995; 345: 1433
- ten Ham M. Counterfeit drugs: implications for health. Adverse Drug react Toxicol Rev 1992; 11: 59-65.
- Hogerzeil HV, De Goeje MJ, Abu-Reid IO. Stability of essential drug in Sudan. Lancet 1991; 338: 754
- Arya SC. Inadvertent supply of substandard drugs. World Health Forum 1995; 16: 269
- Lon CT, Tsuyoka R, Phanouvong S, Nivanna S, Nivanna N, Sochaeat Dl. Counterfeit and substandard antimalarial drugs in Cambodia. Transactions of the royal society of tropical medicine and Hygiene. 2006; 100: 1019-1024.
- Ambrose OT, Sarah AS, Umberto DA. Pharmacovigilance of antimalarial treatment in Africa: Is it possible? Malaria journal 2006, 5:50.
- Shummay Y, Wiricheda P, Ian MH, Anne JM, Nicholas JW. Antimalarial drug resistance, Arteminisinin based combination therapy and the contribution of modelling to elucidating policy choices. Am. J. Trop. Med. Hyg, 2004, pp. 179- 186.
- Peter R, Zera M, Margareth N, Thomas L. Proficiency Testing as a tool to assess the performance of visual TLC quantitation estimates. Journal of AOAC international volume 89 issues, 2006; 1060-3271 pp 1300-1304.
- USP DQ1/DACA-Ethiopia/WHO Training Course Modules For Basic Tests and Sampling Procedure;2008 Feb 11-15.
- Meshnick SR, Taylor TE, Kamchonwongpaisan S. Artemisinin and the Antimalarial Endoperoxides: from Herbal Remedy to Targeted Chemotherapy.Microbiological Reviews 1996;pp.301-305.


