Research Article - (2025) Volume 17, Issue 1
Design and Development of the Liquisolid Compact of Gingerol Loaded Lozenges
Pradeepa R* and
Padmapreetha J
Department of Pharmaceutics, KMCH College of Pharmacy, Tamil Nadu, India
*Correspondence:
Pradeepa R, Department of Pharmaceutics, KMCH College of Pharmacy, Tamil Nadu,
India,
Email:
Received: 30-Aug-2023, Manuscript No. IJDDR-23-14043;
Editor assigned: 04-Sep-2023, Pre QC No. IJDDR-23-14043 (PQ);
Reviewed: 19-Sep-2023, QC No. IJDDR-23-14043;
Revised: 27-Dec-2024, Manuscript No. IJDDR-23-14043 (R);
Published:
03-Jan-2025
Abstract
The aim of the present work is to design and development of the liquisolid compact of gingerol loaded lozenges. The objective of this study was to increase the solubility of poorly soluble drug gingerol. The formulation characterized for drug-excipients interaction using FTIR, DSC, XRD, drug content. The drug content was also above 97.82% for the optimized formulation. The development lozenges formulation, were optimized based upon the evaluation parameters such as weight variation, hardness, friability and drug content. From the results of above evaluation studies, formulation F4 was optimized. In vitro drug release of formulation F4 had exhibit release profile of 90.08% and it had followed Higuchi model. The stability studies of the optimized formulation LF4 was also found to be satisfactory. So, this technique was to improve the aqueous solubility and bioavailability of the active ingredient.
Keywords
Liquisolid compact; Gingerol; Lozenges; Motion
sickness; Bioavailability; Solubility; Stability
Introduction
People who get carsick, seasick or airsick are experiencing motion sickness. The condition causes cold sweats, nausea and vomiting. Women and children are more prone to motion sickness, but it can affect anyone. You can take steps while traveling to reduce your risk of getting sick. Medications like the lozenges can prevent nausea. Bioavailability of a drug depends upon the drug solubility in an aqueous environment and drug permeability through lipophilic membranes. Usually only solubilized drug molecules can be absorbed by the cellular membranes to subsequently reach the site of drug action. The dissolution properties of a drug and its release from a dosage form have a basic impact on its bio-availability [1]. The poor dissolution characteristics of water insoluble drugs are major challenge for pharmaceutical scientist. Therapeutic effectiveness of a drug depends upon the bioavailability and ultimately upon the solubility of drug molecules solubility is one of the important parameter to achieve desired concentration of drug present in systemic circulation.
The dissolution rate is the rate limiting factor in drug absorption for class II (low solubility and high permeability) and class IV (low solubility and low permeability) drugs as defined in the Bio Pharmaceutics Classification System (BCS)'. The selection of non-toxic hydrophilic solvent, carrier, coating excipients and its ratios are independent of the individual chemical entities and it leads to enhance the solubility and bioavailability. Lozenges are solid dosage forms that are intended to be dissolved or disintegrated slowly in the mouth. They contain one or more active ingredients and are flavored and sweetened so as to be pleasant tasting. It is generally used for their topical effect, but may also have ingredients that produce a systemic effect. It is used to medicate the mouth and throat for the slow administration in digestion or cough remedies. Lozenges may contain an anaesthetic, a demulcent, or an antiseptic. Lozenges provide a pleasant dosage form for patients who are unable to swallow other types of solid dosage forms.
Materials and Methods
HPTLC method
Test solution: About 2.5 g of herbal powder was macerated with dichloromethane for 24 hrs. Then it was filtered and evaporated to dryness. The dried residue was dissolved in methanol and used for TLC analysis.
Standard preparation: About 5 mg of gingerol was dissolved in 5 ml of methanol. From this 0.1 μl to 2 μl was spotted containing concentration in the range of 0.1 μg to 2 μg /ml. Stationary phase: Silica gel 60 F 254
Mobile phase: Hexane: Ethyl acetate (55:45)
Procedure: Applied 0.1 μl to 2 μl of standard solution and 5 μl to 20 μl of test solutions spotted on a pre-coated silica gel 60 F 254 HPTLC plate (E. Merck) of uniform thickness 0.2 mm using linomat 5 sample applicator. Developed the plate in the solvent system to a distance of 8 cm. Scanned the plate densitometric ally at 569 nm using TLC scanner after spraying with anisaldehyde sulphuric acid reagent. Observed the plate under visible light using Camag Reprostar 3.
Spraying reagent: Anisaldehyde sulphuric acid reagent.
Wave length: 569 nm
Evaluation: A band at Rf value of 0.71 corresponding to gingerol is visible in test solution tracks.
Determination of standard curve
The stock solution of 1 mg/ml of gingerol was prepared by dissolving 100 mg of pure drug in 10 ml ethanol and sonicated and made up the volume up to 100 ml with phosphate buffer (pH 6.8). The stock solution was serially adulterated to get 2-10 μg/ml solutions. The absorbances of the above diluted solutions were measured at 280 nm using a UV spectrophotometer [2].
Determination of solubility
Excess quantity of Gingerol was added to glycerin, tween-80, polyethylene glycol grade 400, propylene glycol and distilled water separately. The resultant saturated solutions were shaken in a rotary shaker (Remi ISO 9001:2000, CIS-24BL) for 48 h at 25°C. The solutions were then centrifuged for 30 min at 2000 rpm and the supernatant was filtered, diluted and observed through UV-spectrophotometer (SHIMADZU 1800) at a scanning λmax of 280 nm. Drug solubility in each liquid vehicl ed etwearms ined.
Formulation of liquisolid system
The liquisolid compacts were formulated according to the theory and mathematical model presented by Spirease. According to this model, PEG 400 was used as a liquid vehicle based on its drug solubility, Avicel PH 102 was separately used as carrier material and Aerosil-200 was used as a coating material. According to the theory of liquisolid system carrier and coating material retain a specified quantity of liquid vehicle that ensures acceptable flowability and compressibility. The ratio of carrier to coating material is termed as excipient ratio of powder (R), defined as:

Where, R is excipients ratio, Q is carrier material weight and q is the weight of coating material used in the formulation. 54/ Load Factor (Lf) is the ratio between the weight of liquid medication (drug dissolved or dispersed within the liquid vehicle) overweight of carrier material used that produces a powder with acceptable flow ability and efficient compression [3].

Where W is the weight of liquid medication and Q is the weight of carrier material. The load factor was further used for the determination of carrier and coating material quantity (Table 1).
| Formulation code |
Drug (mg) |
Vehicle PEG400 (ml) |
Carrier Q (mg) |
Coating q (mg) |
Sodium starch glycolate (mg) |
Talc (mg) |
Total (mg) |
| LF1 |
100 |
150 |
380 |
76 |
7.06 |
7.13 |
720.19 |
| LF2 |
100 |
150 |
664 |
66.4 |
9.8 |
9.8 |
1000 |
| LF3 |
100 |
100 |
304 |
60.8 |
5.64 |
5.7 |
576.14 |
| LF4 |
100 |
100 |
531 |
35.1 |
7.6 |
7.7 |
781.4 |
| LF5 |
100 |
50 |
228 |
45.6 |
4.2 |
4.2 |
432 |
| LF6 |
100 |
50 |
398 |
39.8 |
5.8 |
5.9 |
652.6 |
| Note: F: Liquisolid formulation; Lf: liquid load factor |
Table 1: Formulation chart of liquisolid technique.
Pre-compression parameters
Flow properties evaluation powder flow is of prime importance at the industrial level because it ensures efficient compression. In current research work, basic flow ability parameters were evaluated including Carr’s compressibility index and Hausner’s ratio. Bulk and tapped densities were determined by taking a suitable quantity of powder in the graduated cylinder and volumes occupied before and after tapping were observed. Carr’s compressibility index was determined using the following formula.
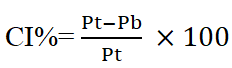
Where Pt tapped density and Pb is bulk density. British Pharmacopeia (BP) categorize the CI% less than 25 in an acceptable range of flow properties. Whereas Hausner’s ratio was calculated by dividing the tapped density value over bulk density. The angle of repose was determined using the fixed funnel method. The funnel was fixed at a suitable height; the powder was allowed to fall through funnel orifice which forms a heap with a horizontal surface. The angle of repose was determined by employing the following formula [4].
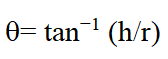
Where h is pile height and r is the distance between the pile center and edge.
Differential Scanning Calorimetry (DSC)
An accurately weighed 2 mg of liquid solid powder was sealed tightly in the aluminum pan against an empty aluminum pan as the reference standard. The DSC (METTLER TOLEDO)
measurements were carried out at a scanning rate of 10°C/min and a temperature range between 0 and 350°C.
Fourier Transform Infrared Spectroscopy (FTIR)
FTIR studies were conducted to check out drug excipients interaction. The sustained release liquisolid formulation, carrier material, coating material, physical mixture and active drug were analyzed using IR spectrophotometer (JASCO 4600). The method adopted was the ATR IR method at a scanning time of 3 min. The spectra were recorded at a scanning range of (4000 cm-1 and 400 cm-1). The recorded spectra were evaluated and compared for any spectral changes.
X-Ray Crystallography (XRD)
The cross section of samples was exposed to X-ray radiation (Cu Kα) with wavelength of 1.5406°A. The rate of the scanning was 0.6°/min. Samples, ground into powders with an agate mortar and pestle, were measured on a low background quartz plate in an aluminum holder.
Preparation of candy lozenges
The preparation of candy lozenges process show in Figure 1.

Figure 1: Preparation of lozenges.
Required quantity of sugar syrup was prepared mixing sugar and water. Dextrose was dissolved in small quantity of water and heated it to 110â?? till dextrose dissolves completely forming as clear viscous syrup. Then the dextrose solution was poured into the sugar syrup and heated to 160â?? till the color changes to golden yellow. The temperature was bought down to 90â?? and drug, polymer and other ingredients were added. The solution was poured into the mold having 2.8 cm diameter and 6.5 mm thickness [5]. The prepared tablets were stored wrapped in aluminum foil and stored in desiccators to prevent moisture uptake. The final weight of each lozenge is 3 gm. The details of formulations are given in Table 2.
| Ingredients |
F1 |
F2 |
F3 |
F4 |
F5 |
F6 |
| Drug (mg) |
10 |
10 |
10 |
10 |
10 |
10 |
| HPMC K100 (mg) |
16 |
32 |
48 |
16 |
32 |
48 |
| Sucrose (mg) |
1966 |
1950 |
1934 |
1966 |
1950 |
1934 |
| Dextrose (mg) |
974 |
974 |
974 |
974 |
974 |
974 |
| Citric acid (mg) |
32 |
32 |
32 |
32 |
32 |
32 |
| Menthol (mg) |
1 |
1 |
1 |
1 |
1 |
1 |
| Total (mg) |
3090 |
3090 |
3090 |
3090 |
3090 |
3090 |
Table 2: Preparation of lozenges formulation.
Evaluation of physicochemical characteristics of optimized gingerol lozenges
Average weight and weight variation test: 20 lozenges were selected and weighed collectively and individually on an electronic balance. From the collective weight, average weight was calculated. Each lozenge weight was then compared with average weight to assure whether it was within permissible limits or not. Not more than two of the individual weights deviated from the average weight by more than 7.5% for 300 mg tablets and none by more than double that percentage.
Friability test: The friability of the 20 tablets from each batch was tested by a fribilator. At a speed of 25 rpm for 4 min. The lozenges were then deducted, reweighed and percentage weight loss was calculated by the equation:

Disintegration test: The disintegration test was carried out in 6.8 pH phosphate buffer at 37°C ± 0.5°C and the time taken for the disintegration of lozenges were noted. Experiments were performed in triplicate.
Drug content: Appropriate number of lozenges are crushed and dissolved in 5 ml of methanol in 50 ml volumetric flask and volume made up of 50 ml with phosphate buffer pH 6.8. From this solution 1 ml was taken and diluted with phosphate buffer pH 6.8 in 50 ml volumetric flask then sonicated for 30 min and then filtered using filter paper. The absorbance of the solution is measured spectrophotometric ally at 280 nm. The drug content of gingerol lozenges was calculated using calibration curve.
Moisture content analysis: The sample was weighed and crushed in a mortar. From this 1 gm of sample was weighed and placed in a desiccator for 24 h.
After 24 h the sample was weighed. The moisture content was determined by subtracting the final weight from initial weight of lozenges [6].
In vitro mouth dissolving time: Mouth dissolving time was determined by each batch formulation using USP disintegration apparatus, where lozenges were placed in each tube of the apparatus and time taken for the lozenges to dissolve completely was noted by using 100 ml phosphate buffer of pH 6.8 at 37°C. This test was done in triplicate. The average dissolving time for lozenges was calculated and presented with standard deviation.
In vitro dissolution studies: USP dissolution test apparatus type II (Paddle) was used for dissolution studies. A dissolution test was carried out using 900 ml of phosphate buffer 6.8 pH at 37 ± 0.5°C temperature and 100 rpm. 5 ml sample solutions were collected at a precise time interval of 5, 10, 15, 20, 25 and 30 min and an equivalent volume of fresh solution was added to maintain the sink condition. The sample solution was analysed at 280 nm using a spectrophotometer against a suitable blank.
Stability studies: All the prepared formulations were subjected to stability studies at temperature and 40°C/75% RH for a period of 3 month. After 1 month drug content, hardness and moisture content were determined [7].
Construction of calibration curve: Calibration curve of gingerol was taken in phosphate buffer 6.8 at 280 nm. The absorbance value in the range of 1-5 μg/ml and their calibration curve were given. The drug was found to obey Beer’s Lambert’s law with Regression coefficient (R2) values of 0.9858 in phosphate buffer pH 6.8 (Table 3 and Figure 2).
| Concentration (µg/ml) |
Absorbance 280 nm |
| 0 |
0 |
| 1 |
0.079 |
| 2 |
0.134 |
| 3 |
0.214 |
| 4 |
0.3 |
| 5 |
0.323 |
Table 3: Calibration curve of gingerol.
Figure 2: Calibration curve of gingerol in phosphate buffer pH 6.8.
Solubility of gingerol in different solvents
The solubility was determined by dissolving in different solvents like distilled water, tween 80, propylene glycol, glycerol and PEG400 [8]. PEG 400 was exploited as a non-volatile liquid vehicle for gingerol liquisolid system (Table 4 and Figure 3).
| S. no |
Solvents |
Solubitity (mg/ml) |
| 1 |
Distilled water |
0.98 |
| 2 |
Tween |
1.74 |
| 3 |
Propylene glycol |
1.95 |
| 4 |
Glycerol |
2.68 |
| 5 |
PEG 400 |
3.85 |
Table 4: Solubility of gingerol in different solvents.

Figure 3: Solubility of gingerol in different solvents.
Compatibility studies using FT-IR spectroscopy
FTIR spectra of drug, excipients and their mixtures were analyzed to check the interactions between them. The spectra and major peaks of individual compounds and their combinations are given in the Figure 4. From the spectra it is clear that there is no interaction between the drug and excipients. Hence the selected excipient was found to be compatible with the selected drug (Table 5 and Figures 5-7).

Figure 4: FTIR studies of pure gingerol powder.

Figure 5: FTIR studies of drug with Avicel PH102.
| S. no |
Functional group assignment |
Wave number (cm-1) of gingerol |
| 1 |
C=C bond |
1600-1680 |
| 2 |
O-H bond (alcohol) |
3200-3600 |
| 3 |
C=C stretching (aromatic) |
1500-1600 |
| 4 |
C-H Stretching (aromatic) |
3000-3100 |
Table 5: FTIR studies of pure gingerol powder.

Figure 6: FTIR studies of drug with Aerosil 200.

Figure 7: FTIR studies of drug with sodium starch glycolate.
Quantification of gingerol in ginger powder using HPTLC
The result shows in Tables 6.
| No. |
Parameters |
Results |
Reference for test methods |
| 1 |
Appearance |
Brown coloured powder |
IP Vol-I, 2014 |
| 2 |
Quantification of Gingerol (By HPTLC) |
1.21% w/w |
- |
Table 6: Result of HPTLC.
Estimation of gingerol in ginger powder by HPTLC
Photo documentation under UV at visible (Figures 8-12).

Figure 8: Photo documentation under UV visible spectrophotometer.

Figure 9: 3D display at 569 nm.

Figure 10: Denstiogram of standard preparation (Rf=0.73).

Figure 11: Denstiogram test sample (Rf=0.73).

Figure 12: Spectral comparison for purity.
Results and Discussion
The amount of gingerol in herbal powder was found to be 1.21% w/w.
DSC curve of gingerol
As shown in Figure 13, DSC thermo gram of the drug depicts a sharp endothermic peak at 215.5° corresponding to the melting transition temperature and decomposition gingerol such sharp endothermic peak signifies that 6-gingerol used was in pure crystalline state. On the other hand, physical mixture (liquid solid compact) thermo gram displayed complete disappearance of characteristic peak at 221° [9]. A fact that agrees with the formation of drug solution in the liquid solid powdered system, i.e. the drug was molecularly dispersed within the liquid solid matrix. Such disappearance of the drug peak in formulation of the liquid solid system was in agreement with article who declared that the complete suppression of all drug thermal features, and indicate the formation of an amorphous solid solution (Figure 14).

Figure 13: Differential scanning calorimetry of gingerol.

Figure 14: Differential scanning calorimetry of optimized formulation.
X-Ray diffractograms of pure gingerol and optimized formulation
The absence of characteristic peak gingerol in the liquid solid compact formulation shows the conversion of drug to an amorphous or solubilized form. The absence of crystallinity in the liquid solid compact system is due to the solubilization of drug in the liquid vehicle (Figures 15 and 16).

Figure 15: X-ray diffractograms of pure gingerol.

Figure 16: X-ray diffractograms of optimized formulation.
Preparation of liquisolid compact (Figure 17).

Figure 17: Preparation of liquisolid compacts of F1, F2, F3, F4, F5 and F6.
Pre-compression parameters
The drug and the formulated powders of gingerol formulation were evaluated for precompression parameters. Table 7 revealed that all the powders of liquisolid compact systems prepared had a satisfactory inflow according to the attained results of measuring the angle of repose. The angle of repose ranges from 24.65 to 28.85. The set gingerol powder systems can be arranged in thrusting order, regarding the angle of repose measures as follows LF510].
The results attained from Table 7 for Car’s index and Hauser’s ratio were calculated. These results revealed that LF1 and LF3 had Hausner ration of 1.13, 1.16 respectively, which were lower than 1.2 and suggested with good flow ability and the rest formulations had low flow ability because it has Hausner’s ratio greater than 1.2. Formulations LF2, LF4, LF5 and LF6 had Carr’s indicator values of lower than 21 which supports the fact that these phrasings have good inflow [11]. The results are given in the Table 7 below.
| LS-Formulation |
Angle of repose θ |
Bulk density (g/ml) |
Hausner’s ratio g/ml |
Tapped density g/ml |
Carr’s index (%) |
| LF1 |
26.43 |
0.4137 |
1.13 |
0.5433 |
22 |
| LF2 |
28.85 |
0.4829 |
1.25 |
0.6025 |
25 |
| LF3 |
25.12 |
0.4142 |
1.16 |
0.4833 |
17 |
| LF4 |
28.34 |
0.3968 |
1.26 |
0.5026 |
28.2 |
| LF5 |
24.65 |
0.3608 |
1.33 |
0.4811 |
25.06 |
| LF6 |
25.45 |
0.4135 |
1.4 |
0.5079 |
21.95 |
Table 7: Precompression parameters.
Preparation of lozenges (Figure 18).

Figure 18: Preparation of lozenges.
Disintegration time
As shown in Table 8 LF4 formulation was set up to be disintegrated (660 seconds) the fastest followed by LF1, LF2, LF3, LF5, LF6, with disintegration times of 720 sec, 840 sec, 720 sec, 720 sec, 840 sec, seconds respectively [12]. Among all this formulation, F4 shows the lower disintegrating time (660 sec) and showed a rapid release (Table 8).
| LS-Formulation |
Disintegration time (sec) |
| LF1 |
720 |
| LF2 |
840 |
| LF3 |
720 |
| LF4 |
660 |
| LF5 |
720 |
| LF6 |
840 |
Table 8: Disintegration time.
Pre-compression studies of lozenges
The hardness of the lozenges was evaluated. The lozenges formulation LF1, LF2 and LF3, was having the mean hardness of 10, 10.23 and 11.18 respectively. Also, formulation LF4 and LF5, LF6 were having hardness of 10.32, 10.52 and 10.48.
The friability test indicated that all the liquid solid lozenges complied with the British Pharmacopeia specifications as no tested formulations recorded percentage lost exceeding 1% showed the weight variation of lozenges comply with the test for uniformity of weight. Percentage moisture loss was determined and results are given in Table 9. It was determined to know about the lozenges stability nature and ability of lozenges to withstand its physiochemical properties under normal conditions [13]. Percentage moisture loss of the lozenges LF1, LF2 was found to be 0.6 to 0.7. Percentage moisture loss of the lozenges LF3, LF4 was found to be 0.6 to 0.8. Percentage moisture loss of the lozenges LF5, LF6 was found to be 0.8 to 0.6. Among all these 6 formulations, LF2 and LF5 shows the maximum value which indicates the % moisture loss increases with increase in the percentage of polymer, this may be due to hydrophilic character of the polymer. All the formulations are within the acceptable limits and the results were similar. Where all the formulations were within the range of 90.11%, 95.10% (Table 9).
| Formulation |
Hardness (kg/cm2) |
Friability (%) |
Weight variation (mg) |
Drug content |
| LF1 |
10.00 ± 0.002 |
0.63 ± 0.04 |
803 ± 18 |
92.47 ± 0.005 |
| LF2 |
10.23 ± 0.005 |
0.59 ± 0.01 |
801 ± 23 |
90.11 ± 0.006 |
| LF3 |
11.18 ± 0.008 |
0.42 ± 0.06 |
798 ± 11 |
95.10 ± 0.004 |
| LF4 |
10.32 ± 0.006 |
0.59 ± 0.04 |
795 ± 20 |
97.82 ± 0.008 |
| LF5 |
10.52 ± 0.003 |
0.58 ± 0.02 |
800 ± 19 |
94.40 ± 0.005 |
| LF6 |
10.48 ± 0.005 |
0.54 ± 0.10 |
793 ± 15 |
92.01 ± 0.002 |
| Note: Mean SD, n=3 |
Table 9: Hardness friability weight variation, drug content of lozenges.
Dissolution of lozenges
For in vitro dissolution study of Table 10 show the dissolution profile of the formulations. It determines that LF5 as more dissolution release rate 90.08 in 60 min. Among all, optimised LF4 showed advanced release rate 97.82.
The dissolution rates were increased by the proper carriers that used for the lozenges formulations. The advanced dissolution rate displayed by liquid solid compacts will ameliorate the immersion of medicine from the GI tract (Figures 19 and 20).
| Formulation |
Time (min) |
| 10 |
20 |
30 |
40 |
50 |
60 |
| LF1 (%) |
29.19 |
42.72 |
55.69 |
71.33 |
80.53 |
83.68 |
| LF2 (%) |
56.39 |
62.54 |
69.17 |
78.53 |
86.72 |
89.98 |
| LF3 (%) |
48.56 |
79.73 |
65.19 |
72.39 |
81.92 |
85.97 |
| LF4 (%) |
25.96 |
39.52 |
48.42 |
59.37 |
70.69 |
76.38 |
| LF5 (%) |
58.79 |
65.96 |
70.21 |
79.49 |
87.83 |
90.08 |
| LF6 (%) |
52.92 |
61.43 |
67.66 |
76.96 |
83.64 |
88.62 |
Table 10: Dissolution of lozenges.

Figure 19: In vitro dissolution of formulations F1, F2 and F3.

Figure 20: In vitro dissolution of formulations F4, F5 and F6.
In vitro drug release kinetics
In order to determine the release kinetics, the in vitro drug release data were analyzed in zero order, first order and higuchi model. The preference of a certain mechanism was based on the coefficient of determination for the parameters studied, where the highest coefficient of determination is preferred for the selection of the order of release. However in many experimental situations the mechanism of drug diffusion deviates from the Fickian equation and follows a non-Fickian (anomalous) behavior. In some cases the Korsemeyer-peppas model was used to analyze the release kinetics. Using the Korsemeyer-Peppas model, n=0.45 indicates case I or Fickian diffusion, 0.45< n>0.89 indicates anomalous behavior or non-Fickian transport, n=0.89 indicates case II transport and n greater than 0.89 indicates super case II transport. Release of all the formulations followed Higuchi model, exhibited diffusion controlled mechanism as indicated from the highest coefficient of determination (r2) (Table 11).
According to the Korsemeyer peppas model anomalous (non- Fickian release) was observed in F4 formulation as indicated from the release exponent which was 0.9874. It was found that F4 formulation follows Higuchi model as it had highest R2 value with Korsemeyer-peppas mechanism (Figure 21).

Figure 21: In vitro drug release kinetics of lozenges containing gingerol liquid solid compact.
| Formulation code |
Zero order R2 |
First order R2 |
Higuchi model R2 |
Korsmeyer-peppas equation R2 |
| F4 |
0.9173 |
0.7699 |
0.9874 |
0.7032 |
Table 11: Kinetics analysis of in vitro drug release data of F4 formulation.
Stability study
The stability study of liquisolid compact was performed at, 40 ± 2°C, 75% RH (in stability chamber) and room temperature (27°C ± 2°C) for 1 month.
The physical appearances, drug content were evaluated after 1 day and 3rd month of storage.
There was no significant change observed in the hardness and drug content of the liquisolid compact over 3 month at any temperature condition (Table 12).
| Day of sample withdrawing |
Temperature |
Hardness |
Drug content |
| Day 1 |
40°C ± 2 |
10.32 ± 0.006 |
97.82 ± 0.008 |
| Room temperature |
10.3 ± 0.006 |
97.70 ± 0.006 |
| Day 30 |
40°C ± 2 |
10.25 ± 0.003 |
97.62 ± 0.008 |
| Room temperature |
10.35 ± 0.003 |
97.72 ± 0.005 |
| Note: Mean SD, n=3 |
Table 12: Stability study.
Conclusion
Formulation F4 was optimized based on the findings of the evaluation studies mentioned above. Formulation F4's in vitro drug release demonstrated a 90.08% release profile, adhering to the Higuchi model. Additionally, it was discovered that the stability tests of the improved formulation LF4 were adequate. Therefore, the goal of this approach was to increase the active ingredient's bioavailability and water solubility.
References
- Manogar PG, Hari BV, Devi DR (2011) Emerging liquisolid compact technology for solubility enhancement of BCS class-II drug. J Pharm. Sci Res 3:1604-1611
[Google Scholar]
- Akinlade B, Elkordy AA, Essa EA, Elhagar S (2010) Liquisolid systems to improve the dissolution of furosemide. Sci Pharm 78:325-344
[Crossref] [Google Scholar] [PubMed]
- Pundir S, Verma AM (2014) Review on lozenges. J Pharm Res 2:1-10
[Google Scholar]
- Pothu R, Yamsani MR (2014) Lozenges formulation and evaluation: A review. IJAPR 1:290-294
[Google Scholar]
- Meghwal M, Goswami TK (2012) Chemical composition, nutritional, medicinal and functional properties of black pepper: A review. Open Acc Sci Rep 1:1-5
[Google Scholar]
- Elkordy AA, Essa EA, Dhuppad S, Jammigumpula P (2012) Liqui solid technique to enhance and to sustain griseofulvin dissolution: Effect of choice of non-volatile liquid vehicles. Int J Pharm 434:122-132
[Crossref] [Google Scholar] [PubMed]
- Limpongsa E, Tabboon P, Pongjanyakul T, Jaipakdee N (2022) Preparation and evaluation of directly compressible orally disintegrating tablets of cannabidiol formulated using liquisolid technique. Pharmaceutics 14:2407
[Crossref] [Google Scholar] [PubMed]
- Bhalani DV, Nutan B, Kumar A, Singh Chandel AK (2022) Bioavailability enhancement techniques for poorly aqueous soluble drugs and therapeutics. Biomedicines 10:2055
[Crossref] [Google Scholar] [PubMed]
- Shinde SG, Kadam V, Kapse GR, Jadhav SB, Zameeruddin BV, et al. (2014) A review on lozenges. Indo Am J Pharm Sci Res 4:567-570
[Google Scholar]
- Pothu R, Yamsani MR (2014) Lozenges formulation and evaluation: A review. Indo Am J Pharm Sci Res 1:290-294
[Google Scholar]
- Stephen OM (2015) A Review on Lozenges. Am J Med Sci 5:99-104
- Lu M, Xing H, Jiang J, Chen X, Yang T, et al. (2017) Liquisolid technique and its applications in pharmaceutics. Asian J Pharm Sci 12:115-123
[Crossref] [Google Scholar] [PubMed]
- Spireas S, Sadu S (1998) Enhancement of prednisolone dissolution properties using liquisolid compacts. Int J Pharm 166:177-188
[Crossref] [Google Scholar]
Citation: Pradeepa R, Padmapreetha J (2025) Design and Development of the Liquisolid Compact of Gingerol Loaded Lozenges. Int J Drug Dev Res
Vol:17 No:1


