Key words
|
| |
| Nebivolol, Spectrophotometry, Validation, Pharmaceutical formulations, Biological fluid. |
| |
INTRODUCTION
|
| |
| Chemically Nebivolol (NEB) is á, á’–[ Iminobis (methylene) ] bis [ 6 - fluro - 3, 4 - dihyro -2H- 1-benzopyran -2-mehtanol] hydrochloride. Its empirical formula is C22 H26 ClF2 NO4. NEB is a white to slightly pink crystalline powder with a molecular mass of 441.9 g/mol. It is practically insoluble in water. NEB is It has mild vasodilating properties attributed to its interaction with the L-arginine/nitricoxide pathway, a property not shared by other beta- blockers (Fig. 1). The drug is used in combination with other anti hypersensitive drugs. The usual dose of NEB is 5 mg per day and its plasma half life is 7 to 27 hrs [1, 2]. It is selective adrenergic blocker having 65 to 70 % bioavailability. more than 50% of patients starting NEB treatment experience its related neuropsychiatric adverse events (NPAEs), such as dizziness, tiredness, parasthesia [4]. |
| |
| Several analytical methods of NEB were reported including LCMS, HPLC [5, 6]. The information about spectrophotometric method used to analyze the NEB concentration was rather scanty. In the present studies an attempt has been made to develop simple, sensitive, and economical method in UV region with greater precision and accuracy for the estimation of NEB in pure drug, tablet formulation and biological fluids. |
| |
MATERIALS AND METHODS:
|
| |
| NEB sample was supplied by Emcure pharmaceuticals., Pune, as a gift sample and used as such. Methanol used was spectro grade purchased from S. D. Fine Chemicals ltd., India. All other reagents used were of analytical reagent grade supplied by Research Lab., India. Spectral and absorbance measurements were made on a UVVisible spectrophotometer Jasco V 530 model with 10mm matched pair of quartz cell and spectral band width of ±2nm. |
| |
|
Selection of solvent
|
| |
| The ideal property of a solvent should be that the drug should be completely soluble in the solvent used. The drug should be stable in the solvent used and should be economical and volatile. After suitable literature survey, practical experience and taking above factors into consideration the suitable solvents selected were methanol. |
| |
|
Selection of Method and Wavelength:
|
| |
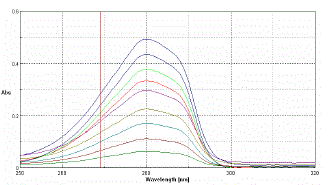
| For estimation of NEB single-wavelength spectrophotometric method employing 280 nm analytical wavelengths was used |
| |
|
Standard solutions and calibration curve [7, 8]
|
| |
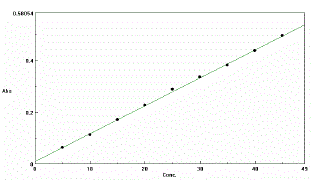
| Accurately weighed 10mg of NEB is transferred into a 100ml volumetric flask and dissolved in 20ml of methanol. It was then sonicated for 10 minutes, and made up to the mark with distilled water to give a stock solution having 100 µg/ml concentration. For calibration curve, serial dilutions were made for NEB in the range of 5, 10, 15, 20, 25, 30, 35, 40 and 45µg/ml concentrations were prepared by diluting the stock solution with methanol: water (20:80). The absorbance values of above solutions were measured in the wavelength at λ max 280nm against methanol as blank and calibration curve was prepared. It obeyed beer’s law in these concentration ranges. |
| |
|
Sample preparation for tablet analysis
|
| |
| To determine the content of NEB in conventional tablets (label claim: 5 mg NEB per tablet), twenty tablets were weighed, their mean weight was determined and they were finely powdered and powder equivalent to 10 mg of NEB was weighed and transferred into a 100 ml volumetric flask containing 20 ml methanol, sonicated for 10 min and the resulting sample solution was then filtered through Whatmann filter paper (No. 41). The filtrate was further diluted with distilled water to obtain the final concentration of 100µg/ml. Appropriate dilutions of NEB were scanned over the range of 400-200 nm and the absorbance at wavelength 280nm was measured. From calibration curve the final drug concentration in tablet was calculated. |
| |
|
Standard drug solution in plasma and calibration curve [9, 10]
|
| |
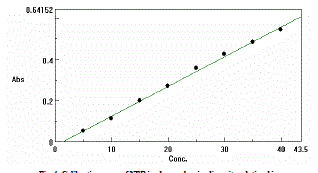
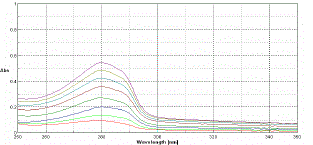
| To the 2.5 ml of blood sample 0.5 ml of 0.1 M acetic acid was added. RBC allowed to settle down. Sample was centrifuged at 5000 rpm. for 35 min. The supernatant was collected as plasma. To the 20 ml solution of weight sample of drug dissolved in methanol, 2 ml of plasma solution was added. Obtained 22 ml solution was filtered through syringe filter of size 45 µm size. Final volume was adjusted to 100 ml with distilled water to get stock solutions containing 100 ìg/ml of NEB. A series of dilutions were made with methanol to get the concentrations of 5, 10, 15, 20, 25, 30, 35, 40 and 45ìg/ml. The absorbance values of above solutions were measured in the wavelength at λ max 280 nm against methanol as blank and calibration curve was prepared. |
| |
|
Analysis of tablet formulation in plasma:
|
| |
| Twenty tablets were accurately weighed; ground to powder and an equivalent of 10mg of active ingredient dissolved in 20 ml methanol was taken into a 100 ml volumetric flask, sonicated for about 10 min. This solution was filtered through whatmann filter paper No.41; previously separated 2 ml plasma solution was added. The solution was filtered through hydrophilic PVDF 45µm size syringe filter. Final volume was made up to 100 ml with distilled water. Aliquots in suitable concentration were prepared analyzed using proposed method. |
| |
|
Method Validation [11, 12]
|
| |
| Method validation was performed in terms of specificity and selectivity, precision and accuracy, linearity and stability. |
| |
|
Precision and Accuracy
|
| |
| Accuracy of analysis was determined by performing recovery studies by spiking different concentrations of pure drug in the pre analyzed tablet samples within the analytical concentration range of the proposed method at three different set at level of 80%, 100% and 120%. |
| |
| Precision was calculated for inter day and for intraday. The data obtained shows that method is sufficiently precise. Precision is calculated as % Relative Standard Deviation. |
| |
|
Linearity and Stability
|
| |
| The response for NEB was linear in the concentration range of 5 - 45µg/ml. with coefficient of correlation r2 = 0.9995 for pure drug and r2 = 0.9983 for durg in plasma. |
| |
| Problems of stability are usually encountered with these compounds, mainly affecting plasma concentration at room temperature, storage in freezer eliminates decomposition. |
| |
RESULTS AND DISCUSSION
|
| |
| Standard calibration curve for NEB , covering the range 5-45 ìg/ml , prepared by serial dilution with methanol for pure drug, tablet formulation and drug in plasma were developed and validated . The procedure was adopted as per designed protocol, based on ICH Q2 (R1) guidelines. The calibration curve was obtained by plotting absorbance vs. analyte concentration. The slope and intercept of the calibration line was determined by linear regression. |
| |
|
Selectivity and specificity:
|
| |
| The drug NEB in the formulation and the plasma was well identified under this condition. No interference observed in nine different samples of NEB. Fig.2 and 3 showed a linear relationship between the absorbance and the concentration, with correlation coefficient and percentage estimated with standard deviation of 0.999, 100.12 ± 1.03,respectively. The results are shown in Table 1 and 2. |
| |
| In Fig 4 and 5 the regression analysis of the calibration curve for NEB in plasma showed a linear relationship between the absorbance and the concentration, with correlation coefficient and percentage estimated with standard deviation of 0.9989, 99.98 ±0.98,respectively. The results are shown in table 3 and 4. |
| |
|
Recovery
|
| |
| As shown in Table 5 and 6 excellent recoveries were made at each added concentration using solvent and plasma. |
| |
|
Precision
|
| |
| Precision evaluated through intraday and inter day of the pure drug from solvent and plasma are presented in Tables 7, 8, 9 and 10 respectively. |
| |
Limit of detection (LOD) and Limit of quantification (LOQ):
|
| |
| The LOD determined as the amount of drug and LOQ was determined as the lowest concentration for drug shown in Table 11. |
| |
|
Lowest Limit of detection (LLOD) and Lowest Limit of quantification (LLOQ):
|
| |
| The LLOD determined as the lowest amount of drug and LLOQ was determined as the lowest concentration for drug in plasma shown in Table 12 |
| |
CONCLUSION
|
| |
| A spectrophotometric method for quantifying NEB in tablet and plasma has been developed and validated. The method is selective, precise, accurate and linear over the concentration range studied. The method is simple and suitable for the determination of NEB in formulation and plasma without interference from excipients or from common degradation products, suggesting its application in IPQC and pharmacokinetic studies. |
| |
ACKNOWLEDGEMENT
|
| |
| The authors sincerely thank Emcure Pharmaceuticals Pvt Ltd, Pune for providing the gift sample of NEB. The authors would like to express their gratitude to Dr A. S. Kulkarni (Satara College of Pharmacy, Satara) and Mr. S. U. Kokil (Emcure Pharmaceuticals, Pune) for their support towards this research work. |
| |
Conflict of Interest
|
| |
| NONE |
| |
Source of Support
|
| |
| NIL |
| |
Tables at a glance
|
 |
 |
 |
 |
| Table 1 |
Table 2 |
Table 3 |
Table 4 |
|
| |
 |
 |
 |
 |
| Table 5 |
Table 6 |
Table 7 |
Table 8 |
|
| |
 |
 |
 |
 |
| Table 9 |
Table 10 |
Table 11 |
Table 12 |
|
| |
Figures at a glance
|
 |
 |
 |
 |
 |
| Figure 1 |
Figure 2 |
Figure 3 |
Figure 4 |
Figure 5 |
|
| |


