Izlem Izbudak1*, Netsiri Dumrongpisutikul2, Carol B Thompson3, Aylin Tekes1, Majda Thurnher4 and Thierry AGM Huisman1
1Division of Pediatric Neuroradiology, The Russell H. Morgan Department of Radiology and Radiological Science, Johns Hopkins School of Medicine, Baltimore, MD, USA
2Department of Radiology, Faculty of Medicine, King Chulalongkorn Memorial Hospital, Pathumwan, Bangkok, Thailand
3Biostatistics Center, Johns Hopkins Bloomberg School of Public Health, MD, USA
4Department of Neuroradiology, University Hospital, Vienna, Austria
*Corresponding Author:
Izlem Izbudak
Assistant Professor, Neuroradiology
The Russell H. Morgan Department of Radiology
and Radiological Science, Johns Hopkins Hospital
600 N. Wolfe Street, Phipps B-126-B, Baltimore
Tel: 410 955 2353
Fax: 410 614 1213
E-mail: vivek03sharma@rediffmail.com
Citation: Izbudak I, Dumrongpisutikul N, Thompson CB. Diffusion Tensor Scalars Vary with Age and Across Spinal Levels in Children. J Neurol Neurosci. 2016, 6:4. doi: 10.21767/2171-6625.100047
Received Date: July 21, 2015; Accepted Date: December 04; 2015; Published Date: December 07, 2015
Keywords
Apparent Diffusion Coefficient (ADC), Fractional Anisotropy (FA), Diffusion Tensor Imaging (DTI)
Introduction
Diffusion tensor imaging (DTI) is a non-invasive, advanced imaging modality that has helped in understanding the pathophysiology of white matter diseases at a microstructure level in the brain and might be an important additional tool for the quantitative evaluation of the spinal cord. The spinal cord DTI studies in the literature are limited in number compared to brain DTI studies and mostly are performed in adults and focused on the cervical spinal cord [1-10]. This is due to inherent technical challenges of the spinal cord DTI; related to small cord volume, susceptibility artifacts created by different tissue interfaces such as bone, soft tissue, CSF; as well as CSF pulsation, respiratory and cardiac motion artifacts. These artifacts affect the thoracic cord the most at mid thoracic level, therefore the majority of the prior studies focused on cervical spine or even upper cervical spine.
There are even less studies in children and hardly any normative data [5,6,11,12]. Age-specific normative data are necessary to identify and grade spinal cord pathology in developing children. Similar to the brain, many ongoing maturational processes (myelination, fiber packing, networking, sprouting of synapses, etc.) are expected to alter the DTI scalars of the spinal cord [13,14]. Another aspect of spinal cord is potential differences across spinal levels [15]. Only recently Barakat et al. in 25 normal children aged 7 to 21 years showed a variation in DTI metrics between C1 and T1 levels [5].
The goals of this study were two-fold. 1) To evaluate the agedependent evolution of the ADC and FA values of the normal pediatric cervical spinal cord as well as upper thoracic cord, and 2) to evaluate whether there are statistically significant differences of ADC and FA values between upper cervical, lower cervical and upper thoracic levels in developing children.
Materials and Methods
Subjects
All children studied by MRI and DTI of the cervical and upper thoracic cord were retrospectively evaluated. Children 0 to 21 years old with good quality spinal MRI and DTI images were included in this study. Exclusion criteria were 1) clinically confirmed pathology or disease of the spinal cord or central nervous system, 2) positive MRI and DTI findings for disease of the spinal cord, 3) non-diagnostic image quality and 4) incomplete clinical and imaging information. The cut-off age of 2 (30 months to be precise) was chosen as it is a widely-accepted milestone for early maturation including myelination in the corticospinal tracts which neurodevelopmentally correlates to independent walking and effective hand control (reaching and grasping). The study was approved by the institutional review board of our hospital with permission to access the patients’ database.
Imaging Techniques
All MRI studies were performed on a clinical 1.5 Tesla MR scanner (Avanto, Siemens Healthcare, Erlangen, Germany) using a standard 4-element neck matrix coil and a standard 24-element spine matrix coil. Routine conventional sequences of the spine were performed including axial and sagittal T1- and T2- weighted turbo spin echo imaging and sagittal short [inversion time (TI)] inversion recovery (STIR) sequences.
We obtained sagittal DTI of the cervical and upper thoracic spinal cord using a single-shot, interleaved, multi-slice, spin-echo EPI pulse sequence in combination with parallel imaging with an acceleration (iPAT) factor of two. Cervical and upper thoracic cord could be included in a single FOV with minimal artifacts as detailed above. DTI images were acquired using the following parameters: TR: 2400 ms; TE: 100 ms; field-of-view: 220 mm; slice thickness: 1.9 mm; imaging matrix: 192x192 with an in-plane resolution of 1.1x1.1 mm. Balanced pairs of diffusion gradients were used, centered around the 180° pulse, to minimize eddy current effects. The tensor of the diffusion was sampled by diffusion gradients oriented in 20 non-collinear directions in space using two b-values (0 and 750 mm2/s). No respiratory or cardiac gating was performed. Diffusion weighted images, as well as ADC, FA and color-coded FA maps, were created using the standard vendorspecific software (Siemens Neuro3D).
Data analysis
The conventional MRI images and post-processed DTI maps (ADC and FA maps) were visually evaluated for quality and for any incidental pathology by 2 experienced pediatric neuroradiologists. Any spinal cord level which showed distortion, artifacts or inhomogeneity of the signal intensities was excluded. Regions of interest (ROI) were manually placed at the center of the cervical and upper thoracic spinal cord at every intervertebral disk level defined on a sagittally reconstructed trace-image. Meticulous ROI-placement to avoid the partial volume averaging effect with the CSF was performed at mid-sagittal images. Sizes of the ROIs ranged between 2-9 mm2 to include the maximum cord area while avoiding the CSF averaging (Figure 1). Average ADC and FA values were collected over the selected ROIs at every intervertebral disc level concurrently with the minimum and maximum values and standard deviations. Any measurement which showed more than 30% standard deviation was not included in the analyses. The upper cervical level (UC) was defined from the cranio-cervical junction to C3/4 intervertebral disc level. The spinal cord ROIs at C4/5-C7/T1 were classified as lower cervical level (LC) and T1/2-T4/5 were classified as upper thoracic level (UT). Each of UC, LC, UT levels was comprised of up to 4 measurements and for that reason there were up to 12 measurements per child.
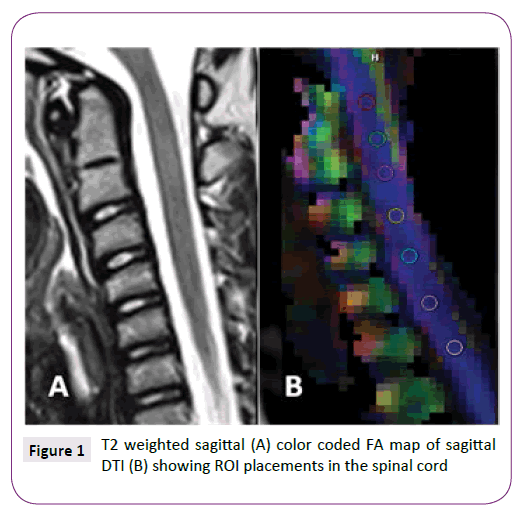
Figure 1: T2 weighted sagittal (A) color coded FA map of sagittal DTI (B) showing ROI placements in the spinal cord
Statistical analysis
Statistical analysis was performed with STATA version 11.1 (STATA Corporation, 2010; College Station, Texas). Linear regression was used to evaluate the relationship between age and ADC and FA. The subjects were also classified into two groups by age less than or greater than 2 years (specifically 30 months). The ADC and FA values were compared between the two age groups across the levels UC, LC, and UT using a general linear model with repeated measures. Up to 12 measurements (excluding those with more than 30% standard deviation) were used for each child in a mixed effects model with fixed effects of area (LC, UC, UT) and level (4). This general linear model used the available measurements as repeated measures for each child to compare the three areas for FA and ADC individually. A two-tailed p-value <0.05 was considered statistically significant.
Results
Forty-seven subjects were included (23 male, 24 female) with mean ± standard deviation (SD) age of 74.3 ± 61.1 months (range 2 months-17.5 years). Using a cut-off age of 2 years (30 months), there were 16 subjects <2 years of age (34%) and 31 subjects older than 2 years (66%).
Across the 47 scans, after exclusion of the levels with significant artifacts; there were 176 ADC measurements (mean ± SD: 3.7 ± 0.6 per scan) at the UC level, 180 ADC measurements (3.8 + 0.4 per scan) at the LC level, and 139 measurements (3.0 ± 1.2 per scan) at the UT level. Across the 47 scans, there were 178 FA measurements (mean ± SD: 3.8 ± 0.5 per scan) at the UC level, 179 FA measurements (3.8 ± 0.4 per scan) at the LC level, and 142 measurements (3.0 ± 1.2 per scan) at the UT level.
ADC and FA demonstrated statistically significant relationships with age for all three spinal levels, decreasing and increasing, respectively (Table 1 and Figure 2). The mean ADC values for ages ≤2 years were significantly greater than for ages >2 years at each of the three levels (Table 2 and Figure 3). The mean FA values for ages ≤2 years were significantly less than for ages >2 years at all three levels (Table 3 and Figure 4). When comparing levels within each age category, UT has significantly lower ADC values than either UC or LC (Table 4 and Figure 3). No significant differences between levels were found for FA values within each age category (Figure 4).
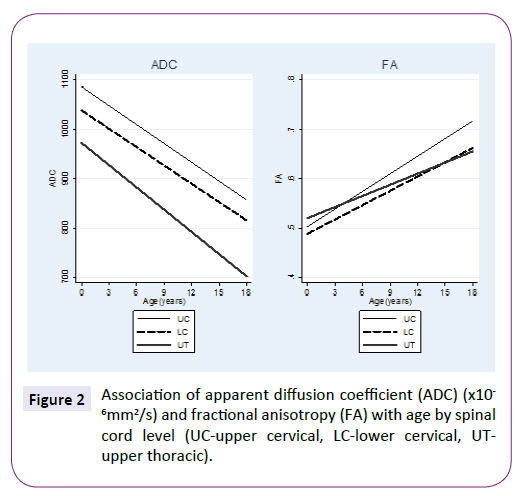
Figure 2: Association of apparent diffusion coefficient (ADC) (x10 -6mm2/s) and fractional anisotropy (FA) with age by spinal cord level (UC-upper cervical, LC-lower cervical, UTupper thoracic).
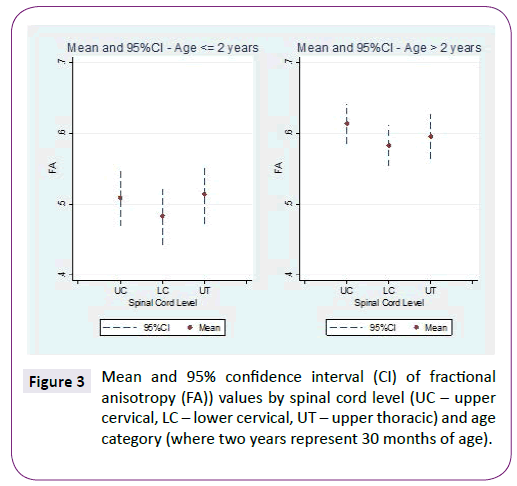
Figure 3: Mean and 95% confidence interval (CI) of fractional anisotropy (FA)) values by spinal cord level (UC – upper cervical, LC – lower cervical, UT – upper thoracic) and age category (where two years represent 30 months of age).
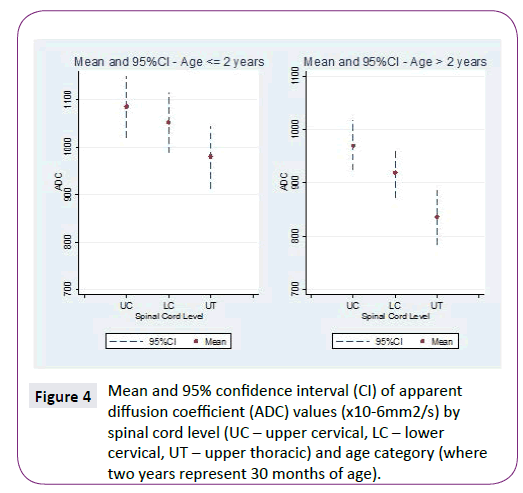
Figure 4: Mean and 95% confidence interval (CI) of apparent diffusion coefficient (ADC) values (x10-6mm2/s) by spinal cord level (UC – upper cervical, LC – lower cervical, UT – upper thoracic) and age category (where two years represent 30 months of age).
| |
ADCa |
FA |
| Levelb |
Slopec (95%CI) |
Slope (95%CI) |
| UC |
-12.8 (-19.1, -6.4) |
0.012 (0.007, 0.016) |
| LC |
-12.4 (-12.9, -3.0) |
0.010 (0.006, 0.014) |
| UT |
-15.1 (-22.8, -7.3) |
0.008 (0.003, 0.012) |
a10-6mm2/s; bUC-Upper Cervical, LC-Lower Cervical, UT-Upper Thoracic; cSlope represent change in ADC/FA for each year increase in age
Table 1: Slope and 95% confidence intervals (CI) for apparent diffusion coefficient (ADC) and fractional anisotropy (FA) values with age for three spinal cord levels
| Levelb |
ADC value x10-6mm2/s (95% CIc) |
p-value |
| ≤ 2 years (n=16) |
> 2 years (n=31) |
| UC |
1085.8 (1021,1150) |
970.4 (923, 1018) |
0.005 |
| LC |
1052.8 (988, 1117) |
919.0 (872, 966) |
0.001 |
| UT |
980.0 (914, 1046) |
836.0 (785, 887) |
0.001 |
aADC-Apparent Diffusion Coefficient; bUC-Upper Cervical, LC-Lower Cervical, UT-Upper Thoracic; cCI-Confidence Interval
Table 2 Comparison of the ADCa values by age categories split at two years (30 months) for three spinal cord levels.
| Levelb |
FA value (95% CIc) |
p-value |
| ≤ 2 years (n=16) |
> 2 years (n=31) |
| UC |
0.509 (0.469,0.548) |
0.613 (0.585, 0.642) |
< 0.001 |
| LC |
0.484 (0.444,0.524) |
0.583 (0.554, 0.611) |
< 0.001 |
| UT |
0.514 (0.473,0.554) |
0.595 (0.564, 0.626) |
0.002 |
aFA-Fractional Anisotropy; bUC-Upper Cervical, LC-Lower Cervical, UT-Upper Thoracic; cCI-Confidence Interval
Table 3 Comparison of the FAa value by age categories split at two years (30 months) for three spinal cord levels.
| Levelb |
Mean difference of the ADC value x10-6mm2/s (95% CIc) |
| ≤ 2 years (n=16) |
p-value |
> 2 years (n=31) |
p-value |
| LC-UC |
-33.0 (-108, 42) |
0.391 |
-51.5 (-106, 3) |
0.066 |
| UT-UC |
-105.8 (-182, -30) |
0.006 |
-134.5 (-193, -76) |
< 0.001 |
| UT-LC |
-72.9 (-149, 3) |
0.061 |
-83.0 (-141, -25) |
0.005 |
aADC-Apparent Diffusion Coefficient; bUC-upper Cervical, LC-lower Cervical, UT-Upper Thoracic; cCI-confidence Interval
Table 4 Comparison of the ADCa values between levels for each age group.
Discussion
MRI diffusion tensor metrics; ADC and FA in this study; at cervical and upper thoracic cord; showed relationships with age in children of ages from 2 months to 17.5 years. ADC values decreased and FA values increased with increasing age. This result correlates with the previous DTI studies which showed an age-related ADC decrease and FA increase in the brain [14,16,17]. Recently Singhi et al. showed age-related ADC decrease and FA increase in the UC spinal cord in 41 normal children [11]. Otherwise there are no previous studies, to our knowledge, that investigated the normal diffusion metrics of the spinal cord in children from infancy to adulthood. A gradual decrease in ADC and gradual increase in FA with increasing age reflects CNS maturation process in the spinal cord which includes myelination of the axons, membrane proliferation, decreasing extra axonal space and decreasing overall water content among other things that are not yet well known [14].
When the study cohort was divided into two groups, the ADC values were significantly lower and FA values were significantly higher at all levels in children older than 2 years of age compared to children equal to or younger than 2 years of age. The cutoff age of 2 (30 months to be precise) was chosen as a widelyaccepted milestone for early maturation including myelination in the corticospinal tracts which neurodevelopmentally correlates to independent walking and effective hand control (reaching and grasping). Altman J and Bayer S.A. demonstrated this developmental process from fetal life to the 2nd year of life by macroscopic and microscopic analysis of preserved human spinal cord specimens [13]. The authors showed an orthograde (craniocaudal) maturation of the lateral and ventral corticospinal tracts in the first 2 years of life. A larger normal population between 0 to 2 years of age and axial DTI acquisition with high resolution can enable measurements of specific corticospinal tracts and would probably demonstrate the same orthogonal maturation by using DTI.
The UT cord showed significantly lower ADC values than either the UC or LC in both age groups in our study. A recent cervical spinal cord DTI study in developing children also showed a gradual decrease in mean diffusivity (MD) (synonymous to ADC) in craniocaudal direction (C1 to T1) [5]. This is attributed to the decreasing number of axons in the spinal cord from cervical to thoracic direction, which was also mentioned in adult DTI studies [2,18]. Interestingly the same study showed a gradual decrease in FA from superior to inferior direction whereas in our study FA did not show statistically significant differences across spinal cord levels. Major white matter tracts are highly ordered and course in a single direction (craniocaudal or caudacranial) in the human spinal cord. Even without myelination of the axons there is high anisotropy along the longitudinal axis of the cord; on the contrary to the brain where there are innumerable crossing fibers. We think the decreasing number of axons craniocaudally result in decreased diffusion in both axial and radial diffusion keeping the FA constant [14]. Secondly, the previously published data represents the age range from 7 years to 85 years whereas our cohort includes 31 children between 2 months and 6 years of age which might have affected the FA results differently. The potential effect of gray matter inclusion on sagittal DTI makes understanding the simultaneously ongoing maturational processes and changes in FA and ADC metrics more difficult.
There are some limitations of our study. First, cardiac or respiratory gating was not used during MR scanning. The thoracic levels are the most sensitive to respiratory and cardiac motion. Therefore some cardiac and respiratory artifacts may have biased our results. This might be reflected on smaller number of measurements of good quality DTI data in UT compared to cervical cord. However gating increases the scanning time and our goal was to keep scanning time to a reasonable minimum for a clinical MRI in this pediatric population (the used DTI sequence takes approximately five minutes). Secondly, by measuring ADC and FA at mid-sagittal plane we have most likely included both gray and white matter in the voxel, however this is an inherent limitation of a sagittal DTI technique and the measured values represent an overall diffusion characteristics at the individual cord levels. Sagittal DTI acquisition was chosen as it took shorter scan time compared to axial acquisition and allowed scanning of the entire cervical and upper thoracic cord in a single acquisition. Thirdly, due to limitations of DTI technique in applying to the spinal cord especially at the upper thoracic cord level as listed before; we had to exclude data with artifacts and this resulted in varying numbers of samples for each three spinal cord levels. Lastly, this is a retrospective study and prospective larger multi institutional population based studies would be the ideal study design.
Conclusion
Our study shows that developmental differences in maturing pediatric spinal cord exist and it should be taken into account when MR imaging with DTI is undertaken in children. We recommend having an age and level-matched normative data for more accurate interpretation of the DTI results. A quantitative in vivo method of spinal cord imaging is important in young children with spinal cord injury.
Conflicts of Interest and Source of Funding Related to the Study
No conflicts of interest and no funding was received for this study.
7890
References
- Ducreux D, Fillard P, Facon D (2007) Diffusion tensor magnetic resonance imaging and fiber tracking in spinal cord lesions: current and future indications. Neuroimaging clinics of North America17:137-147.
- Song T, Chen WJ, Yang B (2011) Diffusion tensor imaging in the cervical spinal cord. European spine journal : official publication of the European Spine Society, the European Spinal Deformity Society, and the European Section of the Cervical Spine Research Society20:422-428.
- Wheeler-Kingshott CA, Hickman SJ, Parker GJ (2002) Investigating cervical spinal cord structure using axial diffusion tensor imaging. NeuroImage16:93-102.
- Clark CA, Werring DJ (2002) Diffusion tensor imaging in spinal cord: methods and applications - a review. NMR in biomedicine15:578-586.
- Barakat N, Mohamed FB, Hunter LN (2012) Diffusion tensor imaging of the normal pediatric spinal cord using an inner field of view echo-planar imaging sequence. AJNR. American journal of neuroradiology33: 1127-1133.
- Mohamed FB, Hunter LN, Barakat N (2011) Diffusion tensor imaging of the pediatric spinal cord at 1.5T: preliminary results. AJNR. American journal of neuroradiology32:339-345.
- Mulcahey MJ, Samdani A, Gaughan J (2012) Diffusion tensor imaging in pediatric spinal cord injury: preliminary examination of reliability and clinical correlation. Spine37:797-803.
- Qian W, Chan Q, Mak H (2011) Quantitative assessment of the cervical spinal cord damage in neuromyelitis optica using diffusion tensor imaging at 3 Tesla. Journal of magnetic resonance imaging: JMRI33:1312-1320.
- Renoux J, Facon D, Fillard P, Huynh I, Lasjaunias P, et al. (2006) MR diffusion tensor imaging and fiber tracking in inflammatory diseases of the spinal cord. AJNR. American journal of neuroradiology27:1947-1951.
- Wang KY, Idowu O, Thompson CB (2015) Tract-Specific Diffusion Tensor Imaging in Cervical Spondylotic Myelopathy Before and After Decompressive Spinal Surgery: Preliminary Results. Clinical neuroradiology.
- Singhi S, Tekes A, Thurnher M (2012) Diffusion tensor imaging of the maturing paediatric cervical spinal cord: from the neonate to the young adult. Journal of neuroradiology. Journal de neuroradiology 39:142-148.
- Barakat N, Shah P, Faro SH (2015) Inter- and intra-rater reliability of diffusion tensor imaging parameters in the normal pediatric spinal cord. World journal of radiology7:279-285.
- Altman J, Bayer, Shirley A (2001) Development of the human spinal cord: An interpretation based on experimental studies in animals. England: Oxford ; New York : Oxford University Press.
- Dubois J, Dehaene LG, Perrin M (2008) Asynchrony of the early maturation of white matter bundles in healthy infants: quantitative landmarks revealed noninvasively by diffusion tensor imaging. Human brain mapping29:14-27.
- Izbudak I, Dumrongpisutikul N, Thompson CB (2011) Trends and differences in DTI metrics across ages and spinal cord levels in normal children. Paper presented at: International Society of Magnetic Resonance in Medicine; Montreal, Quebec, Canada.
- Saksena S, Husain N, Malik GK (2008) Comparative evaluation of the cerebral and cerebellar white matter development in pediatric age group using quantitative diffusion tensor imaging. Cerebellum7:392-400.
- Mukherjee P, Miller JH, Shimony JS (2002) Diffusion-tensor MR imaging of gray and white matter development during normal human brain maturation. AJNR. American journal of neuroradiology23:1445-1456.
- Ellingson BM, Ulmer JL, Kurpad SN, Schmit BD (2008) Diffusion tensor MR imaging of the neurologically intact human spinal cord. AJNR. American journal of neuroradiology29:1279-1284.