Keywords
Diabetic neuropathy; Sensory dysfunction; Diabetes; Mechanical sensitivity; Von frey
Abbreviations: AMPK: 5' Adenosine Monophosphate- Activated Protein Kinase; ANOVA: Analysis of Variance; DbHF: Streptozotocin-Induced Diabetic High-Fat Diet; DbStd: Streptozotocin-Induced Diabetic Standard Diet; DMEM: Dulbecco’s Modified Eagle Culture Medium; DRG: Dorsal Root Ganglia; ETC: Electron Transport Chain; FCCP: Trifluorocarbonylcyanide Phenylhydrazone; LSD: Least Square Difference; mTor: Mammalian Target of Rapamycin; NdHF: Non-diabetic High-Fat Diet; NdStd: Non-Diabetic Standard Diet; PBS: Phosphate Buffered Saline; PGC-1α: Proliferator-Activated Receptor Gamma Coactivator 1-Alpha; PGC-1β: Proliferator-Activated Receptor Gamma Co-activator 1-Beta; phospho Akt: Activated Protein Kinase B; Sirt 1: NAD-Dependent Deacetylase Sirtuin-1; STZ-Diabetic: Streptozotocin- Induced Diabetic; TRPV1: Transient Receptor Potential Cation Channel Subfamily V Member 1; UCP-2: Uncoupling Protein-2; VDAC: Voltage Dependent Anion Channel; β-HB: Serum Beta-Hydroxybutyrate
Introduction
Mitochondrial dysfunction is purported as an etiological factor involved in the pathogenesis of diabetic neuropathy, but the contributions of mitochondrial dysfunction to diabetic neuropathy remain debated [1-6]. Mitochondrial respiration, spare respiratory capacity, mitochondrial enzyme activity, and mitochondrial oxidative phosphorylation protein expression are reduced in cultured dorsal root ganglia (DRG) from diabetic animals [2,4,5,7]. In addition, cultured DRG neurons from diabetic animals’ exhibit mitochondrial accumulation in axonal swellings and altered mitochondrial fission-fusion equilibrium, resulting in small mitochondria with ultra-structural abnormalities [8-11]. Sensory neurons cultured in hyperglycemic conditions also exhibit reduced mitochondrial protein translation and decreased mitochondrial oxygen consumption [12]. Importantly, the negative effects of hyperglycemia are not restricted to just the sensory neurons in the DRG. Schwann cells isolated from neonatal rats that were cultured under hyperglycemic conditions [13] exhibited reduced coupled mitochondrial respiration efficiency and altered mitochondrial protein expression. Hyperglycemiainduced perturbations in Schwann cells may additionally contribute to sensory neuron dysfunction in diabetic animals and humans.
Notably, treatment with ciliary neurotrophic factor prevented indices of neuropathy including thermal hypoalgesia and sensory and motor nerve conduction deficits in STZinduced diabetic mice while ciliary neurotrophic factor exposure corrected mitochondrial respiration deficits in DRG harvested from STZ-diabetic mice [4]. Together, these results suggest mitochondrial damage and dysfunction may play a role in the dying-back neurodegeneration that occurs in diabetic neuropathy. Although diabetes has been shown to alter mitochondrial function, evidence that mitochondria are altered in diabetic models with significant characteristics of neuropathy is lacking [1-3,6].
Studies discussed above demonstrated diabetes-induced mitochondrial dysfunction, but the majority of these observations were made in models of diabetic neuropathy that lacked significant sensory-related behavioral or pathological changes, or neuropathy was not characterized [1-3,6,9]. Thus, further studies using models of diabetic neuropathy that exhibit significant indices of neuropathy are needed to understand the role of diabetes-induced mitochondrial dysfunction in diabetic neuropathy.
The prevalence of obesity and physical inactivity continues to increase and the influence of lifestyle-related metabolic variables (i.e., diet and the lipid profile) is increasingly important in terms of diabetic neuropathy risk in human patients. According to the National Health and Nutrition Examination Survey 1999-2002, 85.2% of individuals with diagnosed diabetes were overweight or obese [14]. As the prevalence of diabetes has risen significantly over the last decade, it is likely the prevalence of overweight and obesity in diabetic patients has also increased [15]. Although obesity is a concomitant condition in the majority of diabetic patients, rodent studies of diabetic neuropathy have typically been conducted in lean animals fed a standard, low-fat diet.
To better emulate the human condition, we used a high-fat diet in conjunction with diabetes to exacerbate mitochondrial dysfunction and study neuropathy earlier in the diabetic progression. Our previous data reveals that a high-fat diet fed STZ-diabetic C57BL/6 mice altered the phenotype of neural symptoms by inducing a mechanical hypersensitivity instead of the mechanical insensitivity that normally develops in this model of diabetic neuropathy [16]. Previous rodent studies suggest changes in mitochondrial respiration and protein expression are relatively slow, subtle, and do not occur until later stages of diabetes, suggesting other factors in addition to hyperglycemia may drive mitochondrial changes in the DRG [2,5]. Thus, it is also important to characterize mitochondrial function in this clinically relevant model with a robust behavioral phenotype. Here, we examine mitochondrial biochemical changes in the DRG as a potential mechanism underlying high-fat diet induced neuropathy in non-diabetic and STZ- diabetic mice.
Methods
Animals and diet
Animals were acquired and cared for in accordance with guidelines published in the Guide for the Care and Use of Laboratory Animals and the Guidelines on the Use of Animals in Neuroscience Research from the Society for Neuroscience [17,18]. All protocols and procedures were approved by the University of Kansas Medical Center Animal Use and Care Committee and efforts were made to minimize discomfort.
Seven week-old male C57Bl/6 mice were purchased from Charles River (Wilmington, MS) and housed in the research support facility at the University of Kansas Medical Center. Animals were placed on 12:12h light/dark cycle with ad libitum access to a standard or high-fat diet as described in previously [16]. Mice were randomized to the following treatment groups: non-diabetic standard diet (NdStd); non-diabetic highfat diet (NdHF); STZ-diabetic standard diet (DbStd); and STZdiabetic high-fat diet (DbHF).
Diabetes induction
Mice were fasted for 3 hours pre and post STZ or vehicle injection. Diabetes was induced in eight week-old mice via a single intraperitoneal STZ injection (180 mg/kg body weight; Sigma-Aldrich, St. Louis, MO) in 10 mM sodium citrate buffer (pH 4.5). A vehicle injection (400 μl of the sodium citrate buffer) was administered to eight week-old non-diabetic mice. Body weight and blood glucose monitored as described previously [16].
Protein extraction
At the end of the 8 week intervention, mice were deeply anesthetized via isofluorane inhalation and euthanized by decapitation. The twelve lumbar DRG were dissected and snap frozen in liquid nitrogen and stored at -80°C until prepared for protein extraction. DRG were lysed by sonication in Cell Extraction Buffer (Invitrogen) containing 55.55 μl/ml protease inhibitor cocktail, 200 mM Na3VO4, and 200 mM NaF. Following sonication, tissue lysates were kept on ice for 1 hour and vortexed every 10 minutes. Samples were then centrifuged at 10,000 g for 10 minutes at 40°C and total protein concentration of the supernatant was measured using the Bio-Rad protein assay based on the Bradford method (Bio- Rad, Hercules, CA).
Western blots
Samples were boiled at 95-100°C with Lane Marker Reducing Sample Buffer (Thermo Scientific, Waltham, MA) for 3 minutes. Samples containing 25 μg of protein were separated by electrophoresis (35 mA/gel, 0.75 hr, 40°C) on 4% to 15% gradient tris-glycine polyacrylamide gels (Bio-Rad) and transferred onto nitrocellulose membrane (400 mA, 1.5 hr, 40°C). Nitrocellulose membranes were blocked for 1 hour at room temperature in blocking solution (5% bovine serum albumin and 0.05% Tween-20 in 0.1 M phosphate buffered saline [PBS, pH 7.4]) followed by overnight incubation (40°C) in primary antibody diluted in blocking solution (1% bovine serum albumin and 0.05% 0.1 M PBS [pH 7.4]). The following primary antibodies were used to probe membranes: Total Ox Phos Antibody Cocktail MS601 (1:200, Mito Sciences, Eugene Oregon), total Akt (1:1,000, Cell Signaling), phospho (Ser473) Akt (1:500, Cell Signaling), total mTor (1:500, Cell Signaling), phospho-mTor (1:500, Cell Signaling), total AMPK (1: 1,000, Abcam), phospho-AMPK (1:1,000, Abcam), PGC-1α (1:500, Calbiochem), PGC-1β (1:1000, Abcam) Sirt1 (1:400, Abcam), VDAC (1:1,000, Calbiochem), UCP2 (1:500, abcam) and actin (1:10,000, Millipore).
After incubation in primary antibody, nitrocellulose membranes were then washed in PBST (0.05% Tween-20 in 0.1 M phosphate buffered saline [pH 7.4]) and incubated for 1 hour at room temperature in anti-mouse or anti-rabbit IgGHRP secondary antibody (Santa Cruz, Santa Cruz, CA) diluted 1:5,000 in blocking solution. Bands were visualized by enhanced chemiluminescence (ECL) using Supersignal West (Femto or Pico) Substrate (Pierce, Rockford, IL) and detected on X-ray film. Bands were quantified via densitometry using NIH Image J software. In order to normalize band intensity to total protein or determine phospho/total ratio for a specific protein, nitrocellulose membranes were stripped using Restore Plus Western Blot Stripping Buffer (Pierce, Rockford, IL), and probed with actin primary antibody (Millipore, Billerica, MA) or the total primary antibody corresponding to each phosphoantibody. Bands were visualized and quantified as described above.
β-hydroxybutyrate levels
Serum β-hydroxybutyrate levels were quantified to assess ketosis levels. Blood was collected into Eppendorf tubes, placed on ice to clot for 30 minutes, and centrifuged for 15 minutes at 3,000 x g. Serum was removed and stored at -80°C until assayed with β-hydroxybutyrate kit (Pointe Scientific) according to manufacturer’s directions.
Statistics
Data were analyzed using a two-factor analysis of variance (ANOVA) with Fisher’s test of least square difference (LSD) post-hoc comparisons. Pearson correlations using two-tailed Pvalues were performed to assess the relationship between β-HB levels and paw percent withdrawal. Statistical significance was set at P<0.05 for all analyses reported in this manuscript.
Results
Body weight, glucose, and insulin
These metabolic data were reported in previously [16] and are briefly summarized here. As expected in this type 1 diabetic model, DbStd weighed less than NdStd. DbHF mice gained weight compared to DbStd who lost weight over the course of 8 weeks (at wk 8 DbStd: 20.6 ± 0.5, DbHF: 25.2 ± 0.8 g). NdHF mice were on average, near 10 g heavier than NdStd mice at week 8 of the study (NdStd: 27.8 ± 0.5, NdHF: 36.0 ± 0.6 g). DbStd mice consumed at least 2 times as many kcals/day compared to all other groups. Despite increased weight gain in NdHF and DbHF, daily energy intake was not significantly increased compared to their counterparts fed the standard diet.
Both DbStd and DbHF exhibited severe hyperglycemia, but DbHF had significantly lower blood glucose levels than DbStd throughout the duration of the study (at wk 8 DbStd: 486.9 ± 17.2, DbHF: 403.5 ± 13.3 mg/dl). Glucose levels in NdHF were elevated compared to NDStd, suggesting a pre-diabetic state in NdHF (at wk 8 NdStd: 122.3 ± 5.8, NdHF: 178.4 ± 14.5 mg/dl). As expected in STZ-diabetic mice, insulin levels were significantly lower in both DbStd and DbHF compared to NdStd and NdHF, respectively. High-fat feeding induced hyperinsulinemia in NdHF, providing additional evidence to suggest that NdHF mice have disrupted insulin and glucose homeostasis, consistent with pre-diabetes.
Sensorimotor behavior is altered by high-fat feeding
Hindpaw sensitivity was assessed as described and reported previously using the von Frey test for mechanical sensitivity and is summarized below [16]. The percentage of positive responses to repeated applications (6 per hindpaw) of a 1.4 g von Frey monofilament was reported as percent paw withdrawal. A decrease in percent paw withdrawal indicates a reduction in hindpaw sensitivity whereas an increase in percent paw withdrawal reflects an increase in paw sensitivity. Percent paw withdrawal was analyzed using a two-factor ANOVA with Fisher’s test of LSD post-hoc comparisons.
Our previous data reveals that a high-fat diet fed to STZdiabetic C57BL/6 mice strongly alters phenotype of neural symptoms by inducing a robust mechanical hypersensitivity associated with painful neuropathy) instead of the mechanical insensitivity (insensate neuropathy) that normally develops in this model [16]. In addition, NdHF mice develop mechanical hypersensitivity. At week 8 of the study, percent paw withdrawal was 56.0 ± 5.1% in NdStd while DbStd exhibited a slight reduction in percent paw withdrawal (50.2 ± 5.4%), which did not reach statistical significance in this particular cohort. In contrast, after 8 weeks of high-fat feeding, both NdHF (75.3 ± 3.9%) and DbHF (73.0 ± 6.2%) mice had significantly higher percent paw withdrawal compared to NdStd (56.0 ± 5.1%) and DbStd (50.2 ± 5.4%), respectively. We have not confirmed specific mechanisms that drive high-fat diet-induced mechanical hypersensitivity, thus it is important to examine the potential role of mitochondrial changes in this novel, diet-induced behavioral phenotype.
Expression of proteins involved in mitochondrial function
Western blots were performed on DRG and peripheral axon lysates to determine if diabetes or high-fat feeding had an effect on the expression of oxidative phosphorylation proteins or other proteins that affect mitochondrial function or biogenesis. Subunits of oxidative phosphorylation complexes I, II, or V were not altered by diabetes or the high-fat diet (Figures 1A-1B and 1D). Uncoupling protein 2 (UCP2) expression was also not different among groups (Figure 2A). In contrast, Complex III subunit Core-2 (Figure 1C) and voltage dependent anion channel (Figure 2B, VDAC) were significantly increased in DbStd compared to NdStd. A significant increase in both of these proteins in DbStd vs. NdStd suggests diabetes may stimulate mitochondrial biogenesis in face of impaired basal mitochondrial respiration.
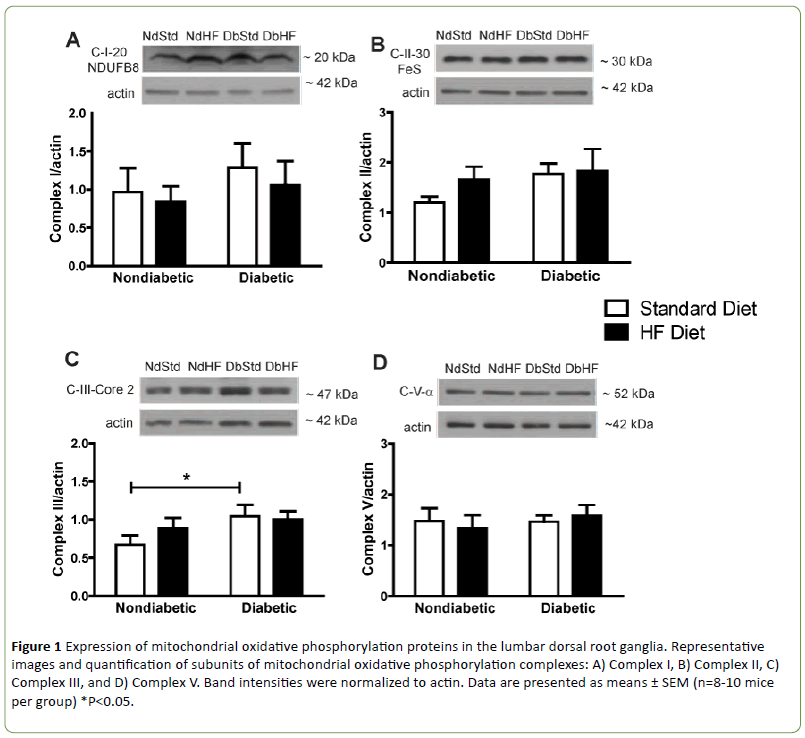
Figure 1: Expression of mitochondrial oxidative phosphorylation proteins in the lumbar dorsal root ganglia. Representative images and quantification of subunits of mitochondrial oxidative phosphorylation complexes: A) Complex I, B) Complex II, C) Complex III, and D) Complex V. Band intensities were normalized to actin. Data are presented as means ± SEM (n=8-10 mice per group) *P<0.05.
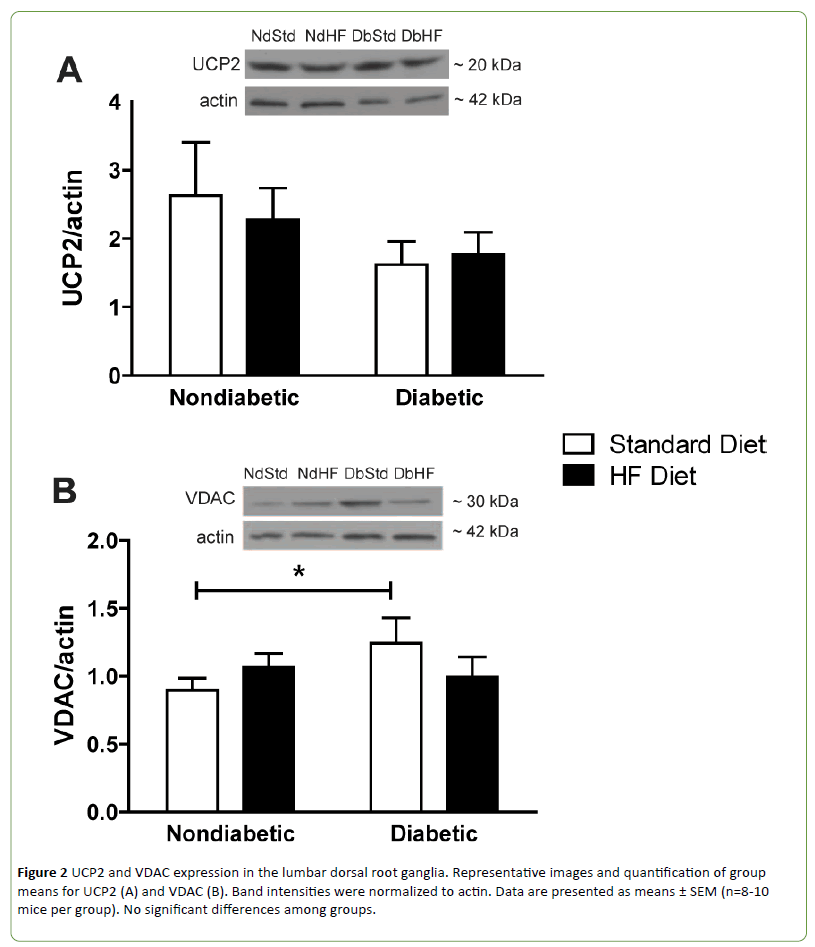
Figure 2: UCP2 and VDAC expression in the lumbar dorsal root ganglia. Representative images and quantification of group means for UCP2 (A) and VDAC (B). Band intensities were normalized to actin. Data are presented as means ± SEM (n=8-10 mice per group). No significant differences among groups.
However, there were no significant differences among groups in expression of peroxisome proliferator-activated receptor gamma coactivator 1-alpha (PGC-1α) or peroxisome proliferator-activated receptor gamma coactivator 1-beta (PGC-1β) which are transcriptional coactivators that regulate mitochondrial biogenesis and function (Figures 3A and 3B). Furthermore, there was no significant effect of diabetes or high-fat feeding on activation of proteins indirectly involved in mitochondrial biogenesis via PGC-1α activation or inhibition, including NAD-dependent deacetylase sirtuin-1 (Sirt 1, Figure 3C), activated protein kinase B (phospho Akt, Figure 4A), or 5' adenosine monophosphate-activated protein kinase (AMPK, Figure 4C) Mammalian target of rapamycin (mTor) activation is inhibited during nutrient starvation and its inhibition leads to autophagy. In addition, activated mTor plays an important role in the PGC-1α complex that is essential for activating mitochondrial DNA synthesis. Despite significant weight loss in both STZ-diabetic groups, mTor activation was not altered in DbStd or DbHF (Figure 4B).

Figure 3: Expression of proteins involved in mitochondrial biogenesis in the lumbar dorsal root ganglia. Representative images and quantification of group means for PGC-1α (A), PGC-1β, and Sirt 1 (C). Band intensities were normalized to actin. Data are presented as means ± SEM (n=8-10 mice per group). No significant differences among groups.
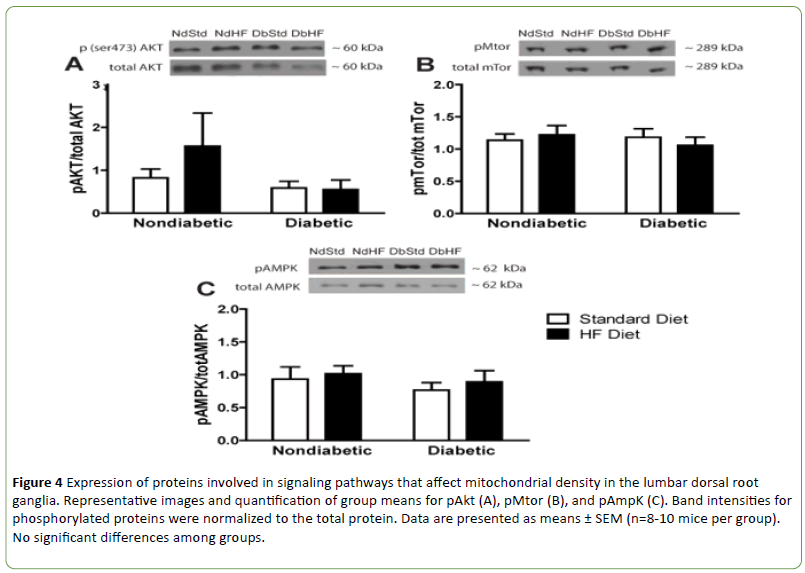
Figure 4: Expression of proteins involved in signaling pathways that affect mitochondrial density in the lumbar dorsal root ganglia. Representative images and quantification of group means for pAkt (A), pMtor (B), and pAmpK (C). Band intensities for phosphorylated proteins were normalized to the total protein. Data are presented as means ± SEM (n=8-10 mice per group). No significant differences among groups.
STZ-diabetic mice display significant ketoacidosis
Diabetic mice can develop ketosis due to increased fatty acid metabolism. Ketone bodies provide an alternative energy source and can affect mitochondrial function. Therefore, serum beta-hydroxybutyrate (β-HB) levels were quantified. Circulating β-HB levels were significantly increased in both DbStd and DbHF compared to their nondiabetic counterparts. DbHF mice did not have significantly higher β-HB levels than DbStd mice, but the lack of statistical significance was likely due to high variability in the DbHF group (Figure 5). β-HB levels were not higher in NdHF mice compared to NdStd (Figure 5).
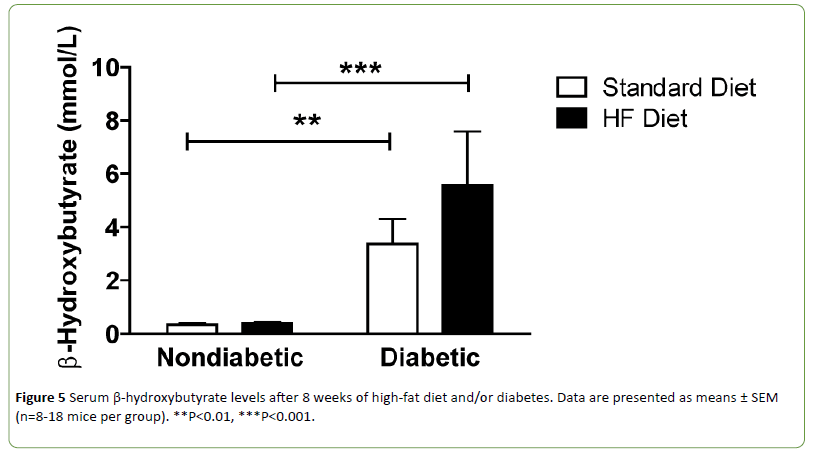
Figure 5: Serum β-hydroxybutyrate levels after 8 weeks of high-fat diet and/or diabetes. Data are presented as means ± SEM (n=8-18 mice per group). **P<0.01, ***P<0.001.
The β-HB levels in both DbStd and DbHF were high enough to indicate ketoacidosis and reduced blood pH, although these cut off values are not defined in rodents [19]. Because transient receptor potential cation channel subfamily V member 1 (TRPV1), an ion channel that has been implicated in chronic pain conditions [20], responds to a drop in pH or heat [21,22], and high-fat fed mice exhibit mechanical hypersensitivity, we examined the relationship between β-HB levels and sensorimotor behavior after 8 weeks of diabetes and/or high-fat feeding. There were no significant correlations between β-HB levels and percent paw withdrawal (Figures 6A-6C), mechanical sensitivity) in the NdHF, DbStd, or DbHF groups.
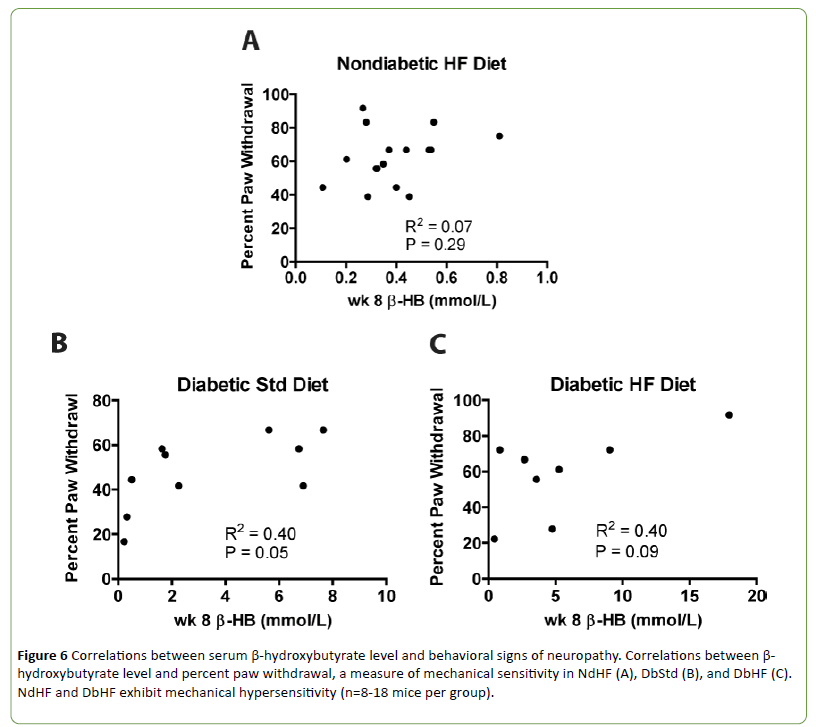
Figure 6: Correlations between serum ¸-hydroxybutyrate level and behavioral signs of neuropathy. Correlations between β-hydroxybutyrate level and percent paw withdrawal, a measure of mechanical sensitivity in NdHF (A), DbStd (B), and DbHF (C).NdHF and DbHF exhibit mechanical hypersensitivity (n=8-18 mice per group).
Discussion
Recent evidence suggests mitochondrial dysfunction may play an important role in the pathogenesis underlying diabetic neuropathy. Here, we report the effects of a high-fat diet on proteins involved in mitochondrial function in the lumbar DRG in nondiabetic and STZ-diabetic mice. All previous reports documenting mitochondrial dysfunction in animal models of diabetic neuropathy were performed on STZ-diabetic rodents or genetically obese (db/db) mice, but have not incorporated a high-fat diet [1-6,9].
Diabetes alters the mitochondrial proteome
VDAC and Complex III subunit Core-2 were increased in DbStd compared to NdStd. Although additional analyses are necessary to confirm whether these changes represent a compensatory response to offset mitochondrial dysfunction, increased Complex III subunit Core-2 and VDAC expression suggest potential compensatory mitochondrial biogenesis may occur to compensate for the deleterious effects of diabetes on mitochondrial function.
Although it is not clear why some mitochondrial proteins were increased in DbStd while other proteins were not altered by diabetes, it is plausible to suggest that some proteins are more responsive to hyperglycemia-induced damage than others. In the hyperglycemic cell, increased glycolysis results in increased electron donors to (NADH and FADH2, respectively) to Complex I and Complex II. Complex III receives electrons from Complex I and II via ubiquinol and these electrons are subsequently passed to cytochrome C. Since Complex III functions downstream of Complex I and II and is the gateway for electrons to be transported to cytochrome c and then to oxygen, perhaps Complex III is selectively increased in response to increased electron transport under hyperglycemic conditions. Increased VDAC protein suggests an in total mitochondrial mass. With increased mitochondrial biogenesis, increased oxidative phosphorylation proteins is expected, but is perhaps too subtle to be reflected in changes individual oxidative phosphorylation subunits, as we have assessed here. Increased VDAC and Complex III subunit Core-2 in DbStd fit with the hypothesis that the mitochondrial biogenesis occurs in response to hyperglycemia. Furthermore, if mitochondrial protein changes in DbStd mice are primarily mediated by hyperglycemia, DbHF mice may be protected from these effects due to less severe hyperglycemia resulting from lower dietary carbohydrate content compared to DbStd mice.
Although previous studies have shown reduced mitochondrial oxidative phosphorylation protein expression in DRG from diabetic rodents [2,4,5,23], these studies were longer in duration and performed in diabetic rats. Additional analyses to visualize mitochondrial structure and number are required to confirm mitochondrial biogenesis or morphological changes, but these analyses were not performed in the current study. Furthermore, neurons were not separated from Schwann cells and it is possible that the changes are not neuron specific and could be occurring in Schwann cells as well.
Expression of proteins related to mitochondrial biogenesis and mitochondrial function are not altered by diabetes or a high-fat diet.
Diabetes and high-fat feeding are each purported to alter expression of other proteins that play an important role in mitochondrial function and/or mitochondrial biogenesis. In the current study, neither diabetes nor the high-fat diet had an effect on UCP2, PGC-1α, PGC1β, or Sirt 1 expression, or Akt, AMPK, or mTor activation in the lumbar DRG. Increased UCP2 expression can result in increased proton leak into the mitochondria and may contribute to increased leak dependent respiration. Interestingly, reduced UCP3 expression has been reported in DRG neurons from STZ-diabetic rats and in DRG neurons cultured in hyperglycemic conditions [24]. In addition, Vincent and UCP3 overexpression prevented hyperglycemiainduced mitochondrial membrane hyperpolarization, reactive oxygen species production, and apoptosis in cultured DRG neurons [24]. Consequently, it has been suggested that reduced uncoupling proteins may play a role in sensory neuron injury that occurs in diabetic neuropathy [24]. In the current study, UCP2 expression appeared to be slightly lower in both DbStd and DbHF compared to NdStd and NDHF, but was not statistically different. Although we did not have difficulty measuring UCP2, Vincent and colleagues reported difficulty detecting UCP2 in DRG neurons [24].
Although PGC-1α and PGC-1β protein levels were not impacted by STZ-diabetes, the high-fat diet, or the STZdiabetes/ high-fat diet combination, changes in mitochondrial proteins (Complex III subunit Core-2 and VDAC) suggest potential mitochondrial biogenesis in DbStd. Swerdlow et al. [25] identified relationships between PGC-1α, Sirt 1, Akt, and mTor with notable convergence on PGC-1α activation, mitochondrial biogenesis, and autophagy.
PGC-1α and PGC-1β belong to a family of transcription coactivators that play a central role in the regulation of cellular energy metabolism and participate in the coordinated coactivation of metabolically relevant transcription factors to stimulate mitochondrial biogenesis and fatty acid oxidation [26]. AMPK is activated by phosphorylation when ATP is depleted and among other functions, phosphorylated AMPK activates PGC-1α [27]. The AMPK/ PGC-1α signaling axis is decreased in hyperglycemia and recent evidence suggests neuronal dysfunction in diabetic neuropathy is associated with mitochondrial dysfunction due to impaired AMPK/ PGC-1α signaling [27]. In the current study, there were no differences among groups in PGC-1α and PGC-1β protein expression or AMPK activation in the DRG. PGC-1α potentially increased earlier in the time course of diabetes in order to trigger compensatory mitochondrial biogenesis and perhaps returned to normal levels by the time tissues were harvested after 8 weeks of diabetes. Posttranslational modification status of PGC’s was not assessed in this analysis.
Sirt 1 deacetylates, and thereby activates PGC-1α and indirectly stimulates mitochondrial biogenesis [28]. Sirt 1 expression and activity is reduced in liver and adipose tissue of high-fat fed rodents [29]. Although Sirt-1 expression was slightly reduced in the DRG of NdHF and DbHF mice in the current study, these differences did not reach statistical significance in this cohort of animals. If diabetes and high-fat feeding were greater than 8 weeks in duration, significant changes in Sirt-1 expression may have been apparent.
Insulin signaling, via downstream Akt activation, is important for maintenance of mitochondrial function in neurons [2,30] and insulin-stimulated Akt activation is blunted in DRG neurons from STZ-diabetic mice [31]. In the current study, NdHF and DbHF exhibited hyper-insulinemia and hyperglycemia suggestive of insulin resistance, thus we hypothesized impaired Akt activation in the DRG may contribute to mechanical hypersensitivity observed in these high-fat-fed mice. However, there were no significant differences among groups in Akt activation in the DRG. Importantly, Grote and colleagues [31] assessed insulinstimulated Akt activation was while insulin stimulation was not performed in the current study.
Nutrient starvation or reduced growth factor availability can activate mTor and subsequently induce autophagy [32]. Akt is upstream and positively regulates mTor while active AMPK inhibits mTor. Because mTor is inhibited by oxidative stress and mitochondrial dysfunction, it has been suggested that mTor may be involved in the mechanism by which damaged mitochondria induce autophagy [33,34]. However, in the current study, there were no differences among groups in phosphor-mTor expression, thus the high-fat diet, nor diabetes impacted mTor activation.
Increased β-hydroxybutyrate levels do not correlate with mechanical hypersensitivity
In the current study, both DbStd and DbHF groups exhibited elevated serum β-HB levels, indicative of diabetic ketoacidosis. Because blood pH is lowered in ketoacidosis [19] and TRPV1, an ion channel that has been implicated in chronic pain states responds to reductions in pH [20], we hypothesized increased β-HB levels would correlate with mechanical hypersensitivity in the NdHF and DbHF groups. However, β-HB levels were not significantly increased in NdHF, nor was β-HB correlated with mechanical hypersensitivity in either group.
Conclusion
In light of clinical evidence indicating that dyslipidemia is an independent risk factor for the development of diabetic neuropathy, this type 1 diabetic/high-fat combination is a novel and clinically relevant model that is useful for studying diabetic neuropathy. In the current study, diabetes increased VDAC and Complex III subunit Core-2 expression in the lumbar DRG in DbStd, but not DbHF mice. Taken together, these data suggest compensatory mitochondrial biogenesis occurs after 8 weeks of STZ-induced diabetes and high-fat feeding does not alter these parameters. These data are consistent with previous studies that indicate mitochondrial dysfunction in STZ-diabetic rodents [2,5], but additional experiments are required to confirm mitochondrial dysfunction in the current model. In addition, significant mitochondrial impairment may also occur in axonal transport and trafficking, thus future studies should investigate the effect of diabetes on mitochondrial function in peripheral nerves responsible for innervating the lower extremities.
Acknowledgements and Funding
This publication was supported by Award Number T32HD057850 from the Eunice Kennedy Shriver National Institute of Child Health and Human Development to BG. Support was also contributed by National Institutes of Health (NIH) Grant R01NS43313 and NIH Grant P20 RR016475 to DW. This work was also performed with support to RS from Mitochondrial Genomics and Metabolism Core of the University of Kansas Alzheimer’s Disease Center (P30AG035982). The authors thank the members of Wright laboratory for insightful discussion and comments on this manuscript and Dr. Mark Chertoff for assistance with statistics.
Competing Interests
None.
18906
References
- Fernyhough P, Huang TJ, Verkhratsky A (2003) Mechanism of mitochondrial dysfunction in diabetic sensory neuropathy. J PeripherNervSyst8: 227-235.
- Chowdhury SKR (2010) Mitochondrial respiratory chain dysfunction in dorsal root ganglia of streptozotocin-induced diabetic rats and its correction by insulin treatment. Diabetes.
- Huang TJ (2005) Neurotrophin-3 prevents mitochondrial dysfunction in sensory neurons of streptozotocin-diabetic rats. ExpNeurol194: 279-283.
- Saleh A (2013) Ciliaryneurotrophic factor activates NF-kappaB to enhance mitochondrial bioenergetics and prevent neuropathy in sensory neurons of streptozotocin-induced diabetic rodents. Neuropharmacology65: 65-73.
- ChowdhurySKR (2012) Impaired adenosine monophosphate-activated protein kinase signalling in dorsal root ganglia neurons is linked to mitochondrial dysfunction and peripheral neuropathy in diabetes. Brain135: 1751-1766.
- Edwards JL (2010) Diabetes regulates mitochondrial biogenesis and fission in mouse neurons. Diabetologia 53: 160-169.
- Urban MJ (2012) Modulating molecular chaperones improves sensory fiber recovery and mitochondrial function in diabetic peripheral neuropathy. ExpNeurol235: 388-396.
- Zherebitskaya E (2009) Development of selective axonopathy in adult sensory neurons isolated from diabetic rats: Role of glucose-induced oxidative stress. Diabetes58: 1356-1364.
- VincentAM (2010) Mitochondrial biogenesis and fission in axons in cell culture and animal models of diabetic neuropathy. ActaNeuropathol120: 477-489.
- Schmidt RE (2009) Neuritic dystrophy and neuronopathy in Akita (Ins2(Akita)) diabetic mouse sympathetic ganglia. ExpNeurol216: 207-218.
- Schmidt RE (2011) Effect of insulin and an erythropoietin-derived peptide (ARA290) on established neuritic dystrophy and neuronopathy in Akita (Ins2 Akita) diabetic mouse sympathetic ganglia. ExpNeurol232: 126-135.
- Zhang L (2012) C-terminal heat shock protein 90 inhibitor decreases hyperglycemia-induced oxidative stress and improves mitochondrial bioenergetics in sensory neurons. J Proteome Res11: 2581-2593.
- Zhang L (2010) Hyperglycemia alters the schwann cell mitochondrial proteome and decreases coupled respiration in the absence of superoxide production. J Proteome Res9: 458-471.
- Centers for Disease Control and Prevention (2004) CDC: Prevalence of overweight and obesity among adults with diagnosed diabetes-USA, 1988-1994 and 1999-2002. MMWR. Morbidity and mortality weekly report 53: 1066-1068.
- Centers for Disease Control and Prevention (2011) National diabetes fact sheet: national estimates and general information on diabetes and prediabetes in the USA, 2011. Atlanta, GA: US Department of Health and Human Services, Centers for Disease Control and Prevention 201.
- Guilford BL, Ryals JM, Wright DE (2011) Phenotypic changes in diabetic neuropathy induced by a high-fat diet in diabetic C57BL/6 mice. Exp Diabetes Res2011: 848307.
- National Research Council (2011) Guide for the care and use of laboratory animals.
- Society for Neuroscience (2012) Guidelines for crisis management and responsible use of animals and humans in research.
- Yuen N (2008) Cerebral blood flow and cerebral edema in rats with diabetic ketoacidosis. Diabetes57: 2588-2594.
- Clapham DE (2003) TRP channels as cellular sensors. Nature426: 517-524.
- Caterina MJ (1997) The capsaicin receptor: A heat-activated ion channel in the pain pathway. Nature389: 816-824.
- Jordt SE, Julius D (2002) Molecular basis for species-specific sensitivity to "hot" chili peppers. Cell108: 421-430.
- Akude E (2011) Diminished superoxide generation is associated with respiratory chain dysfunction and changes in the mitochondrial proteome of sensory neurons from diabetic rats. Diabetes60: 288-297.
- Vincent AM (2004) Uncoupling proteins prevent glucose-induced neuronal oxidative stress and programmed cell death. Diabetes53: 726-734.
- Swerdlow RH (2011) Role and treatment of mitochondrial DNA-related mitochondrial dysfunction in sporadic neurodegenerative diseases. Curr Pharm Des17: 3356-3373.
- Liang H, Ward WF (2006) PGC-1-alpha: A key regulator of energy metabolism. AdvPhysiolEduc30: 145-151.
- Chowdhury SK, Smith DR, Fernyhough P (2013) The role of aberrant mitochondrial bioenergetics in diabetic neuropathy. Neurobiol Dis51: 56-65.
- Pfluger PT (2008) Sirt1 protects against high-fat diet-induced metabolic damage. ProcNatlAcadSci USA105: 9793-9798.
- Chalkiadaki A,Guarente L (2012) High-fat diet triggers inflammation-induced cleavage of SIRT1 in adipose tissue to promote metabolic dysfunction. Cell Metab16: 180-188.
- Huang TJ (2003) Insulin prevents depolarization of the mitochondrial inner membrane in sensory neurons of type 1 diabetic rats in the presence of sustained hyperglycemia. Diabetes 52: 2129-2136.
- Grote CW (2011) Insulin receptor substrate 2 expression and involvement in neuronal insulin resistance in diabetic neuropathy. Exp Diabetes Res2011: 212571.
- Kim DH (2002) mTOR interacts with raptor to form a nutrient-sensitive complex that signals to the cell growth machinery. Cell110: 163-175.
- Desai BN, Myers BR, Schreiber SL (2002) FKBP12-rapamycin-associated protein associates with mitochondria and senses osmotic stress via mitochondrial dysfunction. ProcNatlAcadSci USA99: 4319-4324.