Keywords
Diabetes mellitus; Insulin resistance; Reactive oxygen species; Antioxidants; Oxidative stress; Melatonin; Chromium picolinate
Introduction
Diabetes Mellitus (DM) is an endocrine disorder due to improper secretion of insulin or action of insulin regardless of hyperglycemia in the body. Improper secretion is due to destruction of pancreatic beta cells (β-cells); and improper action is due to inefficient insulin signaling mechanism to take glucose inside the tissues like liver, skeletal muscle, adipose tissue, brain, and a small part of cardiac tissue. Apart from genetic factors, contributing factors play a major role in the development of DM in an individual. The reasons are due to the existence of low antioxidant capacity in the endocrine part of the pancreas [1] and cytokine production. Reactive oxygen species (ROS), intake of high calorie diet, lack of physical activity, and improper sleep are few involved in the etiology of cytokine production. Cytokines increase the production of ROS [2]. This vicious cycle is one of the reasons to implicate insulin resistance and subsequent DM. In earlier work, we have shown the impact of high carbohydrate diet in inducing insulin resistance and further DM [3]. The present work is to know the effect of ROS in development of DM.
Hyperglycemia aggravates autoxidation of glucose; nonenzymatic glycation of bio-molecules (proteins, lipids and DNA) [2]; and alter nitric oxide (NO) [4] levels. Further, ROS increase will decrease antioxidant status [5]. Lower levels of superoxide dismutase (SOD) (EC 1.15.1.1), and catalase (CAT) (EC 1.11.1.6) lead to oxidative stress [6]. Melatonin (Mel) was also found to be decreased in diabetic patients [7]. Micronutrients including Zinc (Zn) and Chromium (Cr) are useful for insulin stabilization, packing of insulin into granules, and for insulin signaling mechanisms [8]. There are several potential sources of free radical production in DM that have shown to increase transition metal bio-availability [9]. It has been also shown that Zn and Cr levels decrease in DM [5,9,10]. This lower Zn and Cr levels are attributed to, following infection, hyperglycemia and stress respectively [11-13]. In addition, the availability of these transitional metals is inter-dependant between copper, iron, and manganese at the absorption level [8]. The antioxidant status also alters due to lower levels of micronutrients [8]. Therefore the methods that reduce hyperglycemia would possibly lead to decrease in ROS and improve antioxidant status. Restoring the status of micronutrients to near normal may be helpful to prevent insulin resistance and further development of DM and its complications [14].
Interestingly, nutritional supplements including ascorbic acid, α-lipoic acid, and vitamins have been marketed for decades to improve insulin resistance and to reduce oxidative stress in conjunction with hyperglycemia. However, the compounds which act as antioxidants should have redox cycling character (the ability to undergo reduction and oxidation repeatedly) to reduce free radicals. Vitamins react with ROS and themselves become pro-oxidants [15]. Pro-oxidants react with superoxide to generate highly reactive hydroxyl radicals. ROS also react with redox cycling metal ions, which might result in an increased free radical formation [16].
Supplements like chromium picolinate (CrPic) [16-23] when given to diabetic humans and diabetic rats have been reported to reduce blood glucose, total cholesterol (TC), and Triacylglycerols (TAGs), increase high-density lipoprotein cholesterol (HDLc), and improve antioxidant capacity in diabetics by insulin resistance attenuation. Melatonin (Mel) is secreted by the pineal gland and extra pineal sources are retina, cerebellum, gastrointestinal tract, and pancreas [24]. Mel also exerts antioxidant effects by counteracting hydroxyls, peroxynitrites, and peroxides, and thus regulating the synthesis of nuclear erythroid factor-2 (Nrf-2) derived antioxidant enzymes (e.g., SOD, CAT, GSH-peroxidase) [25-27]. Moreover, the role of Mel in diabetic patho-physiological mechanisms is affected by different trace elements including Zn [28] and Cr. The most vital point of Mel is that it does not undergo redox-cycling [29]. As a matter of fact, a question arises when CrPic and Mel increases the antioxidant action and genes expression, why cannot it improve bio-availability of micronutrients in the body. Therefore, the novelty of the present study is to understand the effect of CrPic and Mel in combination on alloxan induced diabetic rats (AID). The idea behind taking the combination is to test the effects of CrPic and Mel in conjunction as they are reputed for direct action on insulin resistance and oxidative stress and indirect action on antioxidant and insulin resistance respectively.
Materials and Methods
The experiment was performed after approval from the animal ethics committee (Reg. No. 401/RO/C/2001/CPCSEA) of Jawaharlal Nehru Medical College, Aligarh Muslim University, Aligarh, India. The study consisted of male Wistar rats, 16-22 weeks of age, and weighing around 130-160 grams. Animals were housed under standard laboratory conditions with a 12 hour light and 12 hour dark cycle. Before commencement of experiment, rats were given ten day period to acclimatize to the housing conditions. The rats were divided into five groups of six rats each. Group I rats were used as control. To the rest of the groups (Group II, III, IV, and V) alloxan monohydrate was given to induce diabetes (80 mg/kg) intra-peritoneal on the 12th day after rats were fasted overnight. Alloxan was freshly prepared prior to use with a concentration of 10% solution in 0.9% NaCl. Group III, IV, and V rats were given supplement of CrPic, Mel and CrPic+Mel supplementation and designated as alloxan+CrPic (Group III), alloxan+Mel (Group IV), and alloxan+CrPic+Mel (Group V). No supplement administration was given to group I and group II rats. CrPic and Mel were purchased from Health Aid Ltd, Middlesex and Aristo pharmaceuticals, India and dosage were given according to the studies respectively (3,6). Mel (200 μg/animal/day) was given to Group IV according to the dosage administered in studies. CrPic+Mel (1.2 μg/animal/day+200 μg/ animal/day) were given to Group V with a 30 min time interval between administrations of each compound. Each compound was dissolved in aqueous media and administered through oral route with the help of the gavage needle for a period of eight weeks and the preferred time of administration was in the morning between 9 AM and 11 AM. No allergic reactions were noted in the initial stages or in continuation of the experiment on account of supplementation. Groups were fed with the commercial balanced diet obtained from Provimi Healthcare Pvt Ltd and were provided water ad libitum. 100 grams of dietary contained 28%, 60%, and 12% of protein, carbohydrates, and fat respectively. The chromium content in the provided water was 0.1 mg/L or 100 ppb. Accucheck-glucometer was used to check the blood glucose levels with the whole blood drop obtained from tail vein, every week till the end of the experiment. The rats that sustained induction procedures and had blood glucose above 140 mg/dL were included into the study. The rodents were anesthetized by inducing chloroform inhalation, and then cervical dislocations were performed and they were sacrificed between 6 A.M. and 8 A.M. on the sixty-eighth day of the experiment after an overnight fast. Blood was collected through cardiac puncture into red top vacutainers. Allowed it to clot for 30-min and centrifuged (Model: Sigma 3-30K, Ser. No. 747052) at 3000 RPM in order to collect serum. Separated serum was made into aliquots and stored frozen at -80ºC for further determination of study variables. Analytical methods: For estimation of Cr and Zn [30], serum samples were diluted at ratio 1 (Perchloric acid) to 4 (0.01 mol/L nitric acid) parts and were prepared for atomic absorption spectrometry analysis (Model: AAS-4139). From the stock solutions (1000 ppm) of Cr and Zn, the calibration curve concentrations (20, 40, 60, 80, 100 nmol/L and 50, 100, 150, 200, 250 μg/dl) were freshly prepared by serial dilution respectively. The absorbance of the samples was read by atomic absorption spectrophotometer. TC, TAG, and HDLc were quantified by CHOD-PAP, GPO-POD, and PEG-PAP methods respectively. Kits were obtained from Avantor Performance Materials India Limited, Dehradun, Uttarakhand, India. The lipid variables were measured by Lablife chem-master semiautoanalyser. Low density lipoprotein (LDL) was calculated by Friedewald’s formula. Glycated hemoglobin (HbA1c) is measured by HPLC method with Bio-Rad instrument. Thiobarbituric acid reacting substances (TBARS) level was measured as an index of malondialdehyde (MDA) production and lipid peroxidation by the method of Ohkawa et al. [31]. Serum SOD activity was measured according to Marklund and Marklund method modified by Gavali et al. [32] by determining the reduction of pyrogallol by superoxide anion. CAT was performed by the method of Sinha et al. [33]. Nitric Oxide (NO) in serum was determined indirectly, by the measurement of stable decomposition products, nitrite and nitrate, employing the Griess reaction according to the method of Sun et al. [34]. Reduced glutathione (GSH) was determined by the method of Ellman’s [35]. Rat insulin ELISA kit obtained from Invitrogen technologies, U.S.A., was used to assay serum insulin levels, according to the protocol given in the instructions with Bio-Rad model 680 microplate reader. Melatonin was estimated using the radioimmunoassay kit obtained from LDN Labor Diagnostika Nord GmbH & Co. KG with the instrument I’acn videogamma/Rack, PC-RIA.MAS STRATEC. The homeostasis model assessment-estimated insulin resistance (HOMA-IR) was calculated, as proposed by Muniyappa et al. [36], using the following equation: The study variables procedures for standards and samples were performed in duplicate. The intra-assay and inter-assay coefficient variations were 5% to 10% during the assays respectively. HOMA-IR=(fasting glucose (mmol/L) × fasting insulin (μIU/mL)/22.5 Histopathology: Peritoneum was stripped open and pancreas, liver, and kidney of each rat were removed, washed with normal saline, and immersion-fixed in 10% formal saline immediately upon removal. These tissues were dehydrated, cleaned and embedded in paraffin to obtain sections. They were stained with hemotoxylin and eosin for histological examination according to standard procedures [37].
Statistical Analysis
IBM SPSS version 20 was used to perform statistical analysis using one way analysis of variance (ANOVA), followed by Tukey’s multiple comparison test to compare means between the different supplemented groups and significance was calculated at 95% confidence limit.
Results
Alloxan-treated rats (group II) showed a significant change in blood glucose (366.7 mg%) compared to untreated control rats (88.1 mg%). On the contrary, the serum insulin levels were decreased in group II, III, IV, and V rats as compared with control rats by 55.6%, 47.7%, 47.1%, and 47.7% respectively. Group III, IV, and V rats showed significant decrease in HOMA-IR compared with group II rats. The percentage decrease in weights was higher in group II than in the group III and V rats. Conversely, we observed a percentage increase of weight from the baseline in the group IV rats (3%) and in the control group rats (15.5%) by the end of present study.
Serum TC, TAGs and LDL levels were elevated by 52.1%, 51.1% and 50.1% respectively, and the serum HDLc was reduced by 27.4% in group II, compared with group control rats (Table 1). Nevertheless, after 8-weeks, we observed significant changes in group III, IV, and V rats compared with group II in the serum levels of TC, TAG, and HDLc (Table 1). Serum Cr was reduced in group II rats compared with untreated (control) rats. With treatment the level was significantly increased in group IV and V rats respectively but not in group III compared with alloxantreated rats (group II).
| Variables |
Group I (Untreated; n=6) |
Group II (alloxan treated; n=6) |
Group III (alloxan+CrPic treated; n=6) |
Group IV (alloxan+Mel
treated; n=6) |
Group V (alloxan+CrPic+Mel treated; n=6) |
| Glucose (mg/dL) |
88.1±2.12 |
366.7±18.9a |
263.2±31.8a,b |
215.6 ± 43.8a,b,c |
235.7±44.1a,b |
| Insulin (µIU/mL) |
35.2±4.4 |
15.67±2.6a |
18.4±3.8 a |
19.6±2.1a |
18.4±1.3a |
| HbA1c% |
5.2±0.2 |
8.1±0.4 a |
7.3±1.2 |
6.7±1.8 |
6.9±1.3 |
| HOMA-IR |
7.6±0.9 |
14.8±2.8 a |
11.7±1.7a,b |
10.1±1.9a,b |
10.7±0.9a,b |
| Body weight (grams) |
175.5±6.76 |
149.5±8.71 |
154.5±7.24 |
150.3±3.23 |
154.1±5.5 |
| TC (mg/dL) |
139.7±8.9 |
212.8±19.7 a |
182.5±10.4a,b |
169.1±17.1a,b |
170.1±11.2a,b |
| TAG (mg/dL) |
132.3±2.8 |
198.8±33.8a |
155.8±5.8a,b |
161.8±10.4a,b |
164.5±14.5a,b |
| HDL (mg/dL) |
42.8±2.4 |
23.8±2.4 a |
28.5±2.1a,b |
29.8±2.8 a,b |
29.3±2.5a,b |
| LDL (mg/dL) |
73.2±4.9 |
142.4±9.6 a |
122.8±7.1a,b |
105.8±11.8a,b,c |
116.9±5.7a,b |
| Cr (ng/mL) |
4.9±0.5 |
2.8±0.2 a |
2.9±0.07a |
3.7±0.05a,b,c |
3.1±0.06a,b,c,d |
All values expressed in mean ± SE
a Compared with group I
b Compared with group II
c Compared with group III
d Compared with group IV
P<0.05
Table 1 Effects of alloxan, chromium picolinate and melatonin alone or in combination on body weight, blood glucose and lipid variables in male Wistar rats
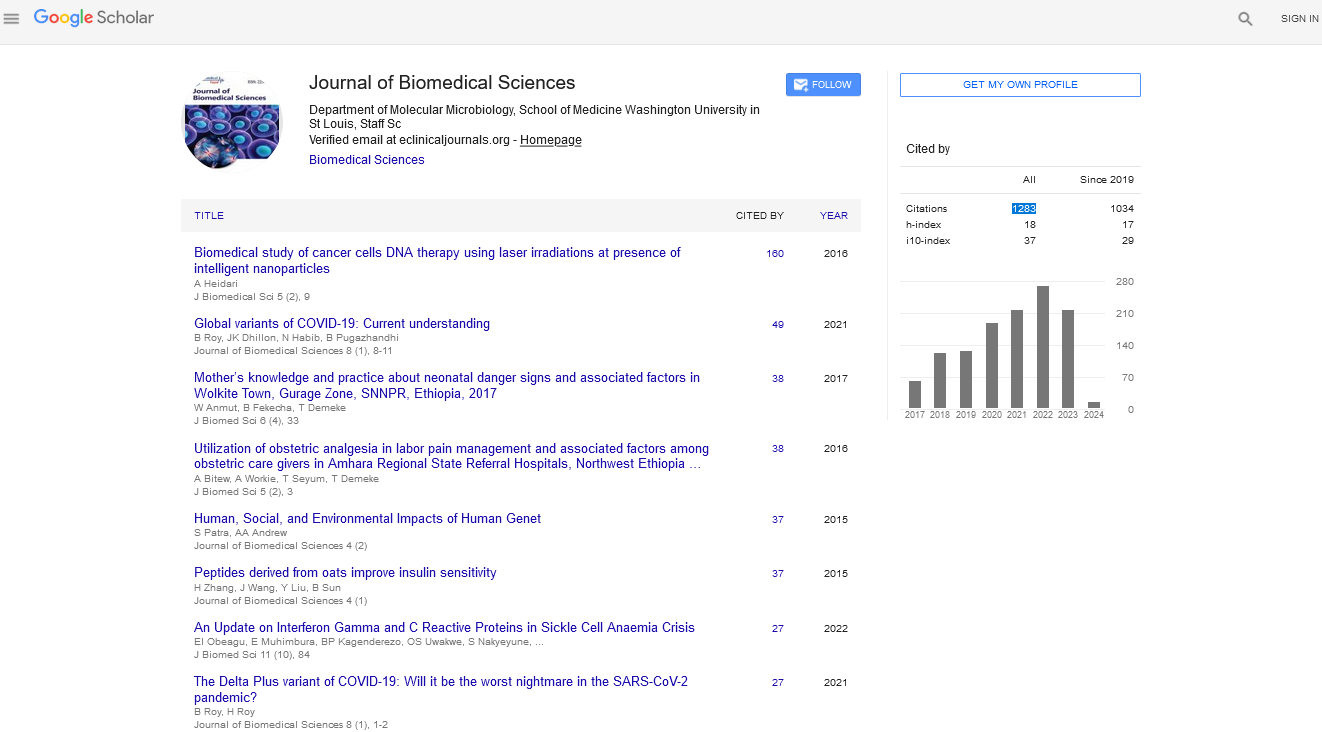
Lipid peroxides (MDA) levels were low and NO levels were higher in the control and group IV rats than in the group AID rats (Figure 1). Treatment with CrPic (group III), Mel (group IV) and CrPic+Mel (group V) in the alloxan-treated rats decreased MDA and increased NO levels compared with group II rats (Figure 1).
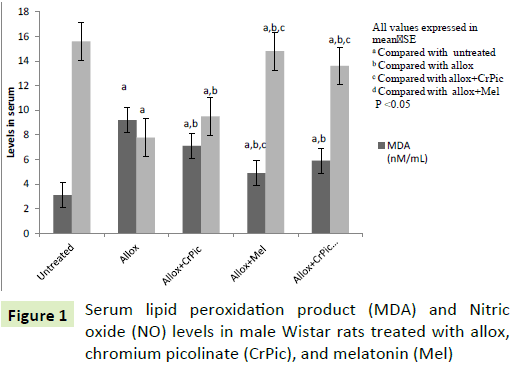
Figure 1: Serum lipid peroxidation product (MDA) and Nitric oxide (NO) levels in male Wistar rats treated with allox, chromium picolinate (CrPic), and melatonin (Mel)
Group II rats had decreased levels of SOD, CAT and GSH, compared with control rats (Figure 2). Group III, IV, and V rats showed significant differences in serum levels of SOD, CAT, and GSH when each group was compared with group II (Figure 2). We also observed insignificant differences in serum levels of SOD and GSH in group IV and V rats compared with group control rats respectively.
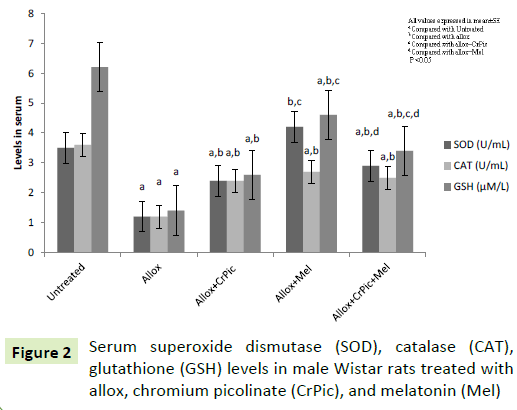
Figure 2: Serum superoxide dismutase (SOD), catalase (CAT), glutathione (GSH) levels in male Wistar rats treated with allox, chromium picolinate (CrPic), and melatonin (Mel)
Serum Mel and Zn levels (Figure 3) were decreased in group II rats compared with control rats. Mel-supplementation increased serum Mel and Zn levels in the alloxan-treated rats when compared with group II rats. Interestingly, CrPic treatment also increased serum Mel level in alloxan treated rats. On physical examination, we observed that the Mel-administered rats were active during the supplementation period.
Figure 3: Serum melatonin (Mel) and zinc (Zn) levels in male Wistar rats treated with alloxan, chromium picolinate (CrPic) and melatonin (Mel)
Pancreas histology
The control group rats pancreas had normal acinar architecture. Within acinar cells, islets were enclosed. Islets were covered by capsule. In group II rats, pancreas showed more necrosis and shrunken islet of Langerhans cells (4B). The acinar cells around islets though seem to be in normal proportion, but do not look classical. Administration of CrPic (4C), Mel (4D), and CrPic+Mel (4E) in alloxan-treated rats for eight weeks had relatively normal exocrine pancreatic acinar architecture and pancreatic islets. There was no inflammation (Figure 4).
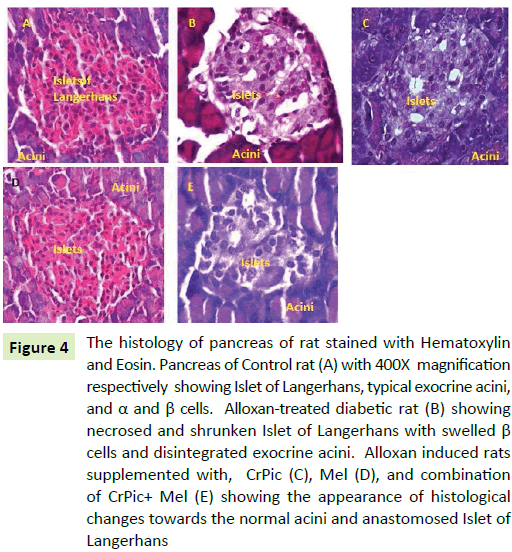
Figure 4: The histology of pancreas of rat stained with Hematoxylin and Eosin. Pancreas of Control rat (A) with 400X magnification respectively showing Islet of Langerhans, typical exocrine acini, and α and β cells. Alloxan-treated diabetic rat (B) showing necrosed and shrunken Islet of Langerhans with swelled β cells and disintegrated exocrine acini. Alloxan induced rats supplemented with, CrPic (C), Mel (D), and combination of CrPic+ Mel (E) showing the appearance of histological changes towards the normal acini and anastomosed Islet of Langerhans
Liver histology
The liver in control rats had normal histology with normal hepatocellular architecture and normal central vein. Hepatocytes have pink eosinophilic cytoplasm with mostly central single nucleus. The cells showed well defined borders, were polygonal, and arranged in sheets. Liver sinusoids were not dilated. Group II livers (5B) had altered histology with significant change in hepatocellular architecture. The cells were irregular in size, shape and orientation in which necrotic Hepatocytes and dilated sinusoids were seen. In the groups treated with CrPic, Mel, and CrPic+Mel, the liver morphology showed lowered incidence and intensity of the changes compared with group II rat liver. Sinusoids appear to be slightly congested with relatively less hepatocellular degeneration compared with group II rats (Figure 5).
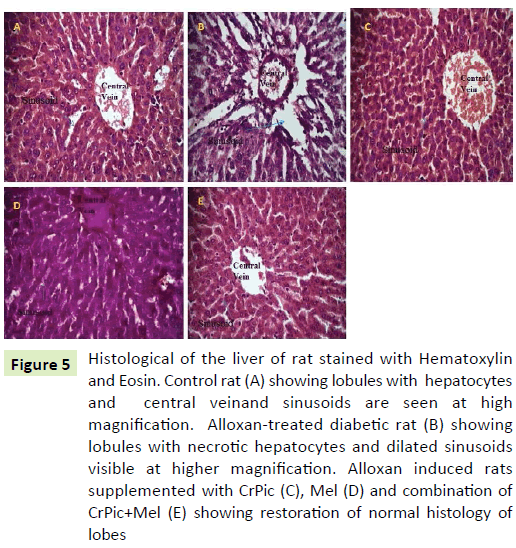
Figure 5: Histological of the liver of rat stained with Hematoxylin and Eosin. Control rat (A) showing lobules with hepatocytes and central veinand sinusoids are seen at high magnification. Alloxan-treated diabetic rat (B) showing lobules with necrotic hepatocytes and dilated sinusoids visible at higher magnification. Alloxan induced rats supplemented with CrPic (C), Mel (D) and combination of CrPic+Mel (E) showing restoration of normal histology of lobes
Renal histology
The control group kidney showed normal renal tubular architecture, which was non-dilated. The glomerulus was normal with a normal urinary space. The alloxan treated rats (group II) kidney (6B) showed an architecture with degenerative changes in the Bowman’s space and urinary space dilated and also necrosis tubular wall. Administration of CrPic to alloxan-treated rats (group III) for the period of eight weeks, we observed renal tubules were slightly distorted. The Mel and its combination with CrPic when given to alloxan treated rats (group V) for the period of eight weeks showed relatively normal renal tubules (Figure 6).
The effect of Mel was more pronounced on the study parameters in the alloxan+Mel-, alloxan+CrPic+Mel- and alloxan+CrPictreated rats in that order.
Discussion
The observations demonstrated that reduced hyperglycemia led to decrease in ROS and improved antioxidant status, including Cr and Zn levels. However, we did not observe a significant difference in the serum insulin level after administration with CrPic and Mel either in alone or in combination to alloxan induced rats.
i) Changes in blood and in tissues due to ROS: The necrosis and shrunken islet of Langerhans with disoriented structure in alloxantreated rats are due to alloxan. Further, the hyperglycemia is the result of lower insulin level. The death of islets of Langerhans is the reason for lower insulin level in alloxan-treated rats. ROS are responsible for the death of β-cells as islets possess a lower antioxidant capacity [38]. It is clearly documented in literature that the administration of alloxan results in the destruction of β-cells of pancreas giving rise to hyperglycemia [38]. Szudelski has shown that alloxan generates ROS in a cyclic reaction along with dialuric acid [38].
Depletion of beta cells will therefore result in insulin deficiency, which will further lead to a disorder in carbohydrate, protein, and lipid metabolism [8]. Dyslipidemia observed in the present study is due to persistent hyperglycemia. The continuous availability of glucose probably activated lipogenic enzymes in alloxan-treated rats. Several reports observed dyslipidemia in stressful and diseased conditions including DM [8,17,39,40]. Matsuzaka et al. demonstrated in streptozotocin-induced insulin-depleted mice that sterol regulatory binding proteins (SREBP) induction does not require insulin [41]. Previous studies have shown that in several models of insulin resistance animals hepatic SREBP-1c lipogenic transcription factor expression is activated [42,43]. Furthermore, these studies have also shown that glucose is required for lipogenic enzymes where insulin plays only a permissive role.
The cell membranes are made of lipid bilayers. MDA is an index of lipid peroxidation [2,5,8] and is the result of ROS attack on lipids [8]. Insulin resistance is experienced at the cell membranes by the insulin receptors [17]. In the present study, increased ROS added an insult to dyslipidemia, which raised the levels of MDA and increased HOMA-IR in alloxan-treated rats. The altered architecture of hepatocytes of alloxan-treated rats is the result of increased ROS attack on lipid membranes. Increased production of ROS in diabetes would be capable of initiating tissue damage in liver, along with pancreas [44,45]. Studies suggest that cellular oxidative stress plays a crucial role in the genesis of hyperglycemia related tissue changes [2].
In the present study, hyperglycemia resulted in lower levels of Zn and Cr in alloxan-treated rats. The exact explanation for this has not yet been worked out. But, the possible reason could be that Zn and Cr are transition elements and exist in different oxidation states. In hyperglycemia and DM continuous production of ROS is observed [2]. The ROS are highly reactive and electron deficient, when react with double bond molecules or transition elements, ROS makes such molecules or elements unstable. Stohs et al. postulated that intracellular Cr+3 can be reduced to Cr+2 generating hydroxyl radical [46]. The report [46] shows that there is a conversion of ionic states of transition elements. Reports have shown decreased Zn and Cr levels in patients with DM [10,12,21,47].
Continuous availability of hyperglycemia and increased ROS aggravate glycation process [2,9]. The glycation hampers the functionality of proteins [2]. Glycation of proteins also takes place in the presence of oxidative stress [2]. In the present study, increased HbA1c level in alloxan-treated rats indicates glycation of hemoglobin. This is due to decreased SOD, CAT, GSH, and Mel levels in alloxan treated rats. Consumption of antioxidants and also lesser activity of antioxidants in clearing ROS are the possible reasons for oxidative stress in alloxan-treated rats.
In the present study lower serum NO levels are responsible for the increased urinary space in the alloxan-treated rats. A study reported that a decrease in SOD in diabetic rats subsequently caused a rapid reaction between superoxide and NO to form peroxynitrite [48]. The formation of peroxynitrite, which is a highly reactive radical is correlated with DM [2]. Continuous production of peroxynitrite radicals inhibits NO formation [2,6]. Studies on the induction of diabetes by alloxan also revealed lower NO levels in RBC and plasma [6,49]. In addition, AGEs formation seems to have the capacity to suppress the expression of constitutive NO synthase activity [6,48,49]. Therefore in the present study, NO depletion and defective tissue changes may be due to decreased protein expression or increased NO removal as a result of peroxynitrite formation.
ii) Ameliorating effect of supplementation on ROS induced blood and tissue alterations: Cumulative effect of ROS, low insulin, and hyperglycemia are responsible for the changes observed in alloxan-treated rats.
Effect of CrPic
In the present study, we observed relatively normal pancreas histology after administration of CrPic to alloxan induced rats for eight weeks. This suggests that CrPic has protection on the β-cells against alloxan induced ROS. The present study also suggests that preserving endocrine architecture of pancreas reduces hyperglycemia, dyslipidemia, and enhances antioxidant status. Decrease in MDA infers less ROS attack on lipids, which further improves insulin resistance. Discussed action is seen in the histology of liver as we observed relatively normal structure after administration of CrPic for eight weeks. The decrease in ROS and glucose levels reduced hepatocyte damage, which is quite possible as we observed improved antioxidant status including SOD, CAT, GSH, and Mel levels in the present study. The detected significant readings of the antioxidant parameters could be due to the stimulatory effect of CrPic on improving Mel levels. Alleviation of GSH improves intracellular reduced state which prevents the formation of peroxynitrite. The increase in the serum Mel level produced an additive response to the effect of CrPic resulting in significant improvement in serum antioxidants, Zn and NO levels compared to alloxan-treated rats without supplementation. Subsequently as a result relatively normal glomerulus of kidney was observed. These findings are consistent with other studies [17-23] suggesting that improving insulin resistance enhances the uptake of glucose at insulin sensitive tissues. It has been proposed that Cr application can modulate the activity of insulin at the insulin sensitive tissues [17]. Insulin stimulates glycogen synthesis and inhibits cholesterol synthesis [8]. Insulin prevents lipolysis; and increases intracellular TG synthesis thus decreasing extracellular lipid [19-21] and subsequently decreases the tendency to extracellular lipid peroxidation. A study reported a significant increase in antioxidants SOD, CAT, and GSH after application of Cr in the form of CrPic [18,23]. However, it is important to note that the decreased levels of insulin following alloxan administration did not change significantly after CrPic supplementation. This could likely be due to increase in extraction of insulin by the liver due to lower insulin resistance which is evident from the significant change in HOMA-IR in CrPic supplemented rats. Guan et al. [50] observed supplementation of Cr in the form of yeast improved the extraction of insulin by liver in pigs.
Effect of Mel
After Mel administration, we observed an increase in serum Mel levels, which enunciated that there is a decrease in ROS. Therefore, the increase in Mel reduced lipid peroxidation product (MDA) and also resultant hyperglycemia. Moreover, Mel administration for eight weeks prevented the histological changes in pancreas and liver. The authors also observed a significant increase in the serum levels of SOD, CAT, and GSH in alloxan-treated rats when administered with Mel. Mel is known to dispose glucose from the blood [3,24,49]. Further, it is reported that absence of Mel induces insulin resistance and night time hepatic insulin resistance, increased gluconeogenesis, thus establishing a connecting link between Mel and insulin secretion [24,25]. Considered in the light of previous study findings [6,24-29,48], the present study findings suggest improving Mel level reduces oxidative stress and reduces hyperglycemia. There are many hypotheses regarding Mel action on oxidative stress [6,26-29]. Studies have reported that Mel enhances the activity of SOD, CAT and glutathione peroxidase (GSH-Px) [28,29]. A study showed Mel express nuclear erythroid factor-2 gene, which is responsible for the production of antioxidants, including SOD, CAT, and GSHPx [29]. Previous studies have reported Mel through electron donation directly reduces hydrogen peroxide, superoxide, and peroxynitrite radicals [25]. Moreover, the preservation of intracellular reduced state increases the GSH levels [3] and also a normal expression of antioxidant genes [2].
Supplementation of Mel to alloxan induced rats improved Cr level. This is the first study to observe this finding and infer due to decrease in glucose and ROS levels after supplementation to alloxan induced rats.
A significant increase in Zn and NO levels were also observed in Mel administered alloxan induced rats compared with alloxan-treated rats. The urinary space has been restored to relatively normal in alloxan induced rats after treatment with Mel. Studies have demonstrated Mel enhances the absorption of Zn from the intestines [51,52]. Baltaci et al. [52] reported that Mel administration increased plasma Zn levels even in pinealactomized rats. There are no reports to the best of our knowledge to show the effect of CrPic or Mel on NO levels in alloxan induced rats.
Effect of CrPic+Mel
The effect of this combination is due to the synergistic action of the compounds.
Conclusion
There is no connecting link between Cr and Mel in the present literature, but from these study findings, the authors could possibly relate that reducing oxidative stress and resultant hyperglycemia and dyslipidemia leads to improvement of Mel levels in the serum. CrPic and Mel alone or in a combination prevented pathological alterations in the serum and in tissues due to their insulin-sensitizing, anti-dyslipidemia, and antioxidant activity.
Conflict of Interest
The authors declare that they have no conflict of interest.
Acknowledgement
We would like to thank Dr. Tony George, Research assistant, Anatomy Department, All India Institute of medical sciences, who has helped the authors in reading the histology slides.
17684
References
- Zephy D, Ahmad J (2015) Type 2 diabetes mellitus: role of melatonin and oxidative stress.Diabetes MetabSyndr 9: 127-131.
- Niedowicz DM, Daleke D (2005)The role of oxidative stress in diabetic complications. Cell BiochemBiophys 43: 289-330.
- Doddigarla Z, Ahmad J, Parwez I (2016) Effect of chromium picolinate and melatonin either in single or in a combination in high carbohydrate diet?fed male Wistar rats.BioFactors42: 106-114.
- Szabó C, Ischiropoulos H, Radi R (2007)Peroxynitrite: biochemistry, pathophysiology and development of therapeutics.Nat Rev Drug Discov 6: 662-680.
- Wolff SP, Jiang ZY, Hunt JV (1991) Protein glycation and oxidative stress in diabetes mellitus and ageing.Free RadicBiol Med 10: 339-352.
- Sailaja Devi MM, Suresh Y, Das UN (2000) Preservation of the antioxidant status in chemically?induced diabetes mellitus by melatonin. J Pineal Res 29: 108-115.
- Zephy D, Parwez I, Ahmad J (2016) A hospital based study on correlation between hyperglycemia, glycated hemoglobin, lipid and oxidative stress variables in type 2 diabetes mellitus subjects: a cross sectional analysis. World J Phar Res 5: 729-736.
- Vasudevan DM (2010) Textbook of Biochemistry. Jaypee Brothers Medical Publishers, New Delhi, 6th edition pp: 429-431.
- ViktorínováA,ToserováE,KrizkoM,DurackováZ (2009)Alteredmetabolismofcopper,zinc,andmagnesiumisassociated withincreasedlevelsofglycatedhemoglobininpatientswith diabetesmellitus.Metabolism58: 1477-1482.
- Kazi TG, Afridi HI, Kazi N (2008) Copper, chromium, manganese, iron, nickel, and zinc levels in biological samples of diabetes mellitus patients.Biol Trace Elem Res 122: 1-18.
- Doddigarla Z, Bhaskar MV, Lingidi JL, Ashraf R (2013) Evaluation of zinc, copper and oxidative stress in HIV seropositive cases. HIV & AIDS Review 12: 79-81.
- Ekmekcioglu C, Prohaska C, Pomazal K (2001) Concentrations of seven trace elements in different hematological matrices in patients with type 2 diabetes as compared to healthy controls.Biol Trace Elem Res 79: 205-219.
- Kozlovsky AS, Moser PB, Reiser S, Anderson RA (1986) Effects of diets high in simple sugars on urinary chromium losses. Metabolism 35: 515-528.
- Cunningham JJ (1998) Micronutrients as nutriceutical interventions in diabetes mellitus. J Am Col Nutr 17: 7-10.
- Poljšak B, Gazdag Z, Jenko?Brinovec Š (2005) Pro?oxidative vsantioxidative properties of ascorbic acid in chromium (VI)?induced damage: an in vivo and in vitro approach.J Appl Toxic 25: 535-548.
- Kornweitz H, Burg A, Meyerstein D (2015) Plausible Mechanisms of the Fenton Like Reactions, M=Fe (II) and Co (II), in the Presence of RCO2-Substrates: Are OH. Radicals Formed in the Process.J Physic Chem A 119: 4200-4206.
- Anderson RA, Cheng N, Bryden NA (1997) Elevated intakes of supplemental chromium improve glucose and insulin variables in individuals with type 2 diabetes. Diabetes 46: 1786-1791.
- Anderson RA, Roussel AM, Zouari N (2001) Potential antioxidant effects of zinc and chromium supplementation in people with type 2 diabetes mellitus. J Amer Col Nutr 20: 212-218.
- Offenbacher EG, Rinko CJ, Pi-Sunyer FX (1985)The effects of inorganic chromium and brewer's yeast on glucose tolerance, plasma lipids, and plasma chromium in elderly subjects.Am J ClinNutr 42: 454-461.
- Thomas VL, Gropper SS (1996) Effect of chromium nicotinic acid supplementation on selected cardiovascular disease risk factors.BiolTrac Elem Res55: 297-305.
- Uusitupa MI, Mykkänen L, Siitonen O (1992) Chromium supplementation in impaired glucose tolerance of elderly: effects on blood glucose, plasma insulin, C-peptide and lipid levels.Brit J Nutr 68: 209-216.
- Sahin K, Tuzcu M, Orhan C (2013) Anti-diabetic activity of chromium picolinate and biotin in rats with type 2 diabetes induced by high-fat diet and streptozotocin. Brit J Nutr 110: 197-205.
- Sundaram B, Aggarwal A, Sandhir R (2013) Chromium picolinate attenuates hyperglycemia-induced oxidative stress in streptozotocin-induced diabetic rats.J Trace Elem MedBiol 27: 117-121.
- Acuña-Castroviejo D, Escames G, Venegas C (2014)Extrapineal melatonin: sources, regulation, and potential functions.CelMol life sci 71: 2997-3025.
- Reiter RJ, Tan DX, Osuna C, Gitto E (2000) Actions of melatonin in the reduction of oxidative stress.J Biomed Sci 7: 444-458.
- Zhang H.M, Zhang Y (2014) Melatonin: a well-documented antioxidant with conditional pro-oxidant actions. J Pineal Res 57:131-146.
- Manchester LC,Coto-Montes A, Boga JA (2015) Melatonin: an ancient molecule that makes oxygen metabolically tolerable. J Pineal Res 59: 403-419.
- Navarro-Alarcon M, Ruiz-Ojeda FJ, Blanca-Herrera RM, Agil A (2013) Antioxidant activity of melatonin in diabetes in relation to the regulation and levels of plasma Cu, Zn, Fe, Mn, and Se in Zucker diabetic fatty rats. Nutrition 29: 785-789.
- Hamid AA, AiyelaagbeOO, Usman LA, Ameen OM, Lawal A (2010) Antioxidants: Its medicinal and pharmacological applications. Afr J Pure App Chemi 4: 142-151.
- Zasoski RJ, Burau RG (1977) A rapid nitric?perchloric acid digestion method for multi?element tissue analysis.Commun Soil Sci Plant Anal 8: 425-436.
- Ohkawa H, Nobuko O, Yagi K (1978) Reaction of linoleic acid hydroperoxide with thiobarbituric acid.J Lip Res 19: 1053-1057.
- Gavali Y,Deore D, Surwase SP, Zingade U (2011) Study of the serum superoxide dismutase levels in smoking and non-smoking patients with COPD. Int J Rec Trends Sci Tech 5: 121-126.
- Sinha AK (1972) Colorimetric assay of catalase. AnalyBiochem 47: 389-394.
- Sun J, Zhang X, Broderick M, Fein H (2003) Measurement of nitric oxide production in biological systems by using Griess reaction assay. Sensors 3: 276-284.
- Ellman M (1959) Aspectrophotometric method for determination of reduced glutathione in tissues.AnalytBiochem 74: 214-226.
- Muniyappa R, Lee S, Chen H, Quon MJ (2008) Current approaches for assessing insulin sensitivity and resistance in vivo: advantages, limitations, and appropriate usage.Am J PhysiolEndocrin Met294: E15-E26.
- Lillie RD (1954)Histopathologic technic and Practical Histochemistry. Mcgraw-Hill Company, Toronto p:114.
- Szkudelski T (2001)The mechanism of alloxan and streptozotocin action in B cells of the rat pancreas.Physiol Res 50: 537-546.
- JhansiLakshmi L, Eli M, Doddigarla Z, Suchitra K (2013) Serum lipids and oxidative stress in hypothyroidism. Journal of Advance Researches in Biological Sciences 5: 63-66.
- Zephy D, Lakshmi LJ, Ashraff R (2016) Lipid Profile among Art Treated and Untreated Patients in HIV Positive Cases. Archives of Medicine.
- Matsuzaka T, Shimano H, Yahagi N (2004) Insulin-independent induction of sterol regulatory element-binding protein-1c expression in the livers of streptozotocin-treated mice.Diabetes 53: 560-569.
- Matsumoto M, Ogawa W, Teshigawara K (2002) Role of the insulin receptor substrate 1 and phosphatidylinosi-tol 3-kinase signaling pathway in insulin-induced expression of sterol regulatory element-binding protein 1c and glucokinase genes in rat hepa-tocytes. Diabetes 51: 1672-1680.
- Shimomura I, Matsuda M, Hammer RE (2000) Decreased IRS-2 and increased SREBP-1c lead to mixed insulin resistance and sensitivity in livers of lipodystrophic and ob/ob mice. Mol Cell 6: 77-86.
- Bloch-Damti A, Bashan N (2005) Proposed mechanisms for the induction of insulin resistance by oxidative stress.Antiox Red Sig 7: 1553-1567.
- Khan SM (2006) Protective effect of black tea extract on the levels of lipid peroxidation and antioxidant enzymes in liver of mice with pesticide?induced liver injury.Cell BiochemFunc 24: 327-332.
- Stohs SJ, Bagchi D (1995) Oxidative mechanisms in the toxicity of metal ions.Free Rad Biol Med 18: 321-336.
- Doddigarla Z, Parwez I, Ahmad J (2016) Correlation of serum chromium, zinc, magnesium and SOD levels with HbA1c in type 2 diabetes: a cross sectional analysis. Diabetes MetabSyndr 10: S126-S129.
- Szabó C, Ischiropoulos H, Radi R (2007) Peroxynitrite: biochemistry, pathophysiology and development of therapeutics.Nat Rev Drug Disc6: 662-680.
- MontillaPL, Vargas JF, Túnez IF (1998) Oxidative stress in diabetic rats induced by streptozotocin: protective effects of melatonin.J Pineal Res 25: 94-100.
- Guan X, Matte JJ, Ku PK, Snow JL, Burton JL, Trottier NL (2000) High chromium yeast supplementation improves glucose tolerance in pigs by decreasing hepatic extraction of insulin.Nutrition 130: 1274-1279.
- Baltaci AK, Mogulkoc R, Kul A (2004)Opposite effects of zinc and melatonin on thyroid hormones in rats.Toxicol 195: 69-75.
- Baltaci AK, Mogulkoc R (2007)Pinealectomy and melatonin administration in rats: their effects on plasma leptin levels and relationship with zinc.ActaBiol Hung 58: 335-343.