Keywords
HIV adult patients; Nutritional status; Body weight; BMI; ART; Developing countries
Introduction
HIV is an immunodeficiency causing infection affecting 36.9 million people worldwide, of whom 95% live in developing countries [1]. Two-thirds of people living with HIV (PLHIV) in developing countries reside in sub-Saharan Africa, and the remaining live in Asia, Latin America and the Pacific [1,2].
Under nutrition is a significant determinant for poor prognosis in HIV positive patients in developing countries [3-6]. It is also a strong predictor of mortality amongst this population [1,2,7-10]. In contrast, people at all stages of HIV infection are at risk of impaired nutritional status because: (i) the disease affects nutrient absorption and utilization, (ii) affected people require higher protein and micronutrients, (ii) the disease reduces individuals’ food intake, and (iv) medications’ side effects affect the appetite, further reducing food intake [3,11,12]. The above complex mechanisms often lead to weight loss and malnutrition, further compromising immunity and susceptibility to opportunistic infections [13,14]. Weight loss itself has been widely associated with adverse outcomes in HIV and is recognized as a risk factor for AIDS-related mortality [4,5,10,13,15]. Impaired nutritional status amongst PLHIV in developing countries is further compounded by insufficient food consumption on a regular basis due to food insecurity [11].
Food insecurity is the shortage of both adequate (quantity) and quality food, and in poor resource settings, corresponds with high prevalence of under nutrition and HIV [11]. Food insecurity contributes to illnesses and low productivity leading to a vicious cycle of low socioeconomic status for individuals living with HIV and their caregivers [16]. For individuals and families affected by HIV, they have shortage of labour due to sickness and caring for family members, which in turn lead to low productivity and food insecurity [7,8].
High HIV prevalence in developing countries and the current knowledge about the complex interactions between HIV, under nutrition and food insecurity have propelled governments, nongovernment organisations and other partners into promoting several interventions to improve the nutritional status of PLHIV [15]. A number of HIV interventions providing food support to HIV patients in the form of free food packages and nutritional supplements have been implemented in developing countries where HIV and food scarcity are prevalent [6,13,17-22].
The evaluation of the effectiveness of food support interventions in improving the nutritional status of PLHIV in developing countries is therefore necessary to provide evidence that can be used to inform appropriate practices and policies in resourcelimited settings. This review aimed to answer the following research question: How effective are food support interventions (in the form of free food packages or nutritional supplements) in improving the nutritional status (weight and BMI) of adults living with HIV who are on antiretroviral therapy (ART) in developing countries?
Method
Search strategy
A systematic search of English language publications between 1st January 1998 and 3rd November 2015 was performed in November 2015. Databases including PubMed, CINAHL, Cochrane library and Embase were searched. Inclusion criteria comprised: (i) Quantitative studies conducted in English, (ii) studies evaluating the effectiveness of nutritional supplements/food support in combination with ART interventions to improve the nutritional status of PLHIV, (iii) Studies recording body weight and/or BMI as the outcome measures, (iv) Studies involving HIV-positive adults (18 years or over), (v) Studies conducted in developing countries defined according to their Gross National Income (GNI: US$ ≤ 11,905 per capita per year) [23], (vi) Studies published between 1998 and 2015 as interventions to improve of PLHIV’s quality of life increased after the introduction of highly active antiretroviral therapy (HAART) in 1997. Studies involving children, studies evaluating the effectiveness of food support as standalone or not in combination with ART, studies evaluating effectiveness of nutritional education and counseling as interventions, and studies conducted in developed countries were excluded.
Data extraction and analysis
Data from the selected studies were extracted and summarized in three tables. Zaza and colleagues [24] standardized form was used for data abstraction, which followed three steps including:
(i) Summarizing general characteristics of the selected studies including: location, design, number of participants’ baseline characteristics, the interventions, duration, and outcomes of interest of each study (Table 1).
| Study |
Location |
Design |
Number of Participants |
Characteristics of the participants |
Intervention |
Duration |
Outcomes of interest |
| Cantrell et al. |
Lusaka, Zambia |
Prospective study |
*N=636
**FS=442
Control=194 |
Gender
FS: 282 females
160 males Control: 132 females
62 males Age/years (mean)
FS=36.5
Control=36.4 |
6.2 kg of micronutrient-fortified corn-soy blend, vegetable oil, maize meal, and beans per month 970 kcal, 28 g protein and 23 g fat/day Family food ration provided |
12 months
(6 monthly measurements) |
Weight Adherence to ART |
| Rawat et al. |
Uganda |
Retrospective study |
N=1,666
FS=546
Control=1,120 |
Gender and age -Information not provided |
Corn-soy blended flour, vegetable oil +/-pulses and maize meal or rice |
12 months |
Weight |
| Ivers et al. |
Central Haiti |
Prospective study |
N=593
FS=299
Control=294 |
Gender
Information not
provided Age/years (mean)
FS=37
Control=35 |
50 g cereal, 50 g dried legumes,
25 g vegetable oil, 100 g corn-soy blend and 5 g iodized salt per day Family food ration provided |
12 months
(6 monthly measurements) |
Body Mass Index (BMI) |
| Serrano et al. |
Niamey, Niger |
Prospective study with a historical control group |
N=180
FS=62
Control=118 |
Gender
FS: 43 female
19 males Control: 45 females
73 males Age/years (median)
FS=38
Control=38.5 |
100 g of cereal,
50 g of legumes (dry peas and not containingvegetables) and 30 g of vegetable oilstrengthened with vitamin A per day Family food ration provided |
6 months
(monthly measurements) |
BMI Adherence to ART |
| van Oosterhout et al. |
Blantyre, Malawi |
Retrospective study with a historical group |
N=593
CSB=245
RUFS=244
Control=104 |
Gender
CSB: 142 females
103 males RUFS: 151 females
93 males Control: 50 females
54 males Age/years (median)
CSB=36
RUFS=36
Control=36 |
Corn-soyblend (CSB)
1360 kcal, 50 g protein/day Ready-to-use food spread (RUFS)
1360 kcal, 35.5 g protein/day Both supplements were fortified with vitamins and minerals.
|
14 weeks
(measurements at 26 weeks but no FS) |
BMI Weight Adherence to ART |
| Ahoua et al. |
Kenya, Uganda |
Retrospective study |
N=1106
No control group |
Gender
627 females
479 males Age/ years (median)=33 |
Four sachets of a nutritional supplementt called Plumpy’nut per day 2000 kcal/day |
Average length - 3.3 months |
BMI Weight |
| Evans et al. |
Johannesb-urg, South Africa |
RCT
(pilot study) |
N=38
FS=19
Control=19 |
Gender
FS: 13 females
6 males Control: 12 females
7 males Age/ years (Median)
FS: 37
Control: 34 |
100 g FutureLife porridge per day 388 kcal/day |
6 months
(monthly measurements; measurements at 12 months but no FS) |
BMI Weight Adherence to ART |
| Ivers et al. |
Rural Haiti |
RCT |
N=52
CSB=239
RUFS=285 |
Gender
CSB=male: 144
RUFS=male: 178 Age/ years (mean)
CSB=39.1
RUFS=38.7 |
Corn-soy blend (CSB), sugar and vitamin A and D fortified oil
1000 kcal and
26 g protein/day Ready-to-use food spread (RUFS) sachets
1000 kcal and
26 g of protein/day |
12 months
(6 monthly measurements) |
BMI |
| Palar et al. |
Hondurs |
Prospective study |
N=400
FS=203
Control=197 |
Gender
FS: 150 females
53 males Control: 22 females
175 males Age/ years (mean)
FS=40
Control=41 |
1000 g of maize, 240 g of rice,
370 g of beans, 500 g of fortified corn-soy blend, and 90 g of vegetable oil per day. Family food ration provided |
12 months
(6 monthly measurements) |
Weight |
N*=total number of participants **FS=food support
Table 1: Study characteristics.
(ii) Presenting baseline measurements such as drop-out numbers, results of the interventions, covariates, and statistical analyses (Table 2).
| Study |
Baseline measurement |
Drop-out |
Results of the interventions |
Covariates |
Statistical analysis |
| Cantrell et al. |
Weight/kg (mean)
FS: Female=53.1
Male=56.2 Control: Female=52.5
Male=55.9 BMI/kg/m2 (mean)
FS: Female=21
Male=19.6
Control: Female=20.8
Male=19.7 ART initiated at the beginning of the study. |
FS=140
Control=81 |
Change in weight/kg @ 6 months
FS=+5.4
Control=+5.1
(p=0.68) Change in weight/kg @ 12 months
FS=+6.3
Control=+5.4
(p=0.34) BMI: not reported Adherence to ART higher in the FS group. |
Age, sex, baseline, CD4 count, WHO HIV stage, haemoglobin, TB therapy, BMI at baseline |
Hierarchical logistic regression modes
(SAS GLIMMIX Procedure) |
| Rawat et al. |
BMI: not reported Body weight: not reported ART prior to study - unknown |
Not reported |
FS=0.19 kg increase in weight compared to matched controls (not significant) BMI: not reported Weight: not reported |
Participants matched using propensity score matching (PSM) |
Propensityscore matching with difference-in-difference(DID) estimates (to estimate the impact of food assistance ATT (average treatment effect on the treated). |
| Ivers et al. |
No measurements at start of study were provided. ART prior to study
279 patients on ART ≥ 12months 61 patients on ART for <12months |
FS=84
Control=169 |
Change in BMI/kg/m2 @ 6mths
FS=- 0.20
Control=- 0.66
(p=0.020) Change in BMI/kg/m2 @12 mth
FS=+0.22
Control=- 0.67
(P=0.036) |
ART status, sex, gender, literacy and number of people in households. |
Wilcoxon rank sum tests Logistic regression with Generalized Estimating Equations(GEEs) Linear regressionand repeated measures logistic regression analysis (SAS version 9.2 (SAS Institute, Cary, NC) |
| Serrano et al. |
BMI/kg/m2
FS=20.9
Control=20.7 ART prior to study
FS=5.9 months (median)
Control=5.8 months (median) |
FS=1 dead/lost to follow-up Control=21 dead/lost to follow-up |
BMI/kg/m2
FS=21.9
Control=21.9 Change in BMI /kg/m2
FNS=+1
Control=+1.2
(p=not significant) Good adherence to ART reported in the FS group. |
Age, gender, cd4, HIV stage, ART prior |
Log-rank test Multivariable Cox model
(Statistical package information not provided) |
| van Oosterhout et al. |
BMI /kg/m2
CBS=16.5
RUFS=16.5
Control=16.6 Weight/kg
CSB=43
RUFS=43
Control=45 ART initiated at start of the study |
CSB=64
RUFS=73
Control=29 |
Change in BMI/kg/m2
CSB=+1.7
RUFS=+2.2
Control=+1.2 Change in weight/kg
CSB=+4.4 kg
RUFS=+5.6 kg
Control=+3.3 kg Significant difference between treatment groups and control group.
(p=not provided) Good adherence to ART reported in the FS group. |
Age, gender, WHO stage of HIV infection, BMI, haemoglobin, CD4 count, all upon initiation of ART, and receiving cotrimoxizole prophylaxis, receiving CSB and receiving RUFS |
ANOVA Chi-square test Linear regression analysis Logistic regression analysis (SPSS software version15.0, Chicago, IL) |
| Ahoua et al. |
BMI (median)=15.8 kg/m2 ART prior to study
133 patients started ART prior to the study
470 patients started ART at/after admission to food program. |
132 died, 250 defaulted from care, 98 other |
BMI: 17.7 kg/m2
Body weight: +4 kg (median) |
Sex, age, BMI at baseline, TB, weight, height, ART regime, CD4 count, WHO stage of HIV |
Standard statistics for continuous and categorical data and compared with non-parametric x2 or Fisher’s exact tests(Stata 9.2 (Stata Corp., College Station, TX, USA) |
| Evans et al. |
BMI/kg/m2 (median)
FS=20.4
Control=19.3
(p=0.197) Weight/kg
FS group=53.4
Control=52.8 ART initiated at the start of the study. |
FS=8 (3 transferred out, 3 withdrew, 2 died) Control=4 (1 lost to follow-up, 1 transferred out, 2 withdrew) |
BMI/kg/m2
FS=22.1
Control=20 Change in BMI/%
FS group=+7.8%
Control=+5.5%
(p=0.007) Weight/kg
FS=59
Control=54 Change in weight/%
FS=+12.7%
Control group): +4.9%
(p=0.047) Good adherence to ART reported in the FS group. |
Age, gender, cd4, HIV stage, physical activity |
T-test or Wilcoxon ranksum test Chi-square test Repeated measures of analysis ofvariance (rANOVA)
(SAS 9.3) |
| Ivers et al. |
BMI/kg/m2
CSB=22.0
RUSF group=21.6 ART prior to study
CSB=11.8 months
RUFS=10.2 months |
CSB=28 dead or lost to follow-up RUFS=43 dead or lost to follow-up |
Change in BMI @ 6months/ kg/m2
CSB=+0.215
RUFS=+0.215
(p=0.16) Change in BMI @ 12 months/ kg/m2
CSB=+0.210
RUFS=+0.212
(p=0.52) |
Age, gender, cd4, HIV stage |
Generalized estimating equations (GEEs)
(SAS 9.2 version) |
| Palar et al. |
Weight/kg
FS=57
Control=60 BMI/kg/ m2
FS=23
Control=24 ART prior to study
FS=3.6 years
Control=3.8 years |
FS=24
Control=47 |
Change in weight/kg
Underweight patients
FS=+ 3.15
Control=+3.15
(p=<0.01) Normal weight patients
FS=+ 1.34
Control=+1.34
(p=<0.01) |
Gender, race/ethnicity, age, presence of children in household, primary education, paid work in the last month, economic support from a relative, CD4, protease inhibitors, ART<100 days |
Multilevel mixed effects linear regression analysis STATA/IC 11.1 (StataCorp: College Station, Texas |
Table 2 Study results.
(iii) Assessing quality of studies and describing: outcome measures, reliability and validity of instruments, selection bias, performance bias, detection bias, attrition bias, and reporting bias (Table 3).
| Study |
Design |
No of participants |
Drop-out |
Measurer |
Reliability & validity of instrument |
Selection bias |
Performance bias |
Detection bias |
Attrition bias |
Reporting bias |
Other |
TOTAL |
| Cantrell et al. |
Prospective study |
636 |
221
34.7% |
2 |
2 |
3 |
3 |
3 |
3 |
1 |
3 |
20 |
| Rawat et al. |
Retrospective study |
1666 |
Not reported |
2 |
2 |
3 |
3 |
3 |
2 |
3 |
3 |
21 |
| Ivers et al. |
Prospective study |
593 |
253
42.7% |
2 |
2 |
3 |
3 |
2 |
3 |
1 |
3 |
19 |
| Serrano et al. |
Prospective study with a historical control group |
180 |
22
12.7% |
2 |
2 |
3 |
3 |
3 |
3 |
1 |
3 |
20 |
| van Oosterhoutet al. |
Retrospective study with a historical group |
593 |
166
27.9% |
1 |
2 |
3 |
3 |
3 |
1 |
1 |
3 |
17 |
| Ahoua et al. |
Retrospective study |
1106 |
480
43.4% |
2 |
2 |
3 |
3 |
3 |
3 |
1 |
3 |
20 |
| Evans et al. |
RCT |
38 |
12
31.6% |
1 |
2 |
2 |
3 |
2 |
3 |
1 |
3 |
17 |
| Ivers et al. |
RCT |
524 |
71
13.5% |
2 |
2 |
3 |
3 |
3 |
1 |
1 |
3 |
18 |
| Palar et al. |
Prospective study |
400 |
71
17.8% |
1 |
2 |
2 |
3 |
2 |
3 |
3 |
3 |
19 |
Table 3 Assessment of quality of studies.
Risk of bias was assessed using a standard form and guidelines from the Cochrane Handbook for Systematic Reviews of Interventions Version 5.1.0 [25]. The descriptions of different forms of biases are provided in Table 4. Two other criteria were added including information about measuring procedures and information about reliability and validity of measuring instruments. Each item was scored “1” if appropriate techniques were used and reported in the study, “2” if information was not provided or unclear, and “3” if techniques were reported but not how they standardized to reduce bias. Studies with 8-13 points were considered to be of low risk of bias, studies with 14-19 points were considered to be moderate risk of bias and studies with 20-24 were considered to be of high risk of bias. Scores were given based on agreement by the researchers.
| Bias |
Definition |
Score |
| Selection bias |
|
|
| Sequence generation |
Low risk: Investigators described a random component in the sequence generation process such as the use of random number table, coin tossing, cards or envelops shuffling, etc.
Unclear: Insufficient information to permit judgment of the sequence generation process.
High risk: Investigators described a non-random component in the sequence generation process such as the use of odd or even date of birth, algorithm based on the day/date of birth, hospital or clinic record number. |
1 2 3 |
| Allocation concealment |
Low risk: Participants and the investigators enrolling participants cannot foresee assignment, e.g. central allocation; or sequentially numbered, opaque, sealed envelopes.
Unclear: Insufficient information to permit judgment of the allocation concealment or the method not described.
High risk: Participants and investigators enrolling participants can foresee upcoming assignment, e.g. an open random allocation schedule (e.g. a list of random numbers); or envelopes were unsealed or non-opaque or not sequentially numbered. |
1 2 3 |
| Performance bias |
Low risk: Blinding of the participants and key study personnel, and unlikely that the blinding could have been broken. Or lack of blinding unlikely to introduce bias. No blinding in the situation where non-blinding is not likely to introduce bias.
Unclear: Insufficient information to permit judgment of adequacy or otherwise of the blinding.
High risk: No blinding, incomplete blinding and the outcome are likely to be influenced by lack of blinding. |
1 2 3 |
| Detection bias |
Low risk: Blinding of outcome assessor, and unlikely that the blinding could have been broken. Or lack of blinding unlikely to introduce bias. No blinding in the situation where non-blinding is not likely to introduce bias.
Unclear: Insufficient information to permit judgment of adequacy or otherwise of the blinding.
High risk: No blinding, incomplete blinding and the outcome are likely to be influenced by lack of blinding. |
1 2 3 |
| Attrition bias |
Low risk: No missing outcome data, reasons for missing outcome data unlikely to be related to true outcome, or missing outcome data balanced in number across groups.
Unclear: Insufficient reporting of attrition or exclusions.
High risk: Reason for missing outcome data likely to be related to true outcome, with either imbalance in number across groups or reasons for missing data. |
1 2 3 |
| Reporting bias |
Low risk: All outcomes of interest in the review are reported completely.
Unclear: Insufficient information to permit judgement of ‘low risk’ or ‘high risk.’
High risk: One or more outcomes of interest in the review are reported incompletely; the study report fails to include results for a key outcome that would be expected to have been reported for such a study. |
1 2 3 |
| Other forms of bias |
Low risk: There is no evidence of bias from other sources.
Unclear: Insufficient information to permit judgment of adequacy or otherwise of other forms of bias.
High risk: There is potential bias present from other sources (e.g. early stopping of trial, fraudulent activity, extreme baseline imbalance or bias related to specific study design). |
1
2 3 |
Table 4: Risk of bias assessment form.
In addition, data on participants’ body weight and BMI at baseline were compared to measurements at the end of each intervention to determine if the intervention was effective or not, and effect sizes were calculated when possible.
Results
Systematic search results
A total of 83 publications were retrieved from databases (Figure 1). Sixty three articles did not meet inclusion criteria and were discarded. The full texts of the remaining 20 were examined in detail, but 17 studies did not meet the inclusion criteria. Three studies and an additional six studies identified by checking the references of located, relevant papers, met the inclusion criteria.
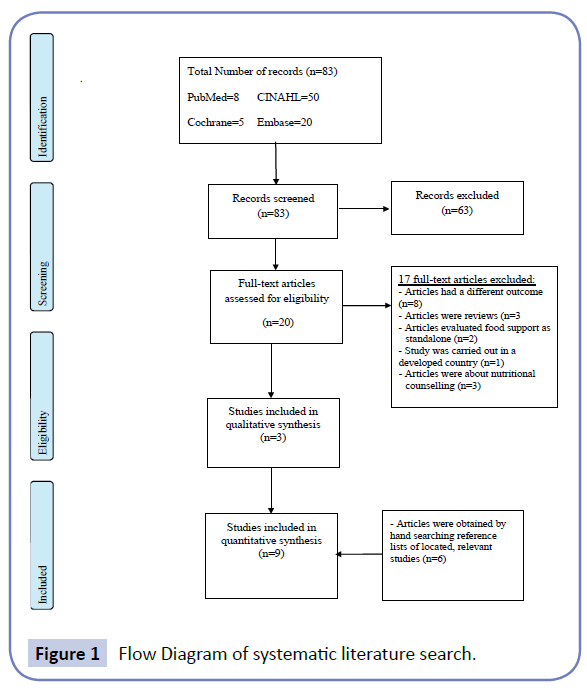
Figure 1: Flow Diagram of systematic literature search.
General characteristics of the nine studies
Six of the studies were carried out in Africa [6,13,17-19,26], one in Central America [22], and two in Caribbean [20, 21]. Two were retrospective quasi-experimental studies [17,26], and one was a retrospective study with a pre-test/post-test design [6] (Table 1). All studies used secondary data on body weight or BMI of PLHIV from institutional including hospital data [6,17,26]. Four were prospective studies [18-20,22], two were randomised control trials (RCT) [13,21]. Seven studies had one or two food groups of participants who were on ART and a control group on ART that did not receive food support [13,17-20,22,26]. One study had two intervention groups, which received different types of food support [21] and one study did not have a control group [6].
Two studies included more than 1000 participants [6,26], six studies had a range of 180 to 636 participants [17-22], and one study had 38 participants [13]. Regarding the objective or outcome measures of this review, three of the selected studies included both BMI and body weight as outcome measures [6,13,17]. Three studies had BMI as their outcome of interest [19-21], while the remaining three studies only measured body weight [18,22,26]. All [6,13,17-20,22,26] but one [21] had more female than male participants. The mean age of participants in five studies ranged from 35 to 41 years old [18,20-22,26], while the median age of participants in the other four studies ranged from 33 to 38.5 years old [6,13,17,19].
Description of intervention
The duration of the interventions ranged from 14 weeks to 12 months (Table 1). The majority of the interventions were implemented for 12 months [18,20-22,26], while two other interventions were carried out for 6 months [13,19]. One intervention was delivered for 14 weeks [17], and duration of intervention for one study was unclear [6].
Several studies used corn-soy blend (CSB) with or without combinations of the following: iodized salt, vegetable oil, pulses and maize meal or rice, beans, sugar, vitamin A and D fortified oil [18,20-22,26]. Two studies distributed both CSB and ready-to-use food spread (RUFS) but each intervention group received only one type of food support [17,21]. Ready-to-use therapeutic food in sachet form and porridge were also provided in two studies [6,13] respectively. Cereals, legumes, vegetable oil and vitamin A were also used as the content of food support one study [19]. All but one study [26] provided information about the nutritional composition of the food support/supplement.
Effect sizes
It is acknowledged that due to the small number of studies with significant differences between the treatment group and the control group, the studies were not grouped based on similar characteristics and the results were not combined..
Four studies reported significant results [6,13,17,20], of which three had significant differences in both weight and BMI between the intervention and the control groups [13,17,20], and one lacked the control group [6]. Effect sizes (Cohen’s d) [27] were calculated for two studies that reported significant differences between the treatment and the control groups [17,20]. For example, in a study by van Oosterhout and colleagues [17], a small effect size (d=0.26) was calculated from the results observed between the RUFS and the CSB group at 14 weeks. A small effect size (d=0.48) was also calculated from the results observed from the RUFS group and the control group at 14 weeks. No significant differences were observed between groups at 26 weeks. The effect size calculated from the results of the study by Ivers and colleagues [20], was negligible. Although Evans and colleagues’[13] study showed significant results, the effect size was not calculated due to lack of sufficient data. Four studies showed no significant differences between groups [18,19,22,26], and one study [21] was excluded because corn-soy blended flour used for control group in this study was used in the treatment groups in other studies.
Quality assessment of the selected studies
Results of the methodological quality assessment are shown in Table 3. The observed total risk of bias score on fulfilled criteria ranged from 17–21 with a median score of 20. Only three studies provided information about weight measurement procedures such as using a standardized procedure [13,17,22]. No study reported any information about the reliability and validity of measuring instruments.
Only one study adequately randomised participants into groups and adequately concealed allocation [17]. However, the addition of a historical control group to the study introduced bias. None of the studies blinded participants. Five studies did not blind outcome assessors [17-19,21,26], and in three of the studies, blinding was unclear [13,20,22]. Attrition bias was low in two studies due to balanced numbers of drop-outs in both treatment and control groups [17,21] and high in six studies due to unbalanced drop-out numbers in treatment and control groups, or high drop-out numbers [6,13,18-20,22]. The drop-out numbers in the intervention group and the control group were unclear in one study due to lack of information provided [26]. None of the studies mentioned a study protocol. Some of the studies had missing information such as no baseline weight measurements, or no measurements for the control group at the end of the study [22,26]. Only one study reported monitoring adherence to food support [13]. Four studies reported providing a family food ration to prevent study participants sharing their individual food ration with family members [6,19-21]. Some of the studies did not report monitoring the ART adherence [6,20,22,26].
Discussion
Food support intervention is an important initiative aimed to improve nutritional status of PLHIV particularly in developing countries with poor food security [15]. The aim of the current study was to evaluate the effectiveness of food support as interventions in improving the nutritional status of PLHIV in developing countries. Of the nine studies reviewed, four reported significant results. Of the four studies, three reported significant differences in both weight and BMI between the intervention and the control groups [13,17,20]. The three studies used different types of food support and were carried out for different lengths of time: 3.5 months, 6 months and 12 months. The only study with an effect size had the shortest intervention period [17]. Two studies varied in terms of nutritional content, with the calorie content ranging from 388 kcal to 1360 kcal per day, while one study did not provide nutritional values for their food support program [20]. They were all carried out in African countries.
A possible explanation for the lack of clinical effect observed in some of the studies reviewed could be the incorrect use of food supplements. For example, some participants were reported to use the food packages/supplements as a replacement for their regular meals instead of in addition to their regular meals [28]. In some circumstances, sharing of supplements with family members was reported to occurred [6,13,17,21,26]. Although some studies provided a family ration to prevent sharing of food supplements [18-20,22], without monitoring, the effectiveness of a family ration would be unknown. Another possible explanation is nonadherence. The study carried out in Kenya on the acceptability of Plumpy’nut, a high-energy nutritional supplement, showed that lack of adherence was due to poor taste, diet boredom, bulky weight and sharing with family members [6]. Except for one study [13], all other studies did not monitor adherence to food support. This is problematic as it would be difficult to gauge whether participants used food packages or food supplements as intended.
Strengths and limitations
Similarities between the studies included outcome measures, length of studies, types of food support and population sizes. All the studies had similar and comparable outcome measures (change in weight and/or BMI). Most (7/9 ~ 98%) studies took measurements at 6 and/or 12 months [17-22], and had a population size of between 400 - 1666 participants. All, but two studies [6,13], used local food items such as corn-soy flour, rice and oil as a form of food support provided. The median calorie content of the food support programs was approximately 1000 kcal.
This review acknowledges limitations including the differences between studies such as: study design, attrition rates and the length of time that participants were on ART before they commenced food support. For example, two of the studies were randomised controlled trials [13,22], and the rest were either retrospective studies or prospective studies (with a historical control in some cases). One study had a pre and post-test design [6]. Two studies used a historical control group [17,19]. Food security in a community changes over time and may have been different at the time the treatment and control groups were involved in the study. Attrition rates ranged from 12.7% to 43.4% and length of time on ART prior to commencing food support range from 0 – 3.8 years. This review focused on the effectiveness of food support amongst adults with HIV on ART treatment in resource-limited settings. However, due to the low number of studies identified in the literature search, two studies including participants aged 15 and above were not excluded [18,22], and a study with a pre-test and post-test design was not excluded [6].
ART adherence was not monitored in four studies [6,20,22,26]. This is a significant limitation in these studies because: it is well known that the lack of adherence to ART treatment would increase the susceptibility of HIV patients to opportunistic infections [29]. Opportunistic infections in turn would increase nutritional requirements, and in circumstances of food insecurity increase malnutrition [16]. Lack of adherence to ART also leads to ART resistance [19].
Although beyond the scope of this review, some studies observed an association between the provision of food support and improved ART adherence [18-20]. Likewise, household income was assessed at the start of the intervention in four studies [18,20-22], and dietary assessment at the start of the intervention was conducted in only two studies [13,17]. These assessments provide an indication of the availability of different food items to participants and their ability to purchase them. Assessing household income and usual dietary intake at the start of an intervention and correcting for them in statistical analysis reduces bias.
Regarding methodological quality, five of the studies reviewed had a moderate risk of bias [13,17,20-22], and the remaining studies had a high risk of bias according to the predefined standard. It is difficult to grade any of the studies as providing strong evidence due to the high risk of bias due to lack of randomisation, blinding, high attrition and lack of monitoring of adherence to food support.
Recommendations
Food support has convincing theoretical grounds of clinical effectiveness, may promote ART adherence and improve nutritional recovery [17]. However, it is difficult to draw definite conclusions about the effectiveness of food support in this population based on this review. Larger randomised controlled trials that are adequately powered to determine the efficacy of food support amongst adults living with HIV in developing countries are needed.
The choice of food supplements should consider optimal nutritional composition but also they should be acceptable to participants. The likelihood of food support sharing should also be reduced in order to optimise the effect of supplement in improving patients’ health. Because RUFS is considered a medicinal product and therefore less likely to be shared amongst family members [30], its use may need further exploration. Furthermore, more research needs to be conducted to design nutritional supplements that are best suited to the specific needs of HIV patients in resource-limited settings.
Conclusion
Studies show that HIV infection, under nutrition and food insecurity often overlap in developing countries where the majority of people with HIV live [7,9,15]. Insufficient food intake and/or inefficiency in nutrient absorption and utilisation cause weight loss amongst PLHIV infection [14,29]. Results of this systematic review indicate that food support in the form of food packages or nutritional supplements is effective in improving the nutritional status of PLHIV on ART treatment in developing countries. However, the limited number of studies and evidence prohibit drawing firmer conclusion. Further research is needed in this area since to inform governments, policy makers, international organizations, and assist program planners in developing evidence-based strategies and interventions, which can be implemented to addressing HIV and on helping PLHIV in resource poor settings.
Ethical approval
This article does not contain any studies with human participants or animals performed by any of the authors.
Acknowledgement
Not applicable.
17738
References
- (2015) UNAIDS, Fact Sheet: 2014 Global Statistics. Joint Unated Nations Programme on HIV/AIDS (UNAIDS): Geneva, Switzerland,
- WHO (2014) Executive Summary of the Global Update on the Health Sector Response to HIV. World Health Organization: Geneva, Switzerland.
- Maas JJ, Dukers N, Krol A (1998) Body mass index course in asymptomatic HIV-infected homosexual men and the predictive value of a decrease of body mass index for progression to AIDS. J Acquir Immune Defic Syndr Hum Retrovirol 19: 254-259.
- Wheeler DA, Gibert CL, Launer CA (1998) Weight loss as a predictor of survival and disease progression in HIV infection. Terry Beirn Community Programs for Clinical Research on AIDS. J Acquir Immune Defic Syndr Hum Retrovirol 18: 80-85.
- Guenter P, Muurahainen N, Simons G (1993) Relationships among nutritional status, disease progression, and survival in HIV infection. J Acquir Immune Defic Syndr Hum Retrovirol 6: 1130-1138.
- Ahoua L, Umutoni C, Huerga H, Minetti A, Szumilin E, et al. (2011) Nutrition outcomes of HIV-infected malnourished adults treated with ready-to-use therapeutic food in sub-Saharan Africa: a longitudinal study. J Int AIDS Soc 14: 1-9.
- Adetutu A, Ayinde AE, Oluyemisi OA, Owoade OA, Jonathan AA (2012) The Effect of HIV/AIDS upon Food Insecurity of Rural Households in Western Nigeria. J Agri Sci 4: 31-35.
- Iya IB, Purokayo SG, Gabdo Y (2012) The Effects of HIV/AIDS Scourge on Production and Income among Rural Households in Adamawa State of Nigeria. Glob J Health Sci 1: 245-252.
- Piot P, Bartos M, Ghys PD, Walker N, Schwartländer B (2001) The global impact of HIV/AIDS. Nature 410: 968-973.
- Knox TA, Zafonte-Sanders M, Fields-Gardner C, Moen K, Johansen D, et al. (2003) Assessment of Nutritional Status, Body Composition, and Human Immunodeficiency Virus–Associated Morphologic Changes. Clin Infect Dis 36: S63-S68.
- (1993) Centers for Disease Control and Prevention, Revised classification system for HIV infection and expanded surveillance case definition for AIDS among adolescents and adults. MMWR Morb Mortal Wkly Rep 41: 1-19.
- Chlebowski RT, Grosvenor MB, Bernhard NH, Morales LS, Bulcavage LM (1989) Nutritional status, gastrointestinal dysfunction, and survival in patients with AIDS. Am J Gastroenterol 84: 1288-1293.
- Evans D, McNamara L, Maskew M, Selibas K, van Amsterdam D, et al. (2013) Impact of nutritional supplementation on immune response, body mass index and bioelectrical impedance in HIV-positive patients starting antiretroviral therapy. Nutr J 12: 111-110.
- Swaminathan S, Padmapriyadarsini C, Sukumar B, Iliayas S, Kumar SR, et al. (2008) Nutritional status of persons with HIV infection, persons with HIV infection and tuberculosis and HIV-negative individuals from southern India. Clin Inf Dis 46: 946-949.
- Ivers LC, Cullen KA, Freedberg KA, Block S, Coates J, et al. (2009) HIV/AIDS, Undernutrition, and Food Insecurity. Clin Infect Dis 49: 1096-1102.
- Colecraft E (2008) HIV/AIDS: nutritional implications and impact on human development. Proc Nutr Soc 67: 109-113.
- van Oosterhout JJ, Ndekha M, Moore E, Kumwenda JJ, Zijlstra EE, et al. (2010) The benefit of supplementary feeding for wasted Malawian adults initiating ART. AIDS Care 22: 737-742.
- Cantrell RA, Sinkala M, Megazinni K, Lawson-Marriott S, Washington S, et al. (2008) A Pilot Study of Food Supplementation to Improve Adherence to Antiretroviral Therapy Among Food-Insecure Adults in Lusaka, Zambia. J Acquir Immune Defic Syndr 49: 190-195.
- Serrano C, Laporte R, Ide M, Nouhou Y, de Truchis P, et al. (2010) Family nutritional support improves survival, immune restoration and adherence in HIV patients receiving ART in developing country. Asia Pac J Clin Nutr 19: 68-75.
- Ivers LC, Chang Y, Gregory Jerome J, Freedberg KA (2010) Food assistance is associated with improved body mass index, food security and attendance at clinic in an HIV program in central Haiti: a prospective observational cohort study. AIDS Res Ther 7: 1-8.
- Ivers LC, Teng JE, Jerome JG, Bonds M, Freedberg KA, et al. (2014) A Randomized Trial of Ready-to-Use Supplementary Food Versus Corn-Soy Blend Plus as Food Rations for HIV-Infected Adults on Antiretroviral Therapy in Rural Haiti. Clin Infect Dis 58: 1176-1184.
- Palar K, Derose KP, Linnemayr S, Smith A, Farías H (2015) Impact of food support on food security and body weight among HIV antiretroviral therapy recipients in Honduras: a pilot intervention trial. AIDS Care 27: 409-415.
- Zaza S, Wright-De Agüero LK, Briss PA, Truman BI, Hopkins DP, et al. (2000) Data Collection Instrument and Procedure for Systematic Reviews in the Guide to Community Preventive Services. Am J Prev Med 18: 44-74.
- Higgins JPT, Green S (2011) Cochrane Handbook for Systematic Reviews of Interventions. The Cochrane Collaboration pp: 201.
- Rawat R, Kadiyala S, McNamara PE (2010) The impact of food assistance on weight gain and disease progression among HIV-infected individuals accessing AIDS care and treatment services in Uganda. BMC Public Health 10: 1-8.
- Tang AM, Quick T, Chung M, Wanke CA (2015) Nutrition Assessment, Counseling, and Support Interventions to Improve Health-Related Outcomes in People Living With HIV/AIDS: A Systematic Review of the Literature. J Acquir Immune Defic Syndr 68: s340-s349.
- Martinez H, Palar K, Linnemayr S, Smith A, Derose KP, et al. (2014) Tailored Nutrition Education and Food Assistance Improve Adherence to HIV Antiretroviral Therapy: Evidence from Honduras. AIDS Behav 18: S566-S577.
- Ndekha MJ, van Oosterhout JJ, Zijlstra EE, Manary M, Saloojee H, et al. (2009) Supplementary feeding with either ready-to-use fortified spread or corn-soy blend in wasted adults starting antiretroviral therapy in Malawi: randomised, investigator blinded, controlled trial. BMJ 338: 1-8.