Key words
Adiponectin, AdipoR1, insulin resistance, insulin
Introduction
The white adipose tissue has been increasingly recognized as an important endocrine organ that secretes a number of biologically active adipocytokines [1]. Adiponectin (ADPN) and Adiponectin receptor (AdipoR1) are expected to be novel preventive and therapeutic tools for control of diabetes mellitus (DM) and metabolic syndrome (MetS) [2]. ADPN mediates its effects through at least three cell membrane receptors : AdipoR1, most abundant in skeletal muscle, AdipoR2, most abundantly expressed in the liver, and recently, T-cadherin expressed on vascular endothelial and smooth muscles. These receptors mediate increased adenosine mono phosphate protein kinase (AMPK) and peroxisome proliferator-activated receptor α (PPARα) activity by ADPN binding, thus activating fatty acid (FA) oxidation and glucose (Glu) uptake [3].
Circulating ADPN level (1.9–17.0 μg/ml) in healthy adults accounting for 0.01% of total plasma proteins [4,5]. Many factors affect plasma ADPN concentration and diurnal and pulsatile ADPN secretion has been shown in humans. ADPN peaks in the morning and decreases at night [6]. Moreover, female humans and rodents have higher plasma ADPN level than males, suggesting that sexual hormones regulate the production of ADPN [7,8]. Some dietary factors, such as fish oils and linoleic acid [9,10] are also suggested to increase plasma ADPN level, which is consistent with the fact that intake of these factors is thought to have a protective effect on the development of DM.
On the other hand, a carbohydrate-rich diet and high-fat diet (HF) appear to decrease plasma ADPN level [11]. Plasma ADPN concentration has also been found to be high in thin individuals, inflammation, and in Type 1 diabetes mellitus (T1DM), and low in T2DM, lipodystrophy and in obese individuals. In addition, plasma ADPN concentration is negatively correlated with body mass index [BMI), insulin resistance (IR), triglyceride (TG) and low density lipoproteins (LDL) and positively correlated with high density lipoproteins (HDL) [12].
The aim of the present study was to assess the possible contribution of ADPN in amelioration of lipide profile and IR, the metabolic abnormalities (hyperlipidemia, hyperinsulinemia and hyperglycemia) induced in diabetic, IR rats. In addition, in this study we have evaluated the effects of administration of INS on the level of ADPN, TG, total cholesterol (TC), Glu, obesity and IR index as well as the gene expression of AdipoR1 in skeletal muscle of high-fat (HF) - streptozotocin (STZ) – treated rats.
Methods
Chemicals
STZ (Trade name Zanosar) was purchased from Sigma chemical company (St. Louis Missouri, USA). The drug was dissolved in 0.1 M sodium citrate (pH 4.5). Long acting protamine zinc INS (PZI) was purchased from Nile Company (Egypt). PZI is a premixed suspension of biosynthetic human INS, 30% as soluble crystalline INS and 70% as isophan INS [13].
Experiment al Animals
For this study, 40 male Sprague-Dowley rats, 6 weeks old (145- 200 g b.w.) were used. They were kept in the animal house of Kasr Al-Aini Faculty of Medicine, Cairo University. The rats had free access to food and water. They were kept at 22 ± 1ºC temperature at 12 h dark-light cycles. Animals were randomly divided into 4 groups (each, n = 10): (1) Control rats (C) were fed a standard rat chow and received an intra-peritoneal (i.p.) injection of 0.1 mol/L sodium citrate buffer (pH 4.5). The other 3 groups were fed a HF diet (35g of lard per 100g of rat chow) for 8 weeks to induce IR; (2) HF rats injected with 0.1 mol/L sodium citrate buffer , i.p., pH 4.5; (3) HF + STZ injected i.p. with a single dose of STZ (30 mg/kg) for 1 week [14]; (4) HF+STZ+INS, rats treated with INS (1 IU/kg/day) for 6 days till the end of the study protocol (8 weeks). DM was verified after 5 days by measuring blood Glu levels (after overnight fast) with the use of Glu oxidase reagent strips (Lif3 scan, Milpitas, CA, USA). Rats having blood Glu level >200 mg/dl, were considered diabetic [15]. After the end of 8 weeks animals retro-orbital blood samples were obtained under anesthesia using pentobarbital 40 mg/ kg, b.w. i.p., after overnight fasting. Animals were weighted and the naso-anal length was measured in cm [16]. The blood samples were withdrawn through the retro-orbital route using heparinized capillary tubes. The blood samples were allowed to clot for 20 min and then centrifuged at 10,000 rpm for 20 minutes for plasma separation and stored at -70?C until time of assay of plasma levels of ADPN, Glu, INS, TG and TC. The animals were sacrificed by blow to the head and tissue samples from soleus muscle (30 mg) were dissected and kept frozen at –80°C in liquid nitrogen until they were used to assess the AdipoR1 gene expression.
The experiments were conducted in accordance with Ethical Guidelines for investigations of laboratory animals and were approved by the Ethical Committee of Kasr Al-Aini faculty of Medicine , Cairo University.
Measurements of Biochemical Parameters
Measurement of fasting plasma INS
Rat INS concentration was measured in plasma by enzyme immunoassay using the rat INS ELISA kit (Linco Research, MO). The assay was performed according to the standard procedure of the ELISA kits. Absorbance was measured at 450 nm.
Measurement of fasting plasma Glu
The plasma Glu was assayed by the method adopted by Trinder [17]. The test materials for this method were supplied as kits by “Diamond Diagnostics”. Absorbance was measured at 500 nm .
Measurement of obesity index (OI)
The OI (the equivalent of body mass index in humans) was calculated according to an equation formulated by Dubuis [18]:

Homeostasis model assessment of IR ( HOMA-IR)
The assessment of IR was devised by Matthews [19] and it depends on relationship between fasting plasma Glu and INS based on a mathematical model: HOMA-IR = {[Fasting Glu (mg/ dl)/18) X Fasting INS (μIU/ml)}/ 22.5
Measurement of fasting plasma TG
Fasting plasma TG was assayed by the method adopted by Wahlefeld [20]. TG quantification kit was used to supply the test materials for this method (BioVision Research). Absorbance was measured at 570 nm.
Measurement of fasting plasma TC
Fasting plasma TC was assayed by the method adopted by Sundvall [21]. Cholesterol assay kit was used to supply the test materials for this method (BioAssay Systems). Absorbance was measured at 340 nm.
Measurement of fasting plasma ADPN
Serum level of ADPN was determined by using rat ADPN ELISA kit (Linco Research, MO) according to the manufacturer’s instruction. Absorbance was measured at 450 nm.
Detection of AdipoR1 gene expression by polymerase chain reaction (PCR) in the soleus muscle
For the detection of AdipoR1 gene expression, RNA was extracted was from soleu muscle homogenate using SV-Total RNA isolation system kit (Promega Biosciences, Medison, USA) according to the manufacturer’s instruction and the extracted RNA was measured spectrophotometrically at 280 nm. Extracted RNA was reverse transcribed into cDNA, and amplified by PCR according to Williams [22]. SV-Total RNA kit was used to supply the test materials. The extracted RNA was reverse transcribed into cDNA using RT-PCR kit (Stratagene USA). cDNA was prepared from RNA as follows: about, 20μg of mRNA was heated at 70 ºC for 5 min with 50 pmol of reverse primer of AdipoR1 gene before adding 5 X RT buffer 50 mM Tris-HCL pH 8.3. 10 mM dNTPS and 200 U of moloney, MO murine leukemia virus reverse transcriptase in a final volume up to 36μL was added. RT reaction was carried for 2 h at 37 ºC.
Polymerase Chain Reaction (PCR)
5 μL of cDNA was subjected to PCR under the conditions specified below; PCR reaction was carried by adding 50 pmol of each of forward and reverse primer specific to AdipoR1 gene. The oligonucleotide primers sequences of AdipoR1 gene are presented in Table 1. For each sample, the master mix contained : 5 μl of 10 x PCR buffer, 1 μl of 10 mM dNTPs, 2 primers (50 pmol for each), 1 μl of Taq polymerase, and 37 μl of distilled water. The total volume of each sample master mix was 45 μl. 5 μl of cDNA was pipetted and added to the master mix. The tube was inserted in the thermal cycler and the cycling conditions are shown in Table 1.
Agarose Gel Electrophoresis
The amplified PCR product of AdipoR1 gene were electrophoresed on 1.5 % Agarose gel and UV visualized after staining with ethidium bromide. A densitometry system using a Standard DNA of known concentration gene Gel, documentation system was used for analysis (Syngene, Cambridge, UK). PCR products were semiquantitated by using gel documentation system (Biometra Germany).
Statistical Analysis
Data were processed using the statistical package SPSS version 12. The results are presented as mean ± SD. Comparisons were made by unpaired t - test or one-way ANOVA as required. When a significant F was obtained, multiple comparisons post tests were used to determine which groups were significantly different. Linear correlation or regression was also assessed between different variables using the Pearson product-moment correlation coefficient. P < 0.05 was considered significant.
Results
First, we have shown (Figure 1) that OI in HF and HF+STZ rats were significantly increased when compared to C group ( C = 317±12.8, HF = 340±3.9, HF+STZ = 329±4.68, P<0.001) . We further questioned whether the TG and TC, Glu, INS and HOMA index, ADPN level were significantly changed in HF and HF + STZ rats compared to C.
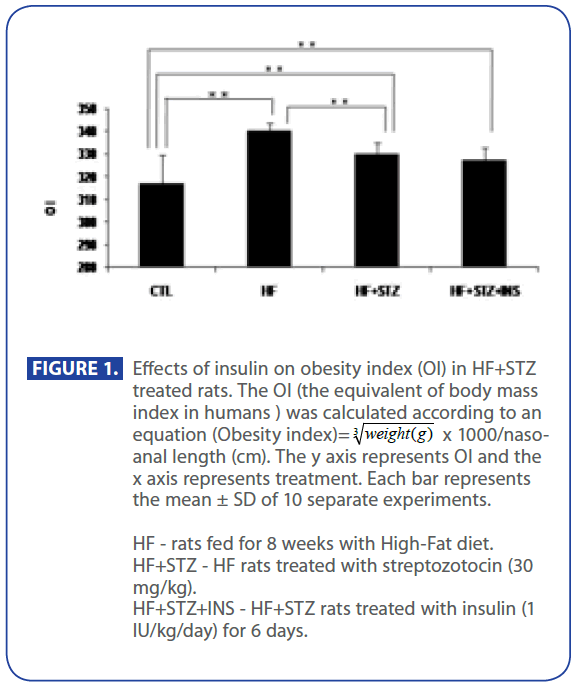
Figure 1:Effects of insulin on obesity index (OI) in HF+STZ treated rats. The OI (the equivalent of body mass index in humans ) was calculated according to an equation (Obesity index)=  x 1000/nasoanal length (cm). The y axis represents OI and the x axis represents treatment. Each bar represents the mean ± SD of 10 separate experiments.
HF - rats fed for 8 weeks with High-Fat diet.
HF+STZ - HF rats treated with streptozotocin (30 mg/kg).
HF+STZ+INS - HF+STZ rats treated with insulin (1 IU/kg/day) for 6 days.
Figure 2 shows that plasma level of TG and TC were significantly increased in HF and HF + STZ rats compared to C (TG: C = 57.35 ± 6.0 mg/dl; HF = 74.88±7.1mg/dl; HF+STZ = 85.55±5.7mg/ dl; TC: C =127.37 ±5.5 mg/dl; HF =157.95±10.8mg/dl; HF+STZ = 173.55 ± 11.7mg/dl, P<0.001). To test whether the increase in TG and TC was the result of a increase in Glu, INS and decrease in adiponectin level we analyzed the level of Glu, INS and adiponectin in C, HF and HF+STZ animals. HF diet and STZ treatment of HF rats significantly increased plasma Glu and INS level compared to C (Glu: C = 79.665 ± 3.7 mg/dl; HF = 141.21 ± 18.5mg/dl; HF+STZ = 219.9 ± 26.87mg/dl, P<0.001; INS: C = 11.05 ± 0.70IU; HF = 28.517 ± 2.30IU; HF+STZ =36.65±4.00IU, P<0.001).
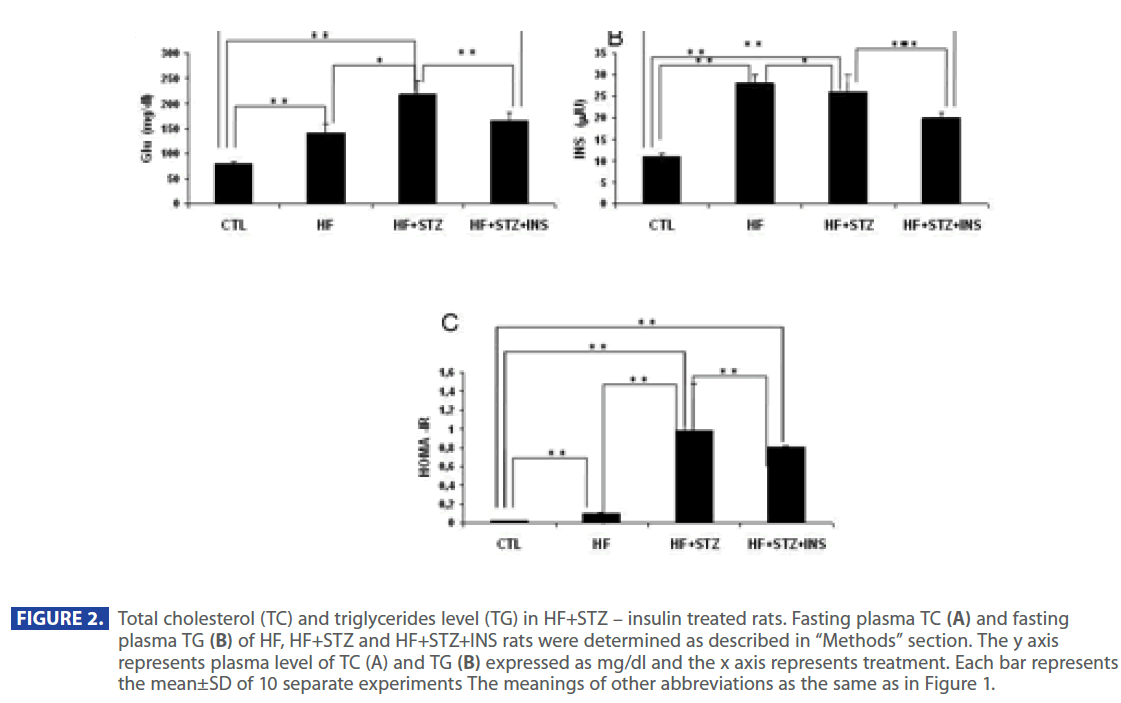
Figure 2: Total cholesterol (TC) and triglycerides level (TG) in HF+STZ – insulin treated rats. Fasting plasma TC (A) and fasting plasma TG (B) of HF, HF+STZ and HF+STZ+INS rats were determined as described in “Methods” section. The y axis represents plasma level of TC (A) and TG (B) expressed as mg/dl and the x axis represents treatment. Each bar represents the mean±SD of 10 separate experiments The meanings of other abbreviations as the same as in Figure 1.
In addition, ADPN level was significantly decreased in in HF and HF+STZ rats compared to C (C = 6.888 ± 1.0 ng/dl; HF = 3.347±0.9 ng/dl; HF+STZ = 2.45±0.7 ng/dl, P<0.001). This de creases in ADPN level was followed by significantly decreses in AdipoR1 expression in HF and HF + STZ rats compared to C (C = 0.326 ± 0.10g/g tissue ; HF = 0.163±0.10g/g tissue; HF + STZ = 0.175 ± 0.10g/g tissue , P<0.001). Furthermore, treatment with INS significantly (P<0.001) decresed plasma level of Glu (Figure 2A), INS level (Figure 3B) and IR (Figure 3C). Treatment with INS also decreased plasma level of TG (Figure2B) when compared to HF+STZ rats.
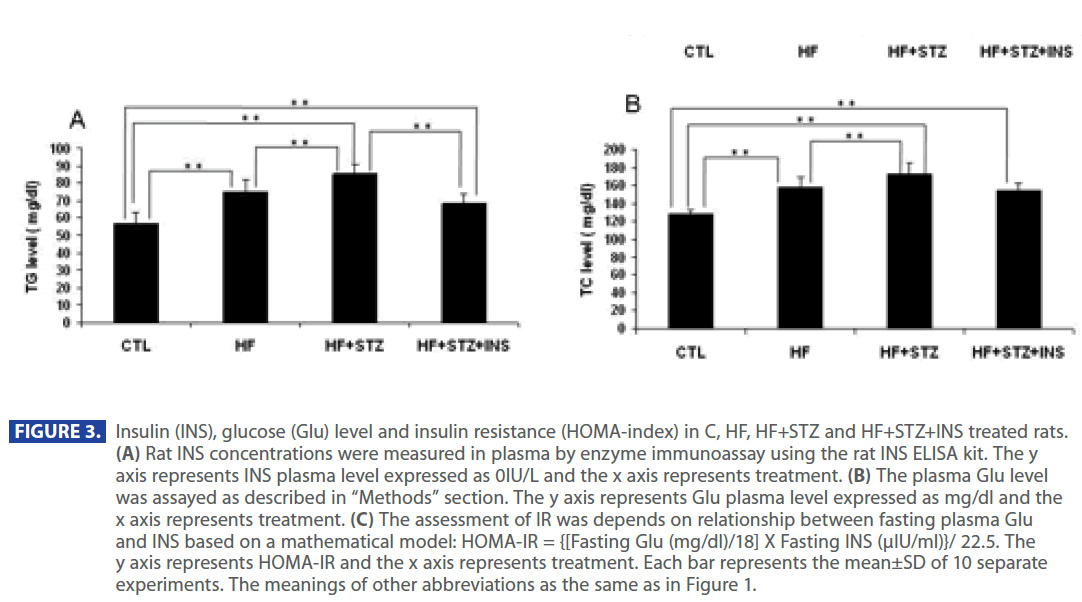
Figure 3: Insulin (INS), glucose (Glu) level and insulin resistance (HOMA-index) in C, HF, HF+STZ and HF+STZ+INS treated rats. (A) Rat INS concentrations were measured in plasma by enzyme immunoassay using the rat INS ELISA kit. The y axis represents INS plasma level expressed as 0IU/L and the x axis represents treatment. (B) The plasma Glu level was assayed as described in “Methods” section. The y axis represents Glu plasma level expressed as mg/dl and the x axis represents treatment. (C) The assessment of IR was depends on relationship between fasting plasma Glu and INS based on a mathematical model: HOMA-IR = {[Fasting Glu (mg/dl)/18] X Fasting INS (μIU/ml)}/ 22.5. The y axis represents HOMA-IR and the x axis represents treatment. Each bar represents the mean±SD of 10 separate experiments. The meanings of other abbreviations as the same as in Figure 1.
In addition, INS also partially restored the plasma ADPN (Figure 4) and gene expression of AdipR1 (Figure 5) as compared to the HF + STZ group, but it did not go back to the control level.
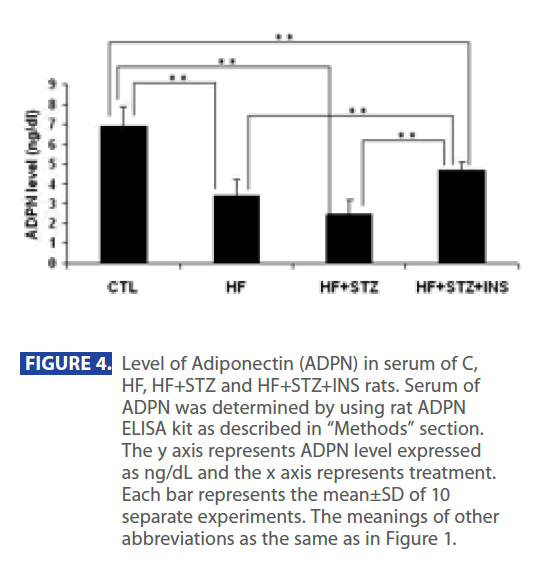
Figure 4: Level of Adiponectin (ADPN) in serum of C, HF, HF+STZ and HF+STZ+INS rats. Serum of ADPN was determined by using rat ADPN ELISA kit as described in “Methods” section. The y axis represents ADPN level expressed as ng/dL and the x axis represents treatment. Each bar represents the mean±SD of 10 separate experiments. The meanings of other abbreviations as the same as in Figure 1.
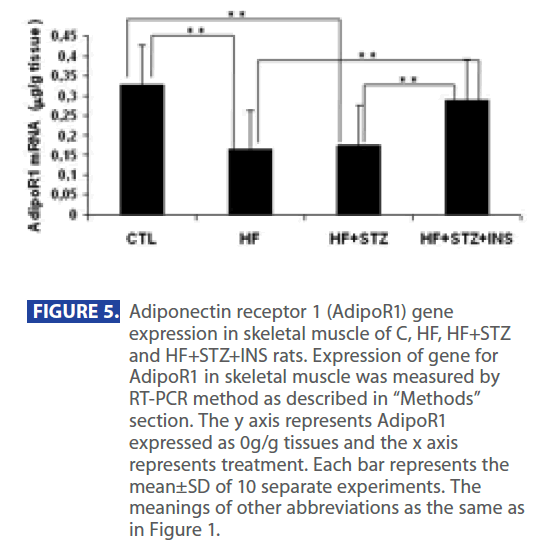
Figure 5: Adiponectin receptor 1 (AdipoR1) gene expression in skeletal muscle of C, HF, HF+STZ and HF+STZ+INS rats. Expression of gene for AdipoR1 in skeletal muscle was measured by RT-PCR method as described in “Methods” section. The y axis represents AdipoR1 expressed as 0g/g tissues and the x axis represents treatment. Each bar represents the mean±SD of 10 separate experiments. The meanings of other abbreviations as the same as in Figure 1.
Correlation study, show that plasma ADPN and AdipoR1 were significantly (P<0.05) negatively correlated with the following parameters: OI, TC, TG, INS, Glu level and HOMA-IR. In addition, there is also a significant positive correlation between AdipoR1 and ADPN.
Discussion
In this study we have shown that HF diet for 8 weeks caused significant metabolic changes, as compared to the control rats which were fed on the standard laboratory chow. These metabolic changes included increase in OI, hyperlipidemia, hyperinsulinemia and hyperglycemia which finally induced increased IR. In addition, these metabolic changes were accompanied by hypoadiponectinemia and down regulation of AdipoR1 expression in skeletal muscle.
Work done by Bluher [23] hypothesized that in the steady state, ADPN level would be lower, and its receptors level would be higher in obese people as compared to control subjects to compensate for the low AdipoR1 level observed in subjects with obesity and IR. Moreover, plasma ADPN level is correlated inversely to mRNA expression of both AdipoR1 and AdipoR2 so the lower the ADPN plasma level, the higher would be the expression of the receptors. Though, in this study we have found a negative correlation between the increased levels of TC, TG and OI with ADPN and Adipo R1 expression in skeletal muscle of HF rats but our results show a positive correlation between plasma ADPN and AdipoR1 expression. However, our experiment only lasted for 8 weeks, so it is possible that rats did not still reach the steady state. Our results are also differ from the results reported by Barnea [24] who documented that AdipoR1 expression increased in muscle tissue, while plasma ADPN level did not change in HF rats for 4 months, however, they used different rat strains and a longer duration of experiment and a different composition. Thus, changes in AdipoR1 mRNA levels do not always reflect a parallel change in plasma total ADPN level [25].
INS treatment is among the alternative strategies designed to manage T2DM and it results in improvement of glycemic control and INS synthesis and secretion by β-cells [26]. INS therapy decreases hepatic Glu output and improves peripheral Glu uptake and may also improve IR [27]. In our study, INS treatment resulted in an improvement in IR as manifested by decreasing the fasting plasma lipids, INS and Glu levels as compared to untreated diabetic group. INS also significantly increased both ADPN and AdipoR1 back to the control values. This effect mimicks the effect of INS therapy in humans which was demonstrated by Langouche [28] who postulated that INS therapy increased circulating ADPN level, normalized the elevated serum C-peptide level and decreased IR by increasing the metabolic INS signal in human muscle. It has been shown that administration of INS to T2DM rats noticeably improved the INS content of β-cells, with a slight reduction in fasting blood Glu and TG as compared to an untreated diabetic (HF + STZ) group [26].
Despite the significant reduction in Glu level and improvement of IR in INS-treated diabetic (HF + STZ + INS) rats as compared to the untreated diabetic (HF + STZ) rats in our study, the INS treatment partially restore the Glu level in comparison to the control group. This results may be explained by work of Mason [29] who reported that INS treatment by i.p. route, normalized the elevated Glu production in STZ-diabetic rats, while INS delivered by SC route only partially normalized it. In addition, this also may be due to our different dose of INS (once instead of twice/day) and due the short duration of treatment before the measurements were done (6 days).
Conclusion
Results from this study demonstrated that feeding rats with HF-diet for 8 weeks in addition to a low dose of STZ, induced metabolic abnormalities and increased IR. It was also associated with hypoadiponectinemia and down regulation of AdipoR1 expression in skeletal muscle. All these metabolic changes were significantly improved by administration of INS which also resulted in increasing both plasma levels of ADPN and AdipoR1 expression in skeletal muscle. These results suggest that ADPN hormone might play an important role in the amelioration of the lipid profile and IR that is observed with INS treatment in pathophysiological conditions such is diabetes.
Acknowlegments
This work is part of collaboration between Cairo University, Egypt and King Khalid University, SA and was supported by grants from the Kasr Al-Aini Research Centre and the grant No.143030 (to E.R.I) from the Ministry of Science, Republic of Serbia.
357
References
- Lazar MA: The humoral side of insulin resistance. Nat Med 12: 43–44, 2006.
- Kadowaki T, Yamauchi T: Adiponectin and adiponectin receptors. Endocr Rev 26: 439–451, 2005.
- Yamauchi T, Nio Y, Maki T, Kobayashi M, Takazawa T, Iwabu M, Okada-Iwabu M, Kawamoto S, Kubota N, Kubota T, Ito Y, Kamon J, Tsuchida A, Kumagai K, Kozono H, Hada Y, Ogata H, Tokuyama K, Tsunoda M, Ide T, Murakami K, Awazawa M, Takamoto I, Froguel P, Hara K, Tobe K, Nagai R, Ueki K, Kadowaki T: Targeted disruption of AdipoR1 and AdipoR2 causes abrogation of adiponectin binding and metabolic actions. Nat Med 13: 332– 339, 2007.
- Wong G, Wang J, Hug C, Tsao T, Lodish H: A family of Acrp30/ adiponectin structural and functional paralogs. Proc Natl Acad Sci U S A. 101: 10302-10307, 2004.
- Ronti T, Lupattelli G, Mannarino E: The endocrine function of adipose tissue: an update. Clinical Endocrinology 64: 355-365, 2006.
- Gavrila A, Peng CK, Chan JL, Mietus JE, Goldberger AL, Mantzoros CS: Diurnal and ultradian dynamics of serum adiponectin in healthy men: comparison with leptin, circulating soluble leptin receptor, and cortisol patterns. J Clin Endocrinol Metab 88: 2838- 2843, 2003.
- Combs TP, Berg AH, Rajala MW, Klebanov S, Iyengar P, Jimenez- Chillaron JC, Patti ME, Klein SL, Weinstein RS, Scherer PE: Sexual differentiation, pregnancy, calorie restriction, and aging affect the adipocyte-specific secretory protein adiponectin. Diabetes 52: 268–276, 2003.
- Xu A, Chan KW, Hoo RL, Wang Y, Tan KC, Zhang J, Chen B, Lam MC, Tse C, Cooper GJ, Lam KS: Testosterone selectively reduces the high molecular weight form of adiponectin by inhibiting its secretion from adipocytes. J Biol Chem 280: 18073–18080, 2005.
- Nagao K, Inoue N, Wang Y, Yanagita T: Conjugated linoleic acid enhances plasma adiponectin level and alleviates hyperinsulinemia and hypertension in Zucker diabetic fatty (fa/ fa) rats. Biochem Biophys Res Commun 310: 562–566, 2003.
- Flachs P, Mohamed-Ali V, Horakova O, Rossmeisl M, Hosseinzadeh-Attar MJ, Hensler M, Ruzickova J, Kopecky J: Polyunsaturated fatty acids of marine origin induce adiponectin in mice fed a high-fat diet. Diabetologia 49: 394–397, 2006.
- Pischon T, Girman CJ, Rifai N, Hotamisligil GS, Rimm EB: Association between dietary factors and plasma adiponectin concentrations in men. Am J Clin Nutr 81: 780–786, 2005.
- Yamamoto Y, Hirose H, Saito I, Tomita M, Taniyama M, Matsubara K, Okazaki Y, Ishii T, Nishikai K, Saruta T: Correlation of the adipocyte-derived protein adiponectin with insulin resistance index and serum high-density lipoprotein-cholesterol, independent of body mass index, in the Japanese population. Clin Sci (Lond). 103: 137-42, 2002.
- Henein H: Atlas 2: Every thing about drugs from A to Z .The complete drug reference. 20: 88, 2008.
- Wang HJ, Jin YX, Shen W, Neng J, Wu T, Li YJ, Fu ZW: Low dose streptozotocin (STZ) combined with high energy intake can effectively induce type 2 diabetes through altering the related gene expression. Asia Pac J Clin Nutr. 16: 412-7, 2007.
- Sawant SP, Dnyanmote AV, Shankar K, Limaye PB, Latendresse JR, Mehendale HM: Potentiation of carbon tetrachloride hepatotoxicity and lethality in type 2 diabetic rats. J Pharmacol Exp Ther. 308: 694-704, 2004.
- Sevillano J, De Castro J, Bocos C, Herrera E, Ramos MP: Role of insulin receptor substrate-1 serine 307 phosphorylation and adiponectin in adipose tissue insulin resistance in late pregnancy. Endocrinology 148: 5933-5942, 2007.
- Trinder P: Determination of glucose in blood using glucose oxidase with an alternative oxygen acceptor. Ann Clin Biochem 6: 24, 1969.
- Dubuis JM, Deal C, Tsagaroulis P, Clark RG, Van Vliet G: Effect of 14 days infusion of growth hormone and/or insulin like growth factor 1 on the obesity of growing zucker rats. Endocrinology 137: 2799-2806, 1996.
- Matthews DR, Hosker JP, Rudenski AS, Naylor BA, Treacher DF, Turner RC: Homeostasis model assessment: insulin resistance and B-cell function from fasting plasma glucose and insulin concentrations in man. Diabetologia 28: 412-419, 1985.
- Wahlefeld AW: Triglyceride determination after enzymatic hydrolysis: In: H.U. Bermeyer, Editor, Methods of Enzymatic Analysis (2nd English ed ) Academic Press, New York, NY : 18-31, 1974.
- Sundvall J, Leiviska J, Alfthan G, Vartiainen E: Serum cholesterol during 27 years: assessment of systematic error and affecting factors and their role in interpreting population trends. Clin Chim Acta 378: 93-98, 2007.
- Williams J: Optimization strategies for the polymerase chain reaction. Biotechniques 7: 762–9, 1989.
- Blüher M, Bullen JW JR, Lee JH, Kralisch S, Fasshauer M, Klöting N, Niebauer J, Schön MR, Williams CJ, Mantzoros CS: Circulating adiponectin and expression of adiponectin receptors in human skeletal muscle: associations with metabolic parameters and insulin resistance and regulation by physical training. J Clin Endocrinol Metab. 91: 2310-2316, 2006.
- Barnea M, Shamay A, Stark A, Madar Z: A high fat diet has a tissue-specific effect on adiponectin and related enzyme expression. Obesity 14: 2145-2153, 2006.
- Beylot M, Pinteur C, Peroni O: Expression of the adiponectin receptors AdipoR1 and AdipoR2 in lean rats and in obese Zucker rats. Metabolism 55: 396-401, 2006.
- Zhou YS, Gao Y, Guo XH, Li B, Wang S, Chi JM: Effects of timely insulin treatment on protection of beta cells in a rat model of type 2 diabetes mellitus. Chin Med J (Engl). 10: 1523-1529, 2004.
- Henry RR: Glucose control and insulin resistance in non-insulindependent diabetes mellitus. Ann Intern Med 124: 97-103, 1996.
- Langouche L, Vander Perre S, Wouters PJ, D’hoore A, Hansen TK, Van Den Berghe G:Effect of intensive insulin therapy on insulin sensitivity in the critically ill. J Clin Endocrinol Metab. 92: 3890-7, 2007.
- Mason T, Gupta N, Goh T, El-Bahrani B, Zannis J, Van De Werve G, Giacca A: Chronic intraperitoneal insulin delivery,as compared with subcutaneous delivery,improves hepatic glucose metabolism in streptozotocin diabetic rats. Metabolism. 49: 1411-6, 2000.