Keywords
Phosphate; Silicate interference; Oxalic acid; Linear sweep voltammetry
Introduction
Phosphate as an important part of phosphorus, is an essential macronutrient in freshwater that can strongly influence the organisms’ growth as primary element of phospholipids and Adenosine Triphosphate (ATP) [1]. Imbalance of phosphate level could cause severe medical states. Over the past few decades the concentrations of phosphate has increased significantly due to intensified agriculture, industry, and traffic [2]. Phosphate plays a crucial role in carbon cycle and the sequestration of limnetic carbon dioxide that can lead to eutrophication in freshwater [3]. With the rapid increase of phosphate demand of people in daily life, the pollution of phosphate constitutes a significant challenge and the determination of phosphate is becoming more and more important. In recent years, techniques have been developed for quantitative analysis of phosphate in freshwater based on its reaction with molybdenum salts in acidic medium to form a molybdophosphoric complex in the pH range 0.5-2.0. This technique based on optical method such as spectrophotometry has received a wide acceptance because of its precision [4-6]. For example, some photometric devices have been applied to the spectrophotometry determination of phosphate [7] and other ions, such as methylenediphosphonic acid, were selected as fluorescent sensor for phosphate recognition by spectrophotometry [8,9]. Many Flow-Injection Analysis (FIA) [6,10] and Sequential-Injection Analysis (SIA) [6,11,12] methods have been reported for spectrophotometric determination of phosphate. However, they are restricted by turbidity interference, unstable due to the fact that highsalinity samples can produce refractive index effects with more than one analyte [13-15] and spectrophotometry methods require complex, expensive and bulky equipment and are not consistent with site applications.
Miniaturization and energy saving are needed for in situ monitoring of phosphate. Electrochemical methods have advantages over stability and electrodes can be miniaturized by Microelectromechanical Systems (MEMS) technique. Alternate methods based on the electrochemical determination of molybdophosphoric complex have been proposed recently [15,16]. Chromoamperometry [17], cyclic voltammetry [10,18] and pulse voltammetry [15,19] have been examined for the phosphate detection. Reductions of molybdate (VI) to molybdate (IV) and molybdate (IV) to molybdate (I) are performed, producing the molybdenum blue compounds, which are intensely electroactived and improve the sensitivity of the method [17].
For determination of microgram levels of phosphates, it is a big challenge to measure phosphate accurately in the presence of interference, especially silicate in freshwater. The common analytical methodology involves the reaction of both phosphate and silicate with molybdate in acidic medium, producing the yellow molybdophosphate and molybdatosilicate [20]. Molybdophosphate and molybdatosilicate have close reduction potential. Therefore the current response of phosphate could be merged by that of the silicate interference. For the determination of phosphate and silicate by spectrometry method, inhibit reagent is one possible approach to eliminate interference of each other. The standard method recommended by the American Public Health Association (APHA) is based on the addition of oxalic acid to prevent the formation of molybdosilicate and the addition of tartaric acid to prevent the formation of molybdophosphate [21]. Galhardo and Masini used 0.25% (w/v) oxalic acid to avoid the formation of molybdosilicic acid for spectrometry determination of phosphate [11] and the detection limit is 0.1 mg/L for phosphate where cannot satisfy the determination of trace phosphate.
This paper describes a method that can reduce silicate interference for electrochemical determination of phosphate based on cathodic reduction of molybdenum. Sequential injection system and electrochemical detection cell were established for experiments and for in situ automatical monitoring of phosphate. The optimal conditions to form the molybdophosphate complex in freshwater medium were determined by addition of sulphuric acid and sodium molybdate to the solution containing orthophosphate. Oxalic acid and citric acid were subsequently devised as inhibitor. Oxalic acid displayed better anti-interference performance than citric acid, because the molybdosilicate undergoes a ligand exchange reaction with oxalate, producing silicate and molybdo-oxalate. The molybdophosphate complex is detectable by Linear Sweep Voltammetry (LSV) with an average precision of 10% compared with spectrophotometric phosphate detection in the natural samples. The method is based on SIA and the formation of reduced molybdesilicate acid using oxalic acid to improve the selectivity of phosphate.
Experimental
Reagents and solutions
All solutions were prepared by Milli-Q water and all chemicals were analytical grade reagents from Xilong Chemical Co. Ltd. Phosphate standard solutions for calibration were prepared using potassium dihydrogen phosphate (KH2PO4, Xilong Chemical Co. Ltd, Shantou, China) diluted into different concentrations.
Electrochemical experiments were performed with the Gamry Reference 600 electrochemical measurement system (Gamry Instruments Co., Ltd., USA). Four reagent solutions (R1, R2, R3, R4) were used for phosphate determination by electrochemical method. The reagent R1 was 20 mmol/L sodium molybdate solution (prepared with Na2MoO4•2H2O) in 0.1 mol/L sulfuric acid. R2 was a sodium silicate solution (Na2SiO3•9H2O) divided into different concentrations. R3 was 10 mol/L citric acid solution and R4 was 4% oxalic acid solution.
Electrochemical cell and sequential injection analysis
The electrochemical determination of phosphate is based on an electrometrical cell assembling with three–electrode system, inlet and outlet. The conceptual graph of the electrometrical cell is presented in Figure 1A. The volume of the electrochemical cell is about 300 μL. The three–electrode system includes a column gold working electrode, a column platinum counter electrode and an Ag/AgCl/KCl reference electrode (Aida Tec.Co.Ltd). Instruments used in all experiments in sequential injection mode were produced by Valco Instruments Co. Inc. Solutions were driven by a syringe pump and eight-port rotary valve, according to Figure 1B.
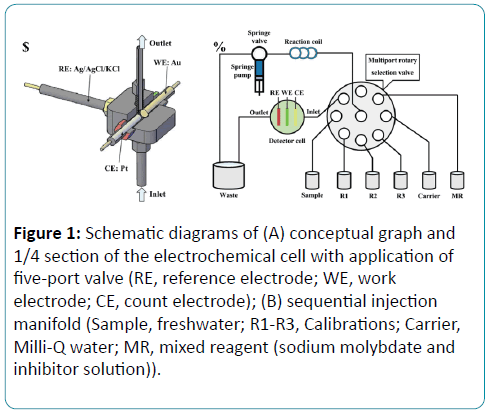
Figure 1: Schematic diagrams of (A) conceptual graph and 1/4 section of the electrochemical cell with application of five-port valve (RE, reference electrode; WE, work electrode; CE, count electrode); (B) sequential injection manifold (Sample, freshwater; R1-R3, Calibrations; Carrier, Milli-Q water; MR, mixed reagent (sodium molybdate and inhibitor solution)).
The working electrode is polished with lapping film sheet (3 M aluminum oxide, 1 μm) 22 and electrochemically cleaned in 0.5 mol/L sulfuric acid solution by cyclic voltammetry (5 cycles, from 1.5 to 0.0 V, 50 mV/s) before each measurement.
The Springe Valve (SV) connects the Multiport Rotary Selection Valve (MRSV) with Reaction Coil (RC). Sodium molybdate, inhibitor solution reagent and samples were selected respectively by MRSV and then sequentially aspirated in RC by SV. The SV stops every time when MRSV is rotating to avoid bubble. SV pumps the mixed solution through reaction cell for electrochemical detection to waste.
Reductions of molybdate were performed in the cell in an acidic medium (pH 1.0), which is optimized. For the linear sweep voltammetry measurements, molybdophosphoric performed four calibrations with the two oxidation peaks and the two reduction peaks. The most sensitive voltage was selected as the calibration line.
Freshwater collection and determination
The freshwater samples were collected from Weiming Lake, Tsinghua Lotus Pond, The Old Summer Palace’s lake and Wanquan River in Beijing. And all of them were from surface water environment with low concentration of phosphate. Samples were collected and stored in 500 mL Teflon bottles. These samples were adjusted to acidic by adding 1 mL sulfuric acid. The concentrations of phosphate in these samples were analyzed by the fabricated electrochemical cell using linear sweep voltammetry. For comparison, spectrophotometric method was also used to detect the phosphate.
Spectrophotometric method
Spectrophotometric determination of phosphate freshwater samples was done with a UV spectrophotometer (Lianhua Tec.Co.Ltd, China) using 10 mm quartz cuvette (Lianhua Tec.Co.Ltd, China). Before that, the samples were digested using the digesting unit of 5B-2P total phosphorus detection equipment manufactured by Lianhua Tec.Co.Ltd. Freshwater samples were first mixed with K2S2O8 solution in reaction tubes with well shaken. The mixtures were then put into digest equipment and heated at 120C for 30 minutes. The digested samples were mixed with ammonium heptamolybdate ((NH4)6Mo7O24•1/2H2O), antimonyl potassium tartrate (KSbC4H4O7•1/2H2O) and ascorbic acid (C6H8O6) for the spectrophotometric detection. The absorbance was registered at 700 nm according to the standard method of Water qualitydeterminations spectrophotometric method [22]. The baselines were done with standard solutions. Reproducibility tests were performed and the precision of 10% in the concentration around 0.02 mg/L was found. This precision is obtained by a multiplication of the standard deviation by two (2σ).
The concentrations of silicate in these collected freshwater samples were detected by Pony Testing International Group, which is a qualified water quality-detecting institute, according to the standard spectrophotometric method.
Results and Discussion
Reagents formation in the electrochemical cell
Phosphate is not an electroactive species while the electrochemical detection is possible in the presence of molybdate salts and in acidic media (at pH 1.0). The electroactive phosphomolybdate complex is formed by the reaction between phosphate and molybdate salt to form the Keggin anion (PMo12O403-) according to reaction (1) [17]. Voltammetry of the Keggin anion formed shows two reduction waves and two oxidation waves [23].
 (1)
(1)
The molybdosilicate complex is formed by the reaction (2) between hexafluorosilicate and molybdate salt in an acidic solution to form Keggin anion.
 (2)
(2)
There is an obvious problem of cross interference in the real water samples, which contain both silicate and phosphate. The standard method recommended by the spectrometric determination of phosphate is based on the addition of oxalic acid to prevent the formation of molybdosilicate by the reaction (3) after formation of both heteropolyacids [11]. The first two classes of heteropolyacids built on the electrochemical cell adopt bidimensional and tridimensional crystal structure, respectively (Figure 2), from which molybdosilicate may be easily intercalated or extracted by oxalic acid. For electrochemical detection of phosphate, the reported method to dissolve this problem was based on the controlling of pH. Jonca et al. indicated that there are two clearly reduction waves for each species and achieved an appropriate ratio of protons/molybdates close to 70 using proton exchange membrane [15]. Furthermore, each step of the reaction of molybdosilicate from silicic acid and molybdic between pH 1 and pH 2 was clarified by Electrospray Ionization Mass Spectrometry (ESI-MS), and the molybdic acids were decomposed at pH 1.0 [24]. In our paper, the influence of masking agent was observed by linear sweep voltammetry using sequential inject method. The mixtures adding oxalic acid or citric acid in an optimized concentration mask the interference of silicate under a proper pH condition.
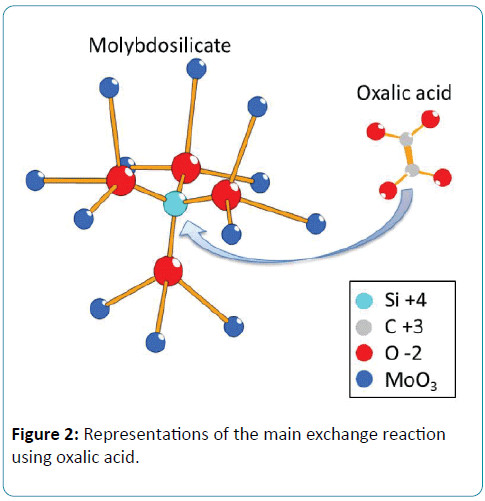
Figure 2: Representations of the main exchange reaction using oxalic acid.
 (3)
(3)
To optimize the linear sweep voltammetry of the formed Keggin anion, influence of pH and molybdate concentration were investigated. A pH range between 0.92 and 2.00 was examined by LSV in 20 mM molybdate and the best results were obtained at pH around 1.0. Figure 3A shows the variation of current for phosphate solution with the concentration of 4.0 mg/L at different pH. The influence of the molybdate concentration was studied by LSV from 0 to 40 mM at pH 1.00. Results revealed that the reductive current comes to the highest value with the molybdate concentration of 20 mM as shown in Figure 3B. At the pH higher than 1.0, more time was required for the formation of heteropolyacids [24]. Additionally, the reductive current of molybdophosphate was decreased when pH was higher than 1.0 for sequential injection system.
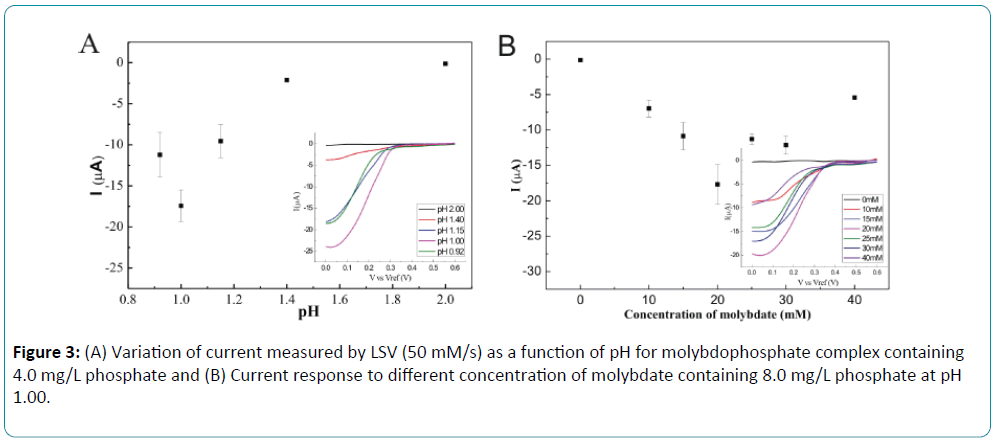
Figure 3: (A) Variation of current measured by LSV (50 mM/s) as a function of pH for molybdophosphate complex containing 4.0 mg/L phosphate and (B) Current response to different concentration of molybdate containing 8.0 mg/L phosphate at pH 1.00.
The electrochemical properties of the fabricated electrochemical system to the phosphate were verified with different concentrations of phosphate. As shown in Figure 4A, there are two reduction peaks. The first reduction peak reveals that Mo (VI) is reduced to Mo (IV) at 0.25V, and the second reductive peak is produced by the reduction from Mo (IV) to Mo (II) at 0.15V. With the increasing of the phosphate concentration, the reductive peak current increases.
Compared the current responses of these two reduction peaks, the second peak at 0.15V has a higher sensitivity than the first peak at 0.25V. As shown in Figure 4B, a dynamic linear relationship between the reduction peak current at 0.15V and phosphate concentration from 0 to 0.07 mg/L and from 0.07 to 1.0 mg/L, respectively. The sensitivities are -38.35 μA/ [mg•L-1] and -1.26 μA/[mg•L-1], respectively, with the correlation coefficient over 99%. The detection limit is 4.0 μg P/L (S/N = 3). The experiment result shows that this electrochemical cell using LSV gets a higher current response and less background current comparing to differential pulse voltammetry and chronoamperometry.
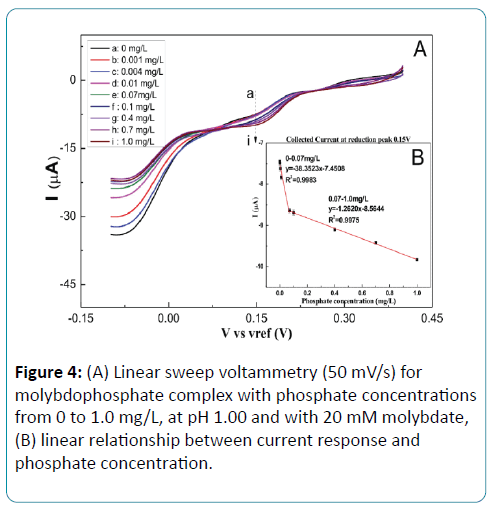
Figure 4: (A) Linear sweep voltammetry (50 mV/s) for molybdophosphate complex with phosphate concentrations from 0 to 1.0 mg/L, at pH 1.00 and with 20 mM molybdate, (B) linear relationship between current response and phosphate concentration.
Influence of masking agent
Mask solutions were developed to avoid silicate interference for spectrophotometric method [24,25], and then it is extremely important to know the impacts of the mask solutions on the analytical electrochemical method. According to the heteropolyacid composition, citric acid and oxalic acid were used as mask solutions adding to the mixture solution. The influences of the mask solutions were studied at pH 1.00 and with 20 mM molybdate for electrochemical determination (Figure 5).
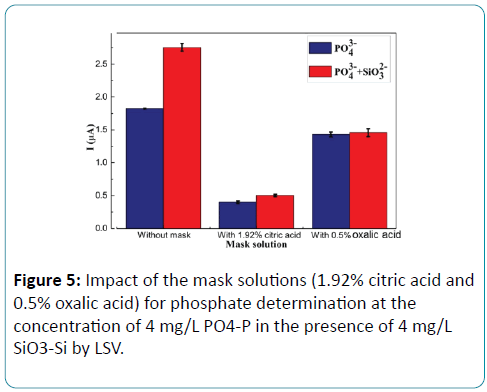
Figure 5: Impact of the mask solutions (1.92% citric acid and 0.5% oxalic acid) for phosphate determination at the concentration of 4 mg/L PO4-P in the presence of 4 mg/L SiO3-Si by LSV.
As shown in Figure 5, when no mask solutions were added to the molybdate solution, the current responses of the phosphate solutions with silicate was higher obviously than that of the phosphate solutions without silicate. The result showed that the influence of silicate on the analytical signal of phosphate is evident. When adding citric acid as masking agent, there was a little difference between the current responses of the phosphate solutions with and without silicate, but the current response of the phosphate solutions was depleted by about 80%. The experimental results showed that not only the electrochemical reaction of molybdosilicate was inhibited by citric acid but also that of phosphomolybdate. When using oxalic acid as masking agent, the current responses of the phosphate solutions with silicate decrease only about 15% comparing to phosphate solution without silicate. It can be concluded that oxalic acid as making agent for phosphate determination shows better performance than citric acid.
The influence of the masking agent concentration on the current response was also investigated in aqueous solution. The response current curve of phosphate solution with silicate interference is different from that of phosphate solution without silicate both in current value and in reduction peak. As shown in Figure 6, the current responses of 0.4 mg/L phosphate solution without silicate and masking agent at the reduction peaks of 0.17V, 0.18V and some key potentials of 0V, -0.05V were selected as reference line. Other response currents of 0.4 mg/L phosphate solution with 4 mg/L silicate and with different concentrations of masking agent at the same potentials were plotted by a ratio to the reference line. It can be seen from Figure 6A that the current response declined obviously with citric acid as the masking agent, which displayed the same result as Figure 5. Figure 6B shows the variation of the current responses with the concentration of oxalic acid. With the oxalic acid concentration of 0.01%, the least deformation was displayed. Therefore in the further experiments, oxalic acid with the concentration of 0.01% was used as masking agent.
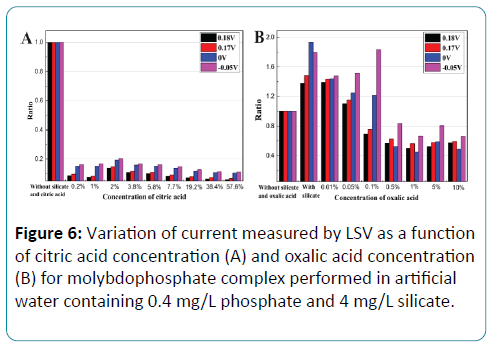
Figure 6: Variation of current measured by LSV as a function of citric acid concentration (A) and oxalic acid concentration (B) for molybdophosphate complex performed in artificial water containing 0.4 mg/L phosphate and 4 mg/L silicate.
Detection of phosphate in the presence of silicate
Standard phosphate samples (0, 0.05, 0.1, 0.4, 0.7, 1 mg/L) with 0.01% oxalic acid were prepared and detected by LSV. The reduction potentials were shift with the adding of oxalic acid in the phosphate solution. As shown in Figure 7, there are two reduction peaks at 0.18V and -0.03V. The sensitivity at -0.03V is higher than that of 0.18V. A liner relationship was displayed between the concentration of phosphate and the reduction current at -0.03V. The linear range was from 0 mg/L to 1 mg/L with the sensitivity of -6.01 μA/[mg•L-1]. The higher sensitivity indicated that oxalic acid showed a better selective determination. There is a higher sensitivity for solution with oxalic acid than without oxalic acid as compared to Figure 4B, which indicated that oxalic acid showed a better selective determination.
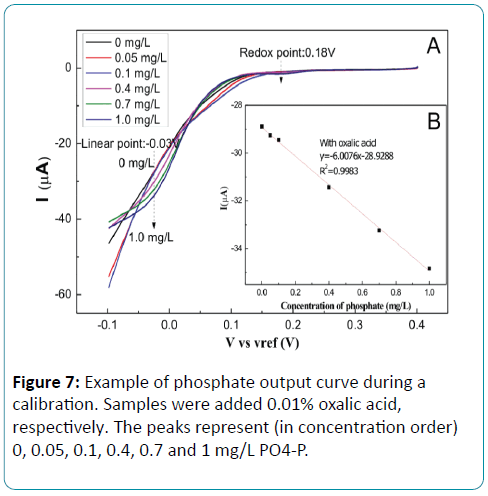
Figure 7: Example of phosphate output curve during a calibration. Samples were added 0.01% oxalic acid, respectively. The peaks represent (in concentration order) 0, 0.05, 0.1, 0.4, 0.7 and 1 mg/L PO4-P.
Freshwater samples
Trace levels of phosphate in freshwaters were detected by linear sweep voltammetry method and spectrophotometric analysis, respectively. Concentrations of silicate in freshwater samples were detected by Pony Testing International Group. Table 1 shows that the standard deviation obtained are between 0.1 μg/L and 8.4 μg/L for linear sweep voltammetry and between 1.7 μg/L and 2.3 μg/L for spectrophotometric.
| Fresh-waters |
Location |
P-SP |
P-LSV |
Si-SP |
P-Recovery (LSV/ SP) |
| (mg/L) ± σ |
(mg/L) ± σ |
(mg/L) |
| 1# |
Tsinghua Lotus Pond |
19.6±1.7 |
21.5±0.1 |
19.8 |
90.30% |
| 2# |
Wanquan River |
14.2±2.3 |
17.4±0.9 |
20.6 |
77.50% |
| 3# |
Old Summer Palace’s lake |
24.4±2.3 |
18.0±8.4 |
18.8 |
126.20% |
| 4# |
Weiming Lake |
12.5±0.6 |
11.8±0.1 |
1.3 |
105.60% |
Table 1: Comparison of Spectro Photometric (SP) and LSV for real samples determination.
An estimation of the deviation from theoretical values of phosphate concentration is provided for the classical spectrophotometric method. As shown in Table 1, the concentrations of silicate in the real samples are about 10 to 100 folds of the concentrations of phosphate. The average recoveries between spectrophotometrica method and LSV for phosphate detection in 4 freshwater samples are 90.3%, 77.5%, 126.2%, 105.6%.
An acceptable agreement between the LVS and the classical spectrophotometric method was obtained, which confirms that the interference from silicate was inhibited successfully by the masking agent of oxalic acid.
Conclusion
This work reports an electrochemical method to detect phosphate in the presence of silicate in freshwater. An electrochemical three-electrode-system was embedded in a fluidic cell and combined with a SIA system for determination of phosphate. Experimental parameters, including kind and concentration of masking agent, reagent pH and concentration of molybdate were investigated to seek for better performance. With oxalic acid used as masking agent, good consistency between electrochemical method and spectrophotometric method for phosphate determination is achieved. The saving in terms of equipment and automation design is not limited to a sample change. The electrochemical method with masking agent and the sequential inject system provide an option for in situ phosphate measurement.
Acknowledgement
The authors express our deep gratitude to the staff at the State Key Laboratory of Transducers Technology at the Institute of Electronics, Chinese Academy of Sciences for clean room and microfabrication support. We acknowledge financial support from the National Natural Science Foundation (No. 61372053), and the National Basic Research Program of China (973 Program, No. 2015CB352105).
8944
References
- Chróst RJ, Overbeck J (1987) Kinetics of alkaline phosphatase activity and phosphorus availability for phytoplankton and bacterioplankton in lake plu\see (North German Eutrophic Lake). MicrobEcol 13: 229-248.
- Castro MCR, Urrea G, Guasch H (2015) Influence of the interaction between phosphate and arsenate on periphyton's growth and its nutrient uptake capacity.Sci Total Environ 503-504: 122-32.
- Paytan A, McLaughlin K (2007) The oceanic phosphorus cycle.Chem Rev 107: 563-576.
- Patey MD, Rijkenberg MJA, Statham PJ, Stinchcombe MC, Achterberg EP, et al.(2008) Determination of nitrate and phosphate in seawater at nanomolar concentrations. TrAC Trends in Analytical Chemistry 27: 169-182.
- Ma J,Adornato L, Byrne RH, Yuan D(2014) Determination of nanomolar levels of nutrients in seawater. TrAC Trends in Analytical Chemistry 60: 1-15.
- Karthikeyan S, Hashigaya S, Kajiya T, Hirata S (2004) Determination of trace amounts of phosphate by flow-injection photometry.Anal BioanalChem 378: 1842-1846.
- O’Toole M, Lau KT, Shepherd R, Slater C, Diamond D (2007) Determination of phosphate using a highly sensitive paired emitter–detector diode photometric flow detector. AnalyticaChimicaActa 597: 290-294.
- Ganjali MR, Hosseini M, Memari Z, Faridbod F, Norouzi P, et al. (2011)A Selective recognition of monohydrogen phosphate by fluorescence enhancement of a new cerium complex. AnalyticaChimicaActapp:107-110.
- Hrynczyszyn P, Jastrzebska A, Szlyk, E(2010) Determination of phosphate compounds in meat products by 31-Phosphorus Nuclear Magnetic Resonance spectroscopy with methylenediphosphonic acid after alkaline extraction. AnalyticaChimicaActa 673: 73-78.
- Carpenter NG, Hodgson AWE,Pletcher D (1997) Microelectrode procedures for the determination of silicate and phosphate in waters - Fundamental studies. Electroanalysis 9: 1311-1317.
- Galhardo CX, Masini JC(2000) Spectrophotometric determination of phosphate and silicate by sequential injection using molybdenum blue chemistry. AnalyticaChimicaActa 417: 191-200.
- Mesquita RBR, Ferreira MTSOB,Tóth IV,Bordalo AA, McKelvie ID,et al. (2011) Development of a flow method for the determination of phosphate in estuarine and freshwaters-Comparison of flow cells in spectrophotometric sequential injection analysis. AnalyticaChimicaActa701: 15-22.
- Yaqoob M, Nabi A, Worsfold PJ (2004) Determination of nanomolar concentrations of phosphate in freshwaters using flow injection with luminolchemiluminescence detection. AnalyticaChimicaActa510: 213-218.
- Law al AT, Adeloju SB (2013) Progress and recent advances in phosphate sensors: a review.Talanta 114: 191-203.
- Jonca J, Giraud W, Barus C, Comtat M (2013) Reagentless and silicate interference free electrochemical phosphate determination in seawater. ElectrochimicaActa88: 165-169.
- Berchmans S, Issa TB, Singh P (2012) Determination of inorganic phosphate by electroanalytical methods: a review.Anal ChimActa 729: 7-20.
- Joaca J, Fernandez VL, Thouron D, Paulmier A, Graco M, et al. (2011) Phosphate determination in seawater: toward an autonomous electrochemical method. Talanta 87: 161-167.
- Guanghan L, Xiaogang W, Yanhua L, Shenlai Y (1999) Studies on 1:12 phosphomolybdicheteropoly anion film modified carbon paste electrode. Talanta 49: 511-515.
- Gardner RD, Zhou A, Zufelt NA (2009) Development of a microelectrode array sensing platform for combination electrochemical and spectrochemical aqueous ion testing. Sensors and Actuators B-Chemical 136: 177-185.
- Ferreira FL, de Lucas J, do Amaral LA (2003) Partial characterization of the polluting load of swine wastewater treated with an integrated biodigestion system. BioresourTechnol 90: 101-108.
- Saadeh M, Semerjian L, Amacha N (2012) Physicochemical evaluation of the Upper Litani River watershed, Lebanon. ScientificWorldJournal 2012: 462467.
- HodgsonAWE, Pletcher D(1998) Microelectrode procedures for the analysis of silicate and phosphate-Towards practical procedures. Electroanalysis 5: 321-325.
- Takahashi M, Abe Y, Tanaka M (2015) Elucidation of molybdosilicate complexes in the molybdate yellow method by ESI-MS.Talanta 131: 301-308.
- Du F, Li J, Li X, Zhang Z (2011) Improvement of iron removal from silica sand using ultrasound-assisted oxalic acid.UltrasonSonochem 18: 389-393.
- Ma J, Byrne RH (2012) Flow injection analysis of nanomolar silicate using long pathlength absorbance spectroscopy.Talanta 88: 484-489.