Keywords
Breast cancer; Digital mammography; Segmentation; Classification; Features extraction; MATLAB
Introduction
Breast cancer [1,3] is characterized by the uncontrolled growth of abnormal cells of the breast, the most breast cancers start from the ducts that carry milk to the nipple called ductal cancers, other type of cancer start in the glands that make breast milk called lobular cancers, there are also another types of breast cancer that are less common. There is no sure way to prevent from the breast cancer, but the women can reduce their breast cancer risk, breast cancer also develops in men. Earlier detection of cancer is curable and may increase the survivability rate of patients [4,5].
Woman’s must be checking a breasts for cancer before she has any symptoms [1-5], Screening mammograms are useful in finding likelihood of cancer in patients without any external symptom. Expert radiologists can read these mammograms to find out the abnormalities or tumor, if are there in the breast, and classifying the mammogram images into three categories: normal, benign and malignant. The normal image means that it is a healthy patient, a benign image representing the mammogram that shows the tumor, but it is not cancerous, and the malignant image is cancerous.
Related Works
There are many research have been conducted earlier on breast cancer detection, most of these studies attempts to applying the intelligent techniques to assist radiologists in the identification of abnormalities in mammograms to find the presence of breast cancer, we introduce some of them in the following:
In Ref. [6] Abdrabou and Salem, presented a model which effectively classifies breast cancer tumors as either malignant or benign, named as a benign/malignant breast cancer classification model based on a combination of ontology and case-based reasoning.
In Ref. [7] Raman, Sumari and Rajeswari, presented a classification system for the analysis of mammographic tumor by using machine learning techniques. It provides only the first stage of mammogram mass segmentation result.
In Ref. [8] Singh and Mohapatra, showed the result of application of image processing threshold, edge-based and watershed segmentation on mammogram breast image. A new approach was to determine the presence of breast cancer mass and calcification in mammography using image processing functions, K-mean and fog-c Means clustering for clear identification of clusters. By combining the K-mean and the Cmean they successfully revealed the breast cancer region in mammography images and also categorized the total area affected by cancer.
In Ref. [9] Brzakovic, Luo, and Brzakovic used fuzzy pyramid linking to identify homogeneous regions in mammograms, and then used a statistical model to classify regions as non-tumor, benign tumor, or malignant tumor.
In Ref. [10] Jiang, et al. presented a method for diagnosis using mammograms is aimed at classifying the detected cancerous regions as benign or malignant. A review of several studies demonstrating how CAD tools help in tumor diagnosis.
In Ref. [11] Jalalian, et al. This paper describes that the detection of cancer at early stage is the best way to cure it. So a new system named as CAD (Computer-Aided-Detection) plays an important role in early detection of breast cancer and helps in reducing death rates. This paper deals with the description of all the abnormalities that could occur as a breast cancer and the ways to detect it using CAD techniques. Here the Abnormalities explained are Detection of masses, Classification abnormality, architectural distortion, and bilateral asymmetry.
In Ref. [12] Kamdi, et al. provides a survey of achievements, problems being encountered, and the open issues in the research area of image segmentation and usage of the techniques in different areas. These techniques under the following three groups: Threshold-based, Edge-based and Region-based.
In Ref. [13] Alto, et al. explains the experiment investigated upon patient’s mammogram on their shape, edge sharpness and texture features. They used 3 shape features like: compactness, fractional concavity, and speculation, 14 textural features and 4 edge-sharpness features were computed to detect mass regions. Then out of these features some features are selected and using them classification is done.
In Ref. [14] Wei, et al. provides the knowledge about the content-based mammogram retrieval systems, this paper deals with the shape and margin features of mass lesions to identify the characteristic of cancer. This paper explains all the features that are used to differentiate between shape, texture, margin, density. According to this research the shape includes features like compactness, fractional concavity, speculation index. The texture features include 14 features representing the texture property.
In Ref. [15] Xie, et al. deals with the CAD (computer-aided diagnosis) technique which helps in the diagnosis of the Breast cancer with the help if extreme learning machine (ELM). Which involves segmentation of the mammographic image by removing the interference and provide image enhancement then followed by the ROI extraction on which features are collected and extracted. In this, feature selection is obtained through the combination of SVM and ELM. This proves the CAD technique not only provides the effective result but also achieves considerable reduction time in training time.
In Ref. [16] Uyun benign masses mammogram also has different texture patterns. The feature extraction is carried by first order statistics and then second order statistics where first order deals with the method of retrieving image from image histogram using parameters like- Mean, Variance, skewness, Kurtosis, Entropy. 2nd order deals with calculating the relation between using two pixels using 6 parameters like- entropy, contrast, correlation, ASM, IDM, variance. The technique used for classification is Backpropogation which is a type of artificial neural network.
In Ref. [17] Guissin, et al. explains initial stage of segmentation of isolated regions in the image. However, in the FP analysis stage we add more sophisticated steps by proposing features based on texture flow-field principles. Semi-automated segmentation schemes have been developed for the detection and classification of mammographic masses by using region growing methods. However, semi-automated schemes may not be practical in a screening set-up.
In Ref. [18,19] Guliato, et al. proposed fuzzy region growing methods for segmenting breast masses, and further classified the segmented masses as benign or malignant based on the transition information present around the segmented regions.
Breast Imaging Tests
Imaging tests use different methods to create pictures of the inside of your body. These tests can be used to look more closely at the breast, there are various Imaging tests are available for detects and diagnosis of breast cancer such are Mammograms, Breast MRI and Ultrasound.
Mammograms
A mammogram [20-22] is an X-ray image of the breast. The images of the breast by mammogram can be used to find early signs of breast cancer and stored directly on a computer (digital). Most imaging centres now use digital mammography, digital mammography may be better than X-ray image at finding breast cancer in some women.
Breast MRI
MRI [20-22] uses magnetic fields to detect cancers in dense breasts that are not detecting it by mammograms. MRI may be used with mammography for screening women at a high risk of breast cancer. Breast MRI is more invasive than a mammogram but may be costly.
Ultrasound
Breast ultrasound [20-22] uses sound waves to make images of the breast. Ultrasound it is often used as a follow-up test to detect breast tumor after an abnormal finding on a mammogram or clinical breast exam.
Proposed Approach
The purposed approach depends on segmentation digital mammogram images to separate the tumor region if there, which decide if the image is normal or abnormal, if the image is normal there is no need to classification in the future, if image is abnormal then need to analysed from the segmented portion of the image and classifying these images by MATLAB program to determine whether image is benign or malignant depending on the tumor shape, and edge-sharpness of mammogram image. The structure of purposed approach shown in Figure 1.
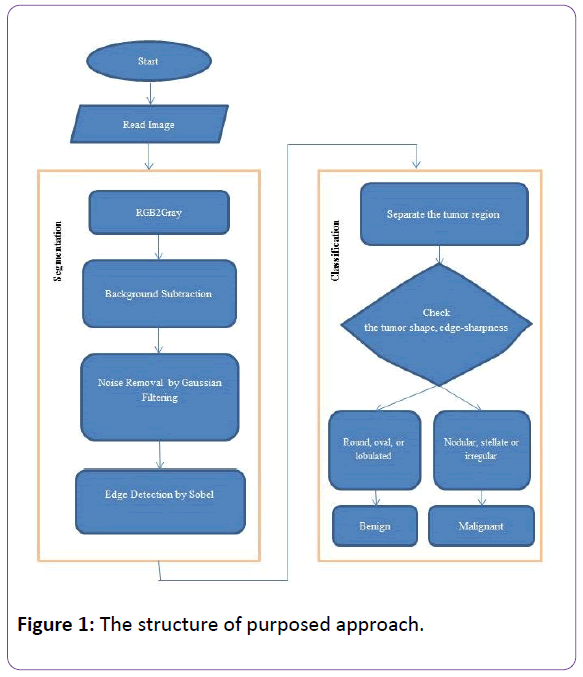
Figure 1: The structure of purposed approach.
Materials
The data sets used in our experiments contains 60 mammogram images; each mammogram is of size 1024 × 1024 pixels, and resolution of 200 micron. Which 15 mammograms were diagnosed as being benign, 22 malignant and 23 normal. The dataset taken from Zagazig University Hospitals - mammogram unit.
Segmentation of Mammograms Image
Image segmentation [23,24] is one of the most important problems in medical image processing; Segmentation is the process dividing an image into regions with similar properties such as gray level, color, texture, brightness, and contrast. The role of segmentation is to subdivide the objects in an image. There are various image segmentation techniques (i.e. Sobel operator, Prewitt operator, Robort operator and Canny operator). The objective of segmentation of suspicious areas is to get the location and classify suspicious into benign or malignant [23-26].
Edge detection by sobel operator
The operator consists of a pair of 3 × 3 convolution kernels, xdirection kernel and y-direction kernel (Figure 2). The x-direction kernel detects (gradient) horizontal lines, and y-direction kernels detect (gradient) vertical lines [23-26].
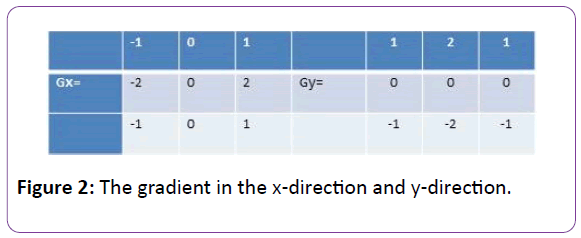
Figure 2: The gradient in the x-direction and y-direction.
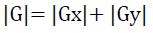
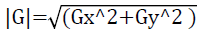
These kernels are designed to respond maximally to edges running vertically and horizontally relative to the pixel grid, one kernel for each of the two perpendicular orientations. The kernels can be applied separately to the input image, to produce separate measurements of the gradient component in each orientation, where: Gx is estimating the gradient in the xdirection (columns) and Gy is estimating the gradient in the ydirection (rows). These can then be combined together to find the absolute magnitude of the gradient at each point and the orientation of that gradient [23-27]. The gradient magnitude is given by:
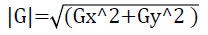
The approximate magnitude is computed using:
The angle of orientation of the edge (relative to the pixel grid) giving rise to the spatial gradient is given by:
θ=arctan(Gy/Gx)
Steps of edge detection Operator
I/P: Mammogram image
O/P: Edges detected of image
• Accept the Mammogram image.
• Applying the mask of Gx, Gy to the input image.
• Applying Sobel operator algorithm and the gradient.
• Manipulation the masks of Gx, Gy separately on the input image.
•Combined the results to find the absolute magnitude of the gradient
•The absolute magnitude is the output edges
Tumor Classification to Benign and Malignant
Tumor is found in several shapes namely: round, oval, lobulated, nodular, stellate and irregular. Tumor with more irregular shapes are malignant, on the other hand, tumor with round, regular and smooth boundaries are in benign stage (Table 1) [28-30]. Thus the mammogram image that contains benign tumor it's not cancerous, while the malignant image is cancerous. The difference between benign and malignant tumor [28-30], shown in Figure 3.
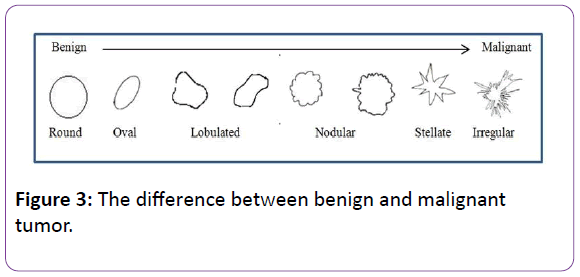
Figure 3: The difference between benign and malignant tumor.
Samples of normal breast are shown in Figure 4, samples of benign tumor are shown in Figure 5, and samples of malignant breast tumor are shown in Figure 6.
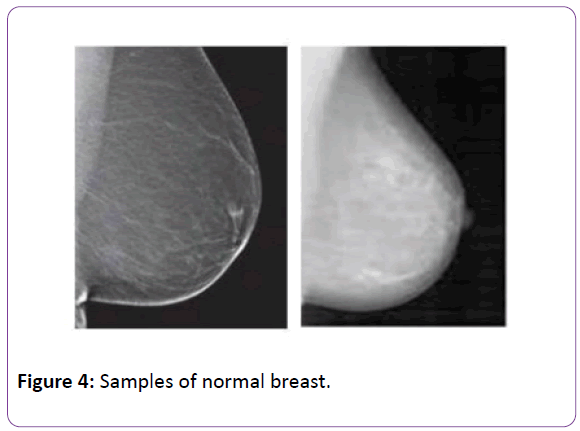
Figure 4: Samples of normal breast.
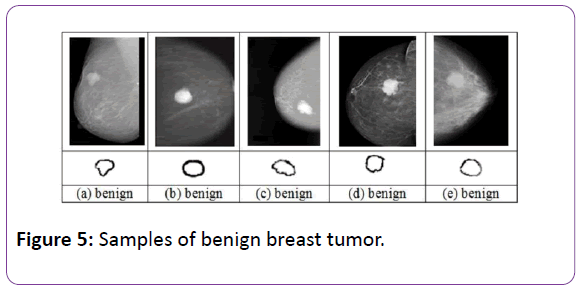
Figure 5: Samples of benign breast tumor.
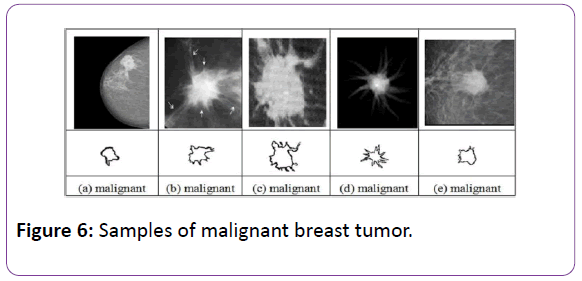
Figure 6: Samples of malignant breast tumor.
Benign versus malignant tumor
| Features |
Benign |
Malignant |
| Growing |
Slow growing |
Fast growing |
| Capsulated |
Yes |
Non- capsulated |
| Invasive |
Non- Invasive |
Invasive & infiltrate |
| Metastasis |
Non |
Yes |
| Shape |
Smooth/ oval / lobulated / regular |
Nodular /Stellate /Irregular |
| The pains |
Painful |
Painless |
| Skin |
No skin dimpling |
Skin dimpling |
| Nipple |
No nipple retraction |
Nipple retraction |
| Prognosis |
Good |
Bad |
| damage to human body |
Relatively smaller |
Relatively bigger |
Table 1: Benign versus malignant tumor.
Feature Extraction
Many features have been extracted from the abnormalities of mammograms. The extraction of texture feature methods play very important role in detecting abnormal of mammograms because of the nature of mammograms. Texture features have been proven to be useful in differentiating masses and normal breast tissues. Texture features are able to isolate normal and abnormal lesion with masses and micro-classification.
Mean
The mean estimates the value in the image in which central clustering occurs. The mean can be calculated using the formula:
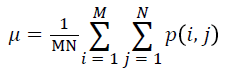
Where p(I, j) is the pixel value at point (i, j) of an image of size MxN.
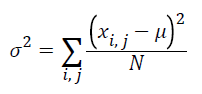
Variance
The pixel intensities vary depending on mammogram image characteristics. This variation can be used for classification of micro-calcification which can be estimated as given below:
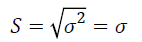
Standard deviation
The Standard Deviation, σ is the estimate of the mean square deviation of grey pixel value p (i, j) from its mean value. Standard deviation describes the dispersion within a local region. It is deter-mined using the formula:
Smoothness
Relative smoothness, R is a measure of grey level contrast that can be used to establish descriptors of relative smoothness. The smoothness is determined using the formula:
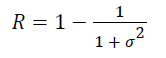
Where, σ is the Standard Deviation of the image.
Energy
Ability to detect and visualize micro-calcification can be improved using energy vector computation. Energy of mammogram image is computed by squaring and summing the pixels in transformed image and is given by:
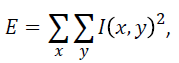
Where I is the intensity of pixel value at x,y.
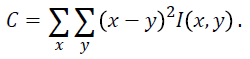
Contrast
Contrast features extracted are used in classification to locate micro-calcification. Contrast information is estimated as:
Entropy
The statistical evaluation of randomness which characterizes the texture features in mammogram image is said to be entropy and is given by:
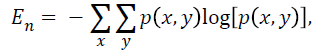
Where p is the probability of occurrence of a particular pixel value.
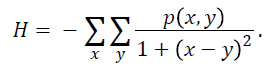
Homogeneity
Closeness of the distribution in pixel elements of ROI in mammogram image is computed using homogeneity and is given as:
Kurtosis
Estimated kurtosis value can distinguish between the benign and malignant micro-calcification through peaks and flat probability distribution which is given by:
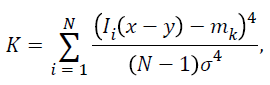
Where I(x-y) represent intensity of pixel, N represents the number of samples in circle lines, σ represents standard deviation and mk represents the mean of sub-bands. For benign micro-calcification the distribution appears to be flat and for malignant micro-calcification it appears to be peak.
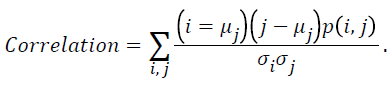
Correlation
Nearby pixels of mammogram image are highly correlated which helps in identifying the similar regions. Correlation is estimated as:
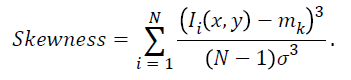
Skewness
This parameter indicates the lack of symmetry in distribution of pixels. This estimation gives an idea about symmetry and lack of symmetry within ROI in mammogram image. Skewness is estimated as:
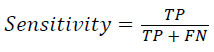
Sensitivity
Ability of a classifier to identify the positive results quantitatively is evaluated as Sensitivity which is given as:
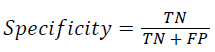
Specificity
Ability of a classifier to identify the negative results is estimated as specificity, given as:
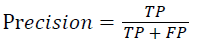
Precision
Precision is defined as the proportion of true positive against all possible results and is given as:
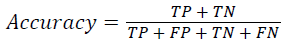
Accuracy
Accuracy determines the efficiency of classifier in terms of true positive and true negatives indicating the proportion of true results:
Classification of Breast Tumors by MATLAB
We suggest MATLAB [31-34,35] program to enhancement the detection and classification of breast tumor on mammograms, these classification steps are:
1. Check if the image contains tumor or no.
2. If no tumor found then-normal image.
3. If found tumor then-abnormal image.
4. Image segmentation:
• Convert RGB to gray.
• Applying the Gaussian filter to removing the noise from the image.
• Detect the boundaries of image by sobel edge detection.
5. Classifying the tumor based on shape of tumor, and edgesharpness:
• Separate the tumor region from the image
• If tumor region is round or oval or lobulated then Benign tumor.
• If tumor region is nodular or stellate or irregular then Malignant tumor.
The proposed system is implemented by MATLAB program where the front user interface GUI is designed in a user friendly manner to help who use the system without any hassles. In the following figures we are display some output of mammogram images and how the MATLAB program can be classifying them to: normal, benign, and malignant as shows in Figure 7a normal, Figure 7b, Figure 7c contains benign tumor, and Figure 7d, Figure 7e contains malignant tumor.
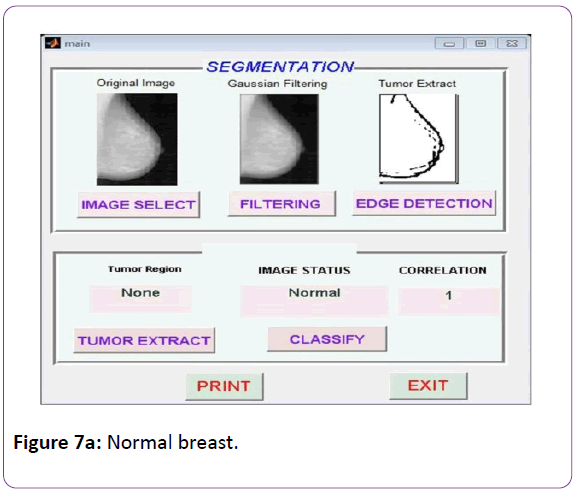
Figure 7a: Normal breast.
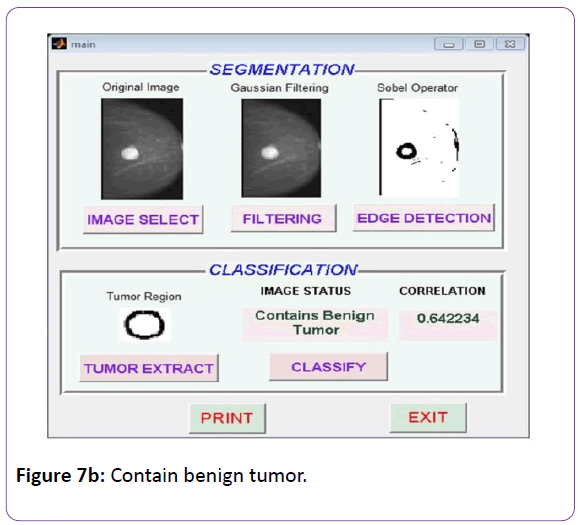
Figure 7b: Contain benign tumor.
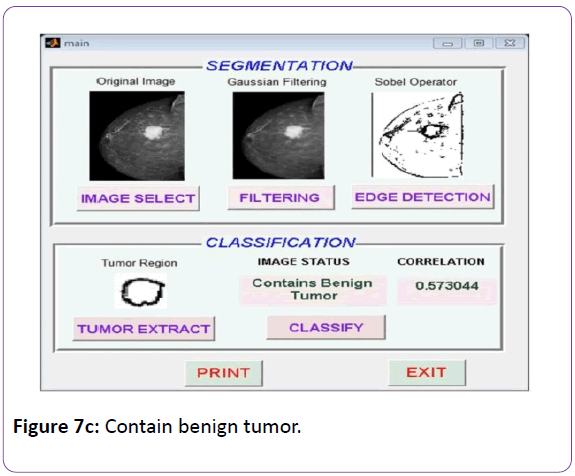
Figure 7c: Contain benign tumor.
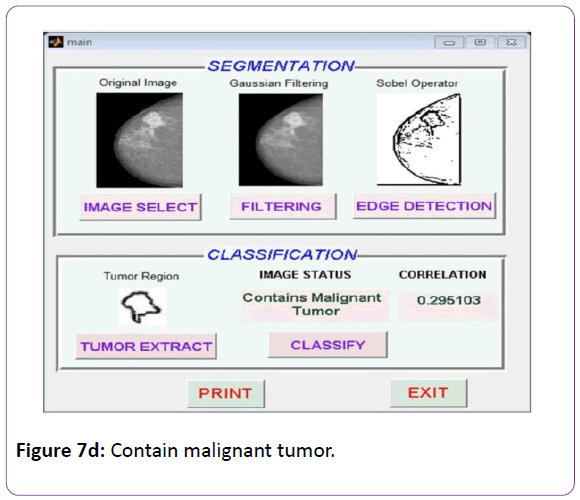
Figure 7d: Contain malignant tumor.
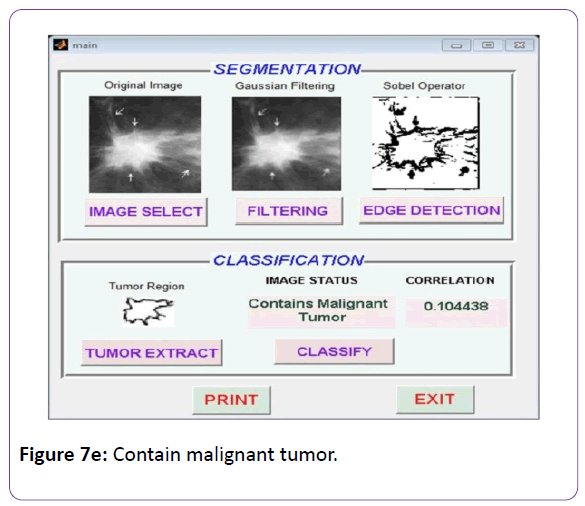
Figure 7e: Contain malignant tumor.
Discussion and Results
In this study, we have demonstrated that the proposed system is decide if mammogram image is normal or abnormal, and determines whether the abnormal one is benign or malignant. We showed that the correlation for image in Figure 7a is 1.00, the correlation for image in Figure 7b is 0.642234, the correlation for image in Figure 7c is 0.573044, the correlation for image in Figure 7d is 0.295103, the correlation for image in Figure 7e is 0.104438. i.e. the correlation for normal breast images are 1.00, while benign breast images have a correlation between 1.00 and 0.5, and malignant breast images have a correlation between 0.00 and 0.5
Conclusion
Proposed system is developed to improve the correct detection and diagnosing of abnormalities in the breast from mammograms. The proposed system is implemented by MATLAB program which segmented digital mammograms and separate the tumor regions and classifying these images based on feature extraction, shape of tumor, and edge-sharpness. The system can detect the cancerous regions of a mammogram and classify them as normal, benign, or malignant.
Thus the main aim behind the whole detection of mass lesions is to obtain the greater accuracy of diagnosis during the early stage of cancer so the cancer would be detected as soon and decrease the death rates.
20187
References
- Hamouda SKM, Abo El-Ezz HR, Wahed ME (2017) Intelligent System for Predicting, Diagnosis and Treatment of Breast Cancer. Int J Biomed Data Min 6: 128.
- Hamouda SKM, El-Ezz RHB, Wahed ME (2017) Intelligent System for Predicting and Diagnosis of Breast Cancer. International Journal of Emerging Science and Engineering 4: 29-35
- Abdrabou E, Salem A (2010) A breast cancer classifier based on a combination of case-based reasoning and ontology approach, Proc. Int. Multiconf. Com sci. Inform. Technol 331-337.
- Raman V, Sumari P, Rajeswari M (2010) A theoretical methodology and prototype implementation for detection segmentation classification of digital mammogram tumor by machine learning and problem solving approach, Int J Com Sci 7: 38-44.
- Singh N, Mohapatra A (2011) Breast cancer mass detection in mammograms using k-means and fuzzy c-means clustering, Int. J Com Appl 22: 15-21.
- Brzakovic D, Luo XM, P. Brzakovic (1990) An approach to automated detection of tumors in mammograms. IEEE Transactions on Medical Imaging 9: 233-241.
- Jiang Y, Nishikawa RM, Schmidt RA, Metz CE, Giger ML, et al. (1999) Improving breast cancer diagnosis with computer-aided diagnosis, Academic Radiology 6: 22-33.
- Jalalian A, Mashohor SBT, Mahmud HR, Saripan MIB, Ramli ARB, et al. (2013) Computer-aided detection/diagnosis of breast cancer in mammography and ultrasound: A Review Clin Imaging 37: 420-426.
- Kamdi S, Krishna RK (2012) Image Segmentation and Region Growing Algorithm, 2: 103-107.
- Alto H, Tn C (2005) “Content-based retrieval and analysis of mammographic masses 14: 1-17.
- Wei C, Chen SY, Liu X (2012) Mammogram retrieval on similar mass lesions 6: 234-248.
- Xie W, Li Y, Ma Y (2015) Breast mass classification in digital mammography based on extreme learning machine. Neurocomputing 1-12.
- Uyun S (2013) Selection Mammogram Texture Descriptors Based on Statistics Properties Backpropagation Structure 11: 1-5.
- Guissin R, Brady JM (1992) Iso-Intensity Contours for Edge Detection, Tech Rep OUEL 1935/92.
- Guliato D, Rangayyan RM, Carnielli WA, Zuffo JA, Desautels JEL, (1998) Segmentation of breast tumors in mammograms by fuzzy region growing, Proc. 20th Annu. Int. Conf. IEEE Engineering in Medicine and Biology Society 1002–1004.
- Guliato D, Rangayyan RM, Zuffo JA, Desautels JEL (1998) Detection of breast tumor boundaries using iso-intensity contours and dynamic thresholding, in Proc. 4th Int.Workshop Digital Mammography, N. Karssemeijer, M. Thijssen, J. Hendriks, L. van Erning, (editors) Nijmegen. The Netherlands 253-260.
- American Cancer Society (2016) “Mammograms and Other Breast Imaging Procedures.
- Sree SV, Ng EYK, Acharya RU, Faust O (2011) Breast imaging: A survey. World J Clin Oncol 2: 171-178.
- American Cancer Society (2016) Breast Cancer Early Detection and Diagnosis.
- Gomes J, Veltto L (1997) Image processing for computer graphics, Springer-Velag, New York, Inc.
- Hussain AA (2005) Dependent The Algorithm of Linear And Gaussian Square Fitting To Determine The Edge In Digital Image, Babylon University College of Science.
- Smith SW (1997) The Scientist and Engineer's Guide to Digital Signal processing, California Technical Publishing.
- Umbough SE (1998) Computer Vision and Image Processing A practical Approach Using CVIP Tools. Prentice-Hall.
- Brzakovic D, Luo XM, Brzakovic P (1990) An approach to automated detection of tumors in Mammograms, IEEE Transactions on Medical Imaging. 9: 233-224
- Jiang Y, Nishikawa RM, Schmidt RA, Metz CE, Giger ML (1999) Improving breast cancer diagnosis with computer-aided diagnosis. Academic Radiology 6: 22-33.
- Sahakyan A, Sarukhanyan H (2012) Segmentation of the Breast Region in Digital Mammograms and Detection of Masses, (IJACSA) International Journal of Advanced Computer Science and Applications 3: 2.
- Gonzalez RC, Woods RE, Eddins SL (2004) Digital image processing using MATLAB, Prentice Hall.
- Walter Gander (2015) Learning MATLAB: A Problem Solving Approach ETH Zurich.
- Fitzpatrick JM (2013) Computer Programming with MATLAB, Vanderbilt University.