Keywords
Oral submucous fibrosis, Morphometric analysis, Connective tissue
Introduction
Oral Submucous Fibrosis (OSF) is a common oral health problem in the Indian subcontinent. OSF was first reported by Schwartz and defined by Pindborg et al. [1] as an insidious, chronic disease affecting any part of the oral cavity and sometimes the pharynx. Although occasionally preceded by and/or associated with vesicle formation, it is always associated with a juxta-epithelial inflammatory reaction followed by a fibroelastic change of the lamina propria, with epithelial atrophy leading to stiffness of the oral mucosa and causing trismus and inability to eat. Current evidence suggests that arecoline in the areca nut is the key factor in initiating the disease process. The important histopathological characteristics of this disease include epithelial atrophy with loss of rete ridges, reduced vascularity, chronic inflammatory infiltration and hyalinization of the submucosal tissues [2]. The epithelial atrophy observed in OSMF is presumed to be secondary to increased collagen production and reduced vascularity seen in the adjoining connective tissue, in different stages. The degree of vascularity of the diseased mucosa in OSMF has always been a matter of considerable dispute. According to few studies, dilated and congested blood vessels are seen in early stages of OSMF. Whereas, obliteration or narrowing of blood vessels points to advanced stage [3].
Aim and Objectives of the Study
The aim of this study to determine morphometrically epithelial and connective tissue changes in Oral Submucous Fibrosis. This study includes parameter such as assessing histopathological changes in epithelial thickness, determining the mast cell density, to determine mean density of capillaries, mean luminal diameter and circumference of capillaries in different grades of OSMF and to correlate the epithelial thickness, mast cell density, mean density, mean luminal diameter and circumference of capillaries among various grades of OSMF with controls.
Materials and Methods
1. Trinocular Research Microscope Olympus Bx-53 Japan with Digital camera (Figure 1)
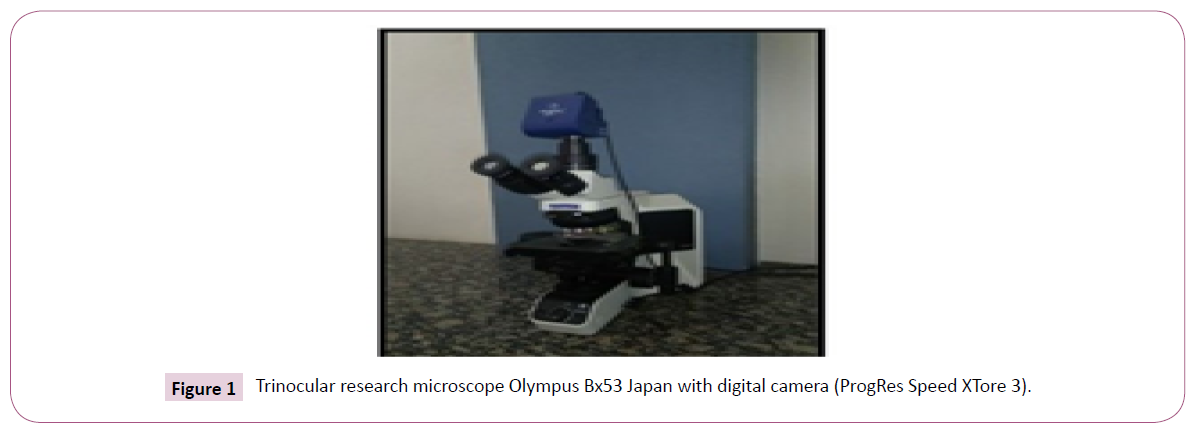
Figure 1: Trinocular research microscope Olympus Bx53 Japan with digital camera (ProgRes Speed XTore 3).
2. Computer and Image analysis software
3. Leica RM 2245 Semi-Automatic Microtome (Figure 2)
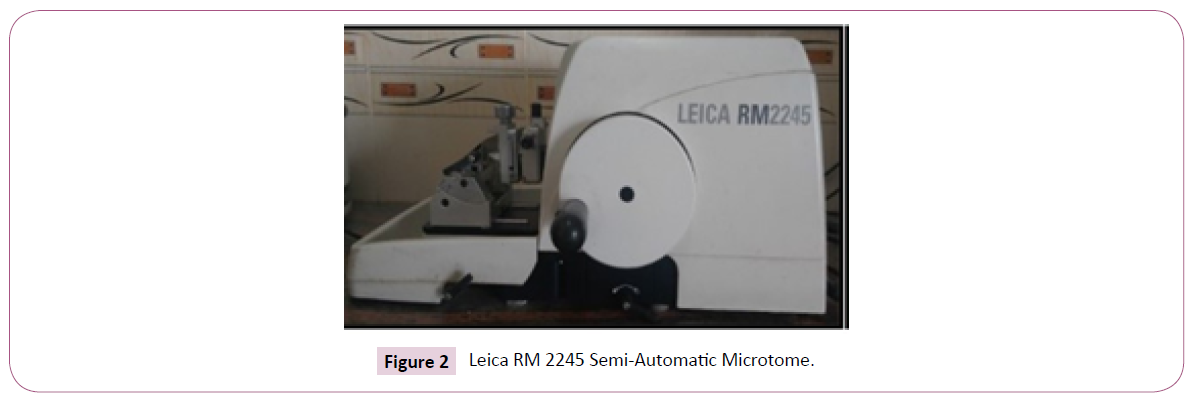
Figure 2: Leica RM 2245 Semi-Automatic Microtome.
4. Harris’s Hematoxylin & Eosin stain (Figure 3)
Figure 3: Chemical used for H and E staining.
5. 1% Toluidine blue stain (Figure 4)
Figure 4: Chemicals used for 1% Toluidine blue staining.
6. Microscopic slides & cover slip
7. DPX (Dibutyl Phthalate Xylene) Mountant
Method of collection of the data
The control group will comprise of 10 paraffin embedded blocks of normal buccal mucosa, collected from archives of Department of Oral Pathology & Microbiology. 25 paraffin embedded tissue blocks in each histological grade of OSMF will form the study group. The study group will be selected based on the following criteria.
Inclusion criteria: Stored tissue blocks are histopathologically confirmed cases of OSMF will be included for the study.
Exclusion criteria: Tissue blocks of patients with any history of systemic diseases which may affect capillary characteristics like Diabetes mellitus, Hypertension from medical records of patients. Tissue blocks of patients without adequate clinical details and tissue for analysis.
Methodology
Paraffin embedded histopathologically confirmed tissue blocks were taken, where 5-6 μm thick sections are made. 25 slides are made in each grade of oral submucous fibrosis for hematoxylin & eosin staining as well as toluidine blue staining (the study group), 10 paraffin embedded normal mucosal tissue blocks are sectioned in same thickness for hematoxylin & eosin staining and toluidine blue staining (control group). All the prepared slide is stained in hematoxylin & eosin stain 4 and 1% toluidine blue stain.5 6 The sections were examined in bright field microscope and the slides are graded according to Pindborg JJ and Sirsat SM [1] classification1 of oral submucous fibrosis. All the OSF slides and the control are viewed under trinocular research microscope and the image of the selected field were captured and quantified in image Prog Res Capture 2.8.8 version software (inbuilt measurement tool for all of the parameter chosen).
Measurement of epithelial thickness
Photographs of Study group and the control were captured with the help of camera (ProgRes Speed XTcore 3) fitted onto the microscope (Trinocular Research Microscope Olympus BX-53 Japan). Images are morphometrically measured (in μm) at 3 points from epithelial surface to epithelial connective tissue interface using Prog Res Capture 2.8.8 version image analysis software at 200x magnification in 5 different fields. The mean of the 3 measurements from 5 fields were taken as the thickness of the epithelium.
Areas selected for capillary analysis
The density of the capillaries is calculated by counting the number of capillaries in five randomly selected high-power fields in a stepladder fashion, immediately adjacent to basement membrane (i.e. juxtaepithelial area) and the submucosa towards the epithelium. Capillaries which are seen in longitudinal section were excluded. Capillary density was calculated by the following formula.
Mast cell density analysis using 1% toluidine blue stain
Mast cell density were analyzed by counting the mast cells manually in 10 random microscopic grid fields under the magnification of 400x in a stepladder fashion. Mast cells were expressed as an average number per 10 high power field. The counting of mast cell was done by two different observers to minimize the subjectivity. The number of mast cells/sq.mm was calculated by using the formula.
Histomorphometry
A cursor was used to outline the luminal diameter and the luminal circumference of the capillaries at a magnification of 400x, and measured morphologically using image analysis software. The obtained data were transferred to Microsoft-Office Excel work sheet for further analysis. All the slides were assessed by two different observers to minimize the subjectivity. The mean average scores were tabulated and used for statistical analysis [4-6].
Results
The study group comprised of histopathologically diagnosed cases of oral submucous fibrosis (n= 25 in each grade of OSF for both H & E staining as well as toluidine blue staining). The OSF group was subdivided into very early, early, moderately advanced and advanced stages according to Pindborg and Sirsat criteria [1]. The very early and early stages were considered as grade 1 of OSF as the sample size of very early stage was minimal and moderately advanced stage is grade 2 and advanced stage was considered as grade 3. The present study was done to analyse morphometrically the epithelial and the connective tissue changes in different stages of oral submucous fibrosis which forms the study group and it was compared with that of the control group. The study group comprises 25 in each grade of OSF for H and E staining and 1% Toluidine blue stain which were chosen under various criteria, sectioned and stained. The stained sections were morphometrically analysed for various parameters using trinocular research microscope and the Prog res capture 2.8.8 version software.
Statistical analysis
All statistical procedures were performed using Statistical Package for Social Sciences (SPSS) 20.0. All quantitative variables expressed in mean and standard deviation. Qualitative variables are expressed in percentages. Shapiro-Wilk test was used for testing the normality assumption of the data. One-way ANOVA was used to test the association. Probability value (p <0.05) were considered statistically significant.
Distribution of the subjects
In OSF group, age group for grade 1 stage were 20-42 years within the duration of habit 1 – 6 years (Table 1). In case for grade 2 stage the subjects were in the group 35-52 years within a duration of 2-10 years (Table 2). In grade 3 stage of OSF the subjects were in the age group of 45-62 years within 6-20 years of duration (Table 3). Predominately OSF occurred in male when compared to females and the enrolled subjects were in younger age (Table 4).
| S.No |
Age |
Sex |
Duration of the habit in years |
| 1 |
20 |
M |
1 |
| 2 |
22 |
M |
1 |
| 3 |
26 |
M |
5 |
| 4 |
27 |
F |
1 |
| 5 |
28 |
F |
1 |
| 6 |
29 |
M |
1.5 |
| 7 |
30 |
M |
1.5 |
| 8 |
31 |
M |
1.5 |
| 9 |
31 |
F |
6 |
| 10 |
32 |
M |
1 |
| 11 |
33 |
F |
5 |
| 12 |
33 |
M |
1 |
| 13 |
34 |
M |
2 |
| 14 |
34 |
M |
4 |
| 15 |
35 |
F |
6 |
| 16 |
35 |
M |
6 |
| 17 |
36 |
M |
2 |
| 18 |
36 |
M |
4 |
| 19 |
37 |
F |
1.5 |
| 20 |
37 |
M |
3 |
| 21 |
39 |
M |
2 |
| 22 |
40 |
M |
3 |
| 23 |
40 |
M |
2 |
| 24 |
41 |
M |
2 |
| 25 |
42 |
F |
2 |
Table 1 Showing age and duration of habit in Grade 1 OSF.
| S.No |
Age |
Sex |
Duration of the habit in years |
| 1 |
50 |
M |
10 |
| 2 |
45 |
M |
9 |
| 3 |
41 |
M |
8 |
| 4 |
46 |
M |
8 |
| 5 |
48 |
M |
7 |
| 6 |
49 |
M |
7 |
| 7 |
52 |
M |
7 |
| 8 |
36 |
F |
6 |
| 9 |
43 |
M |
6 |
| 10 |
46 |
M |
6 |
| 11 |
47 |
M |
6 |
| 12 |
51 |
M |
6 |
| 13 |
35 |
F |
5 |
| 14 |
37 |
M |
5 |
| 15 |
38 |
M |
5 |
| 16 |
40 |
M |
5 |
| 17 |
41 |
F |
5 |
| 18 |
42 |
M |
5 |
| 19 |
43 |
M |
5 |
| 20 |
45 |
M |
5 |
| 21 |
42 |
F |
4 |
| 22 |
44 |
F |
4 |
| 23 |
47 |
M |
4 |
| 24 |
39 |
F |
3 |
| 25 |
44 |
M |
2 |
Table 2 Showing age and duration of habit in Grade 2 OSF.
| S.No |
Age |
Sex |
Duration of the habit in years |
| 1 |
51 |
M |
6 |
| 2 |
52 |
M |
6 |
| 3 |
54 |
F |
6 |
| 4 |
53 |
M |
6.5 |
| 5 |
55 |
M |
6.5 |
| 6 |
56 |
M |
6.5 |
| 7 |
53 |
M |
7 |
| 8 |
54 |
M |
7 |
| 9 |
57 |
M |
7.5 |
| 10 |
58 |
F |
7.5 |
| 11 |
55 |
M |
8 |
| 12 |
56 |
F |
8 |
| 13 |
59 |
M |
8 |
| 14 |
60 |
M |
8 |
| 15 |
61 |
F |
8 |
| 16 |
45 |
M |
10 |
| 17 |
52 |
M |
12 |
| 18 |
49 |
M |
13 |
| 19 |
51 |
M |
14 |
| 20 |
48 |
F |
15 |
| 21 |
62 |
M |
15 |
| 22 |
47 |
M |
16 |
| 23 |
57 |
M |
17 |
| 24 |
46 |
M |
18 |
| 25 |
50 |
M |
20 |
Table 3 Showing age and duration of habit in Grade 3 OSF.
| Stages |
Gender |
|
|
|
| Grade |
Males |
Females |
Age Range |
Duration of Habits |
| 1 |
18 |
7 |
20-42 |
1-6 Years |
| 2 |
19 |
6 |
35-52 |
2-10 years |
| 3 |
20 |
5 |
45-62 |
6-20 Years |
| |
57 |
18 |
|
|
| Mean of the age was 43.46 years where 76% (57) were males and 24% (18) were females |
Table 4 Demographic Data.
Morphometric parameters
Mean Epithelial thickness in different groups of OSF: In comparison of Epithelial thickness in different grades of OSF grade I showing mean value and SD of 5.03 ± 1.78 (Figure 5), grade II shows 5.12 ± 1.17 (Figure 6) and grade III shows 3.7 ± 1.07 (Figure 7) in comparison with control 2.73 ± 0.38 (Tables 5 and Graph 1). Morphometrically the variation in the epithelial thickness was statistically significant (p value < 0.05) (Figure 8).
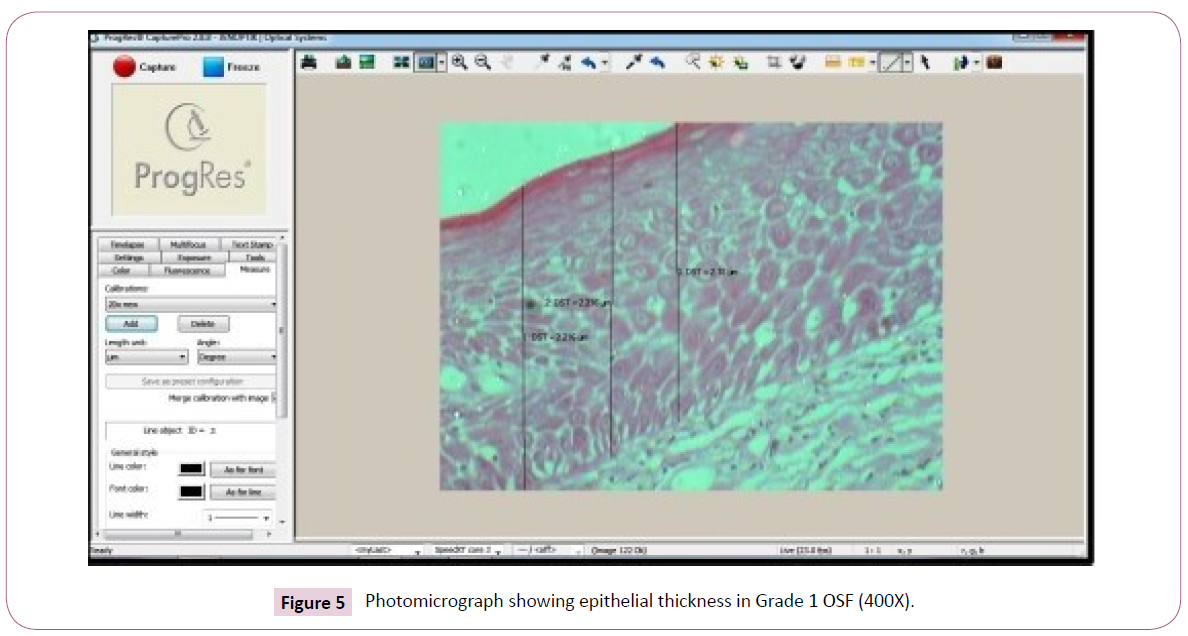
Figure 5: Photomicrograph showing epithelial thickness in Grade 1 OSF (400X).
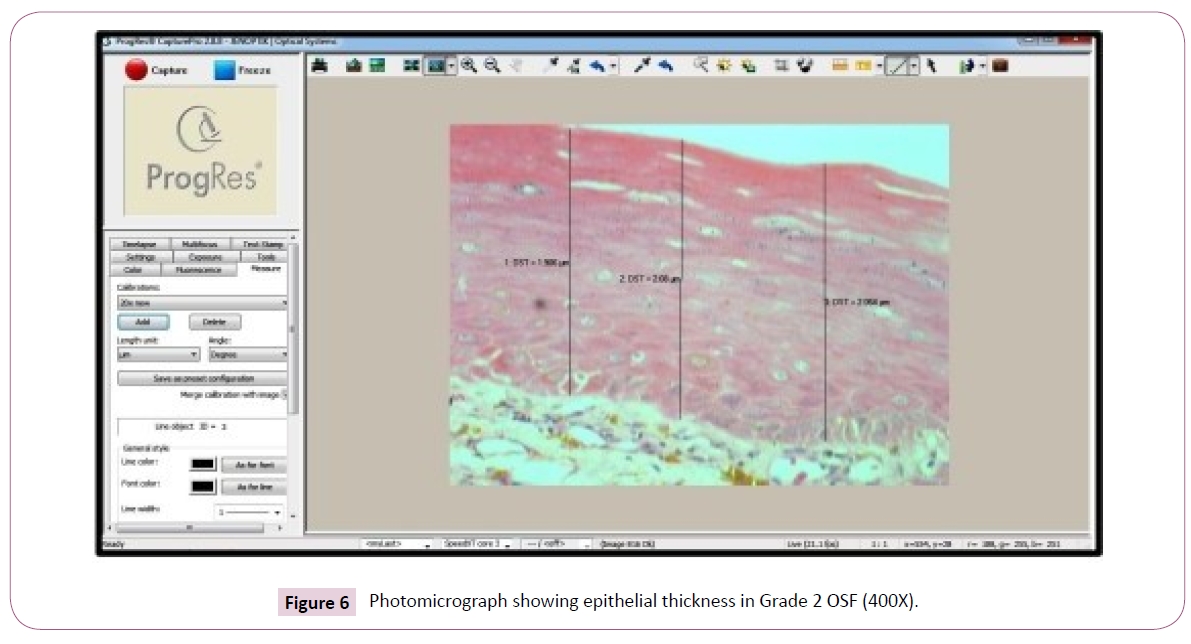
Figure 6: Photomicrograph showing epithelial thickness in Grade 2 OSF (400X).
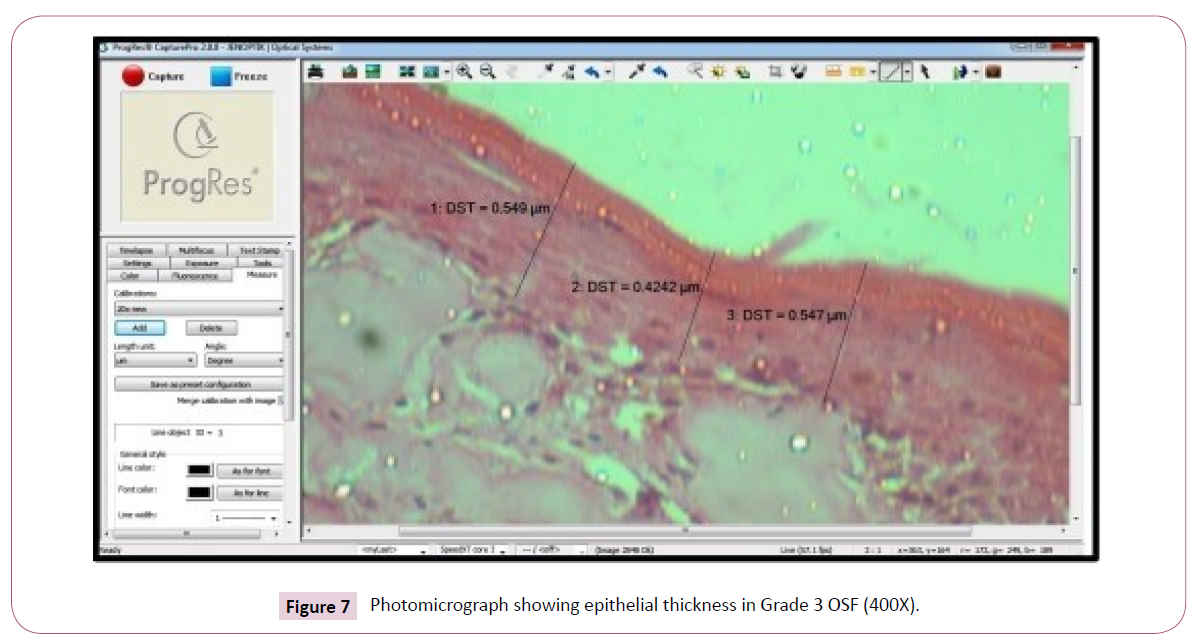
Figure 7: Photomicrograph showing epithelial thickness in Grade 3 OSF (400X).

Figure 8: Photomicrograph showing epithelial thickness in control group (400X).
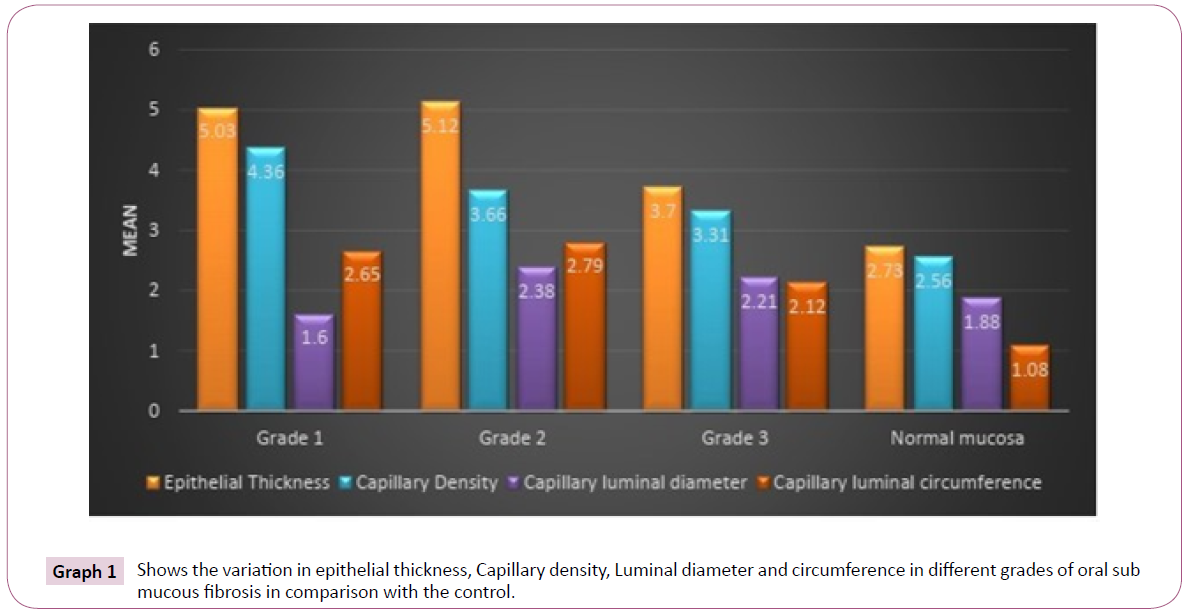
Graph 1: Shows the variation in epithelial thickness, Capillary density, Luminal diameter and circumference in different grades of oral sub mucous fibrosis in comparison with the control.
| Stage |
Epithelial Thickness (µm) |
Capillary Density(µm) |
Capillary luminal diameter (µm) |
Capillary luminal circumference (µm) |
| Grade l |
5.03 ± 1.78 |
4.36 ± 1.09 |
1.60 ± 0.74 |
2.65 ± 1.04 |
| Grade 2 |
5.12 ±1. J7 |
3.66 ± 0.9 J |
2.38 ± 1.10 |
2.79 ± I.O J |
| Grade 3 |
3.70 ± 1.07 |
3.3J ± I.O J |
2.2 1 ± 0.78 |
2.12 ± 0.83 |
| Control |
2.73 ± 0.38 |
2.56 ± 0.78 |
1.88 ± 0.89 |
1.08 ± 0.70 |
| *. The mean difference is si1mificant - o value <0.05 |
Table 5 Showing the comparison of epithelial thickness, capillary density, Luminal diameter and circumference in different grades of oral sub mucous fibrosis.
Mean Capillary density in different groups of OSF: In this study, comparison of capillary density in different grades of OSF grade I have shown the mean value and the SD of 4.36 ± 1.09 (Figure 9). In respect to grade II shows 3.66 ± 0.91 (Figure 10) and grade III shows 3.31 ± 1.01 (Figure 11) in comparison with the control 2.56 ± 0.78 (Figure 12) (Table 5 and Graph 1). The analysed parameter was statistically significant (p value < 0.05).
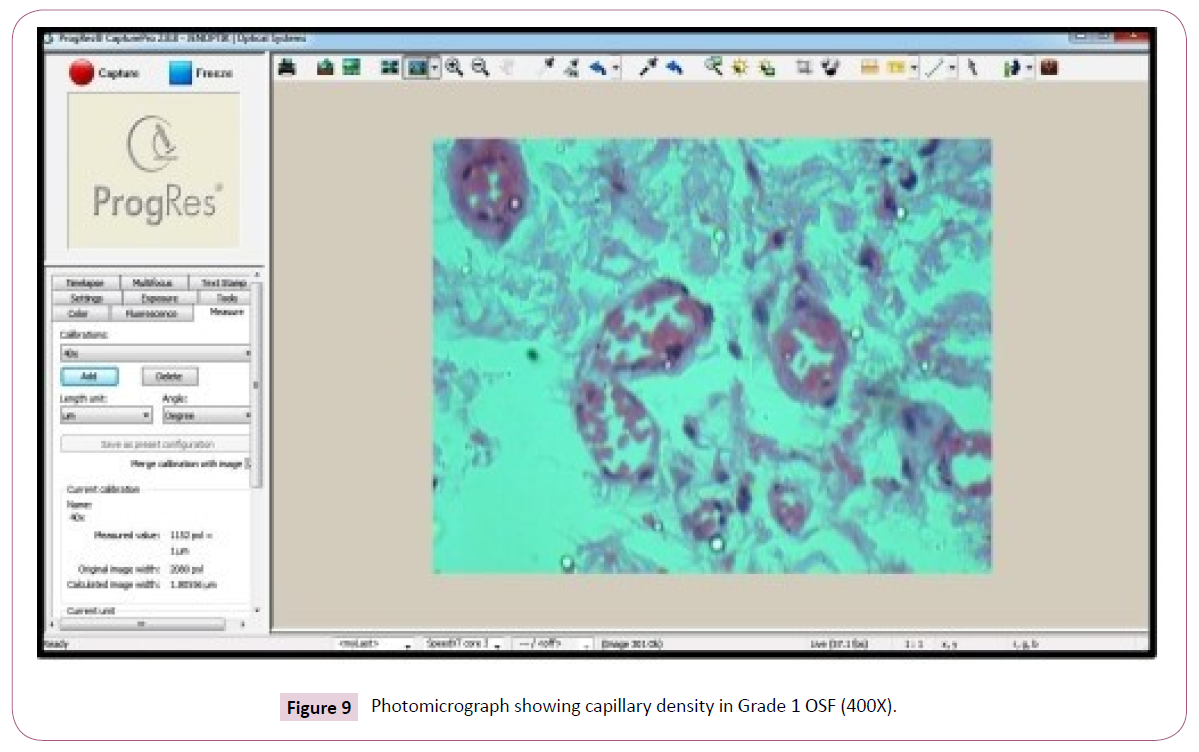
Figure 9: Photomicrograph showing capillary density in Grade 1 OSF (400X).
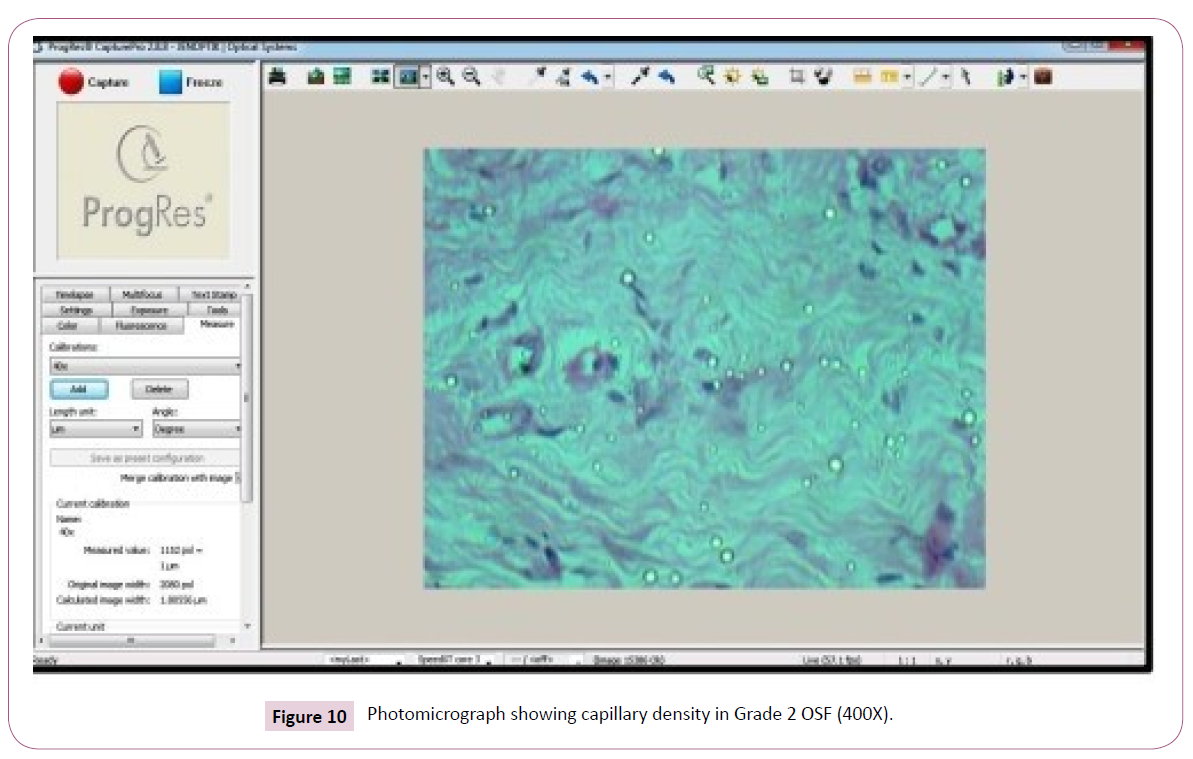
Figure 10: Photomicrograph showing capillary density in Grade 2 OSF (400X).
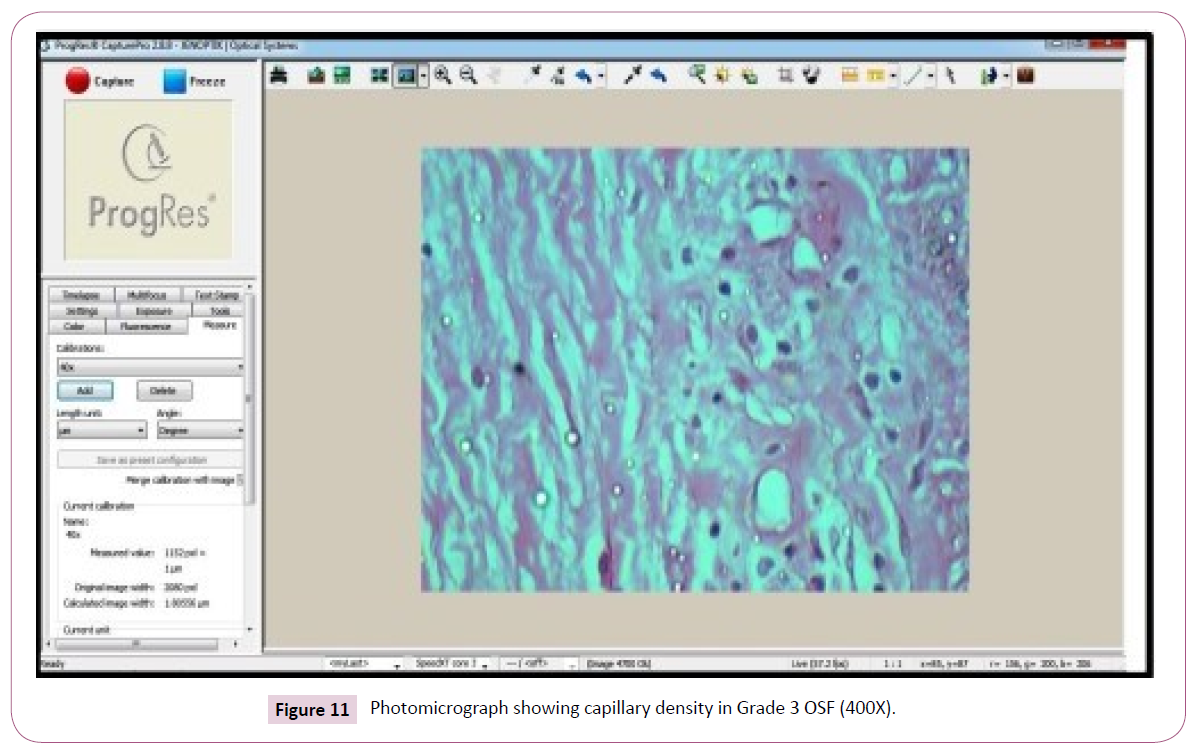
Figure 11: Photomicrograph showing capillary density in Grade 3 OSF (400X).
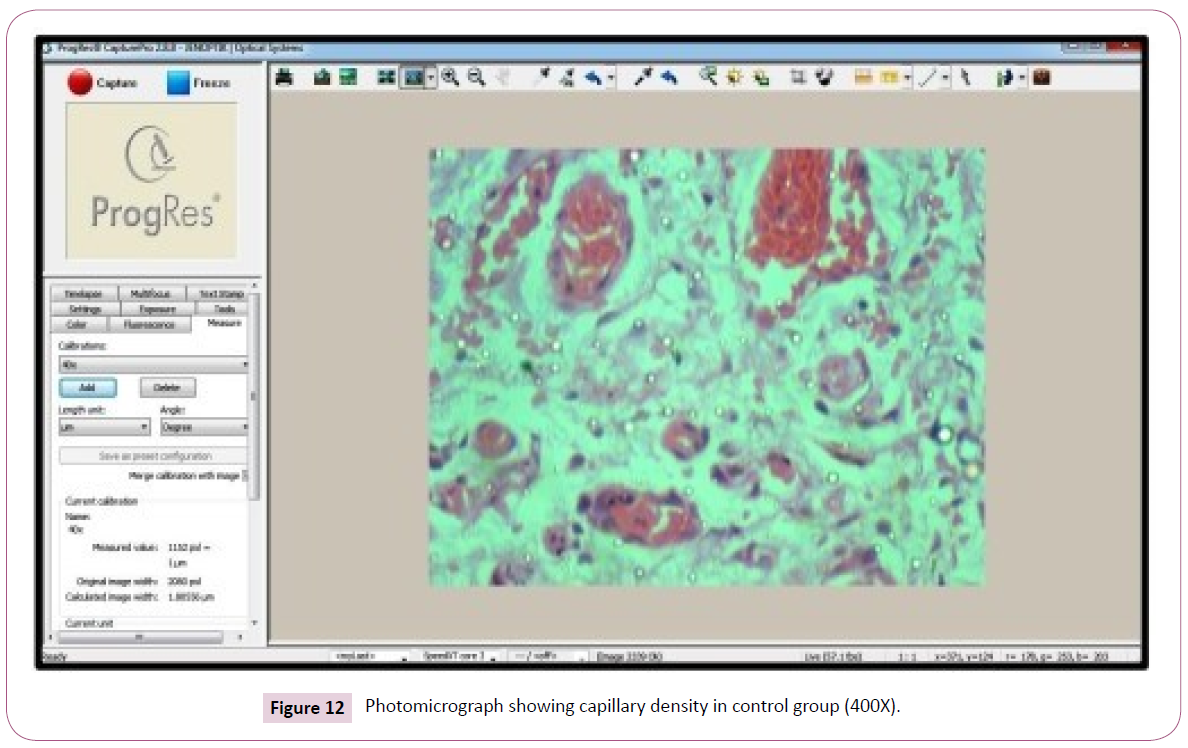
Figure 12: Photomicrograph showing capillary density in control group (400X).
Mean luminal diameter and the circumferences of the capillaries in different groups of OSF: In our study the luminal diameter and circumferences of the capillaries in grade I OSF shows the mean value and SD shows 1.60 ± 0.74 & 2.65 ± 1.04 (Figure 13). In grade II OSF shows 2.38 ± 1.10 & 2.79 ± 1.01 (Figure 14), and grade III shows 2.21 ± 0.78 & 2.12 ± 0.83 (Figure 15) in comparison with the control Results 1.88 ± 0.89 & 1.08 ± 0.70 (Figure 16)(Table 6 and Graph 1). The difference in the mean vascular luminal diameter and the luminal circumference in different stages of the disease are found to be statistically significant (p value <0.05).
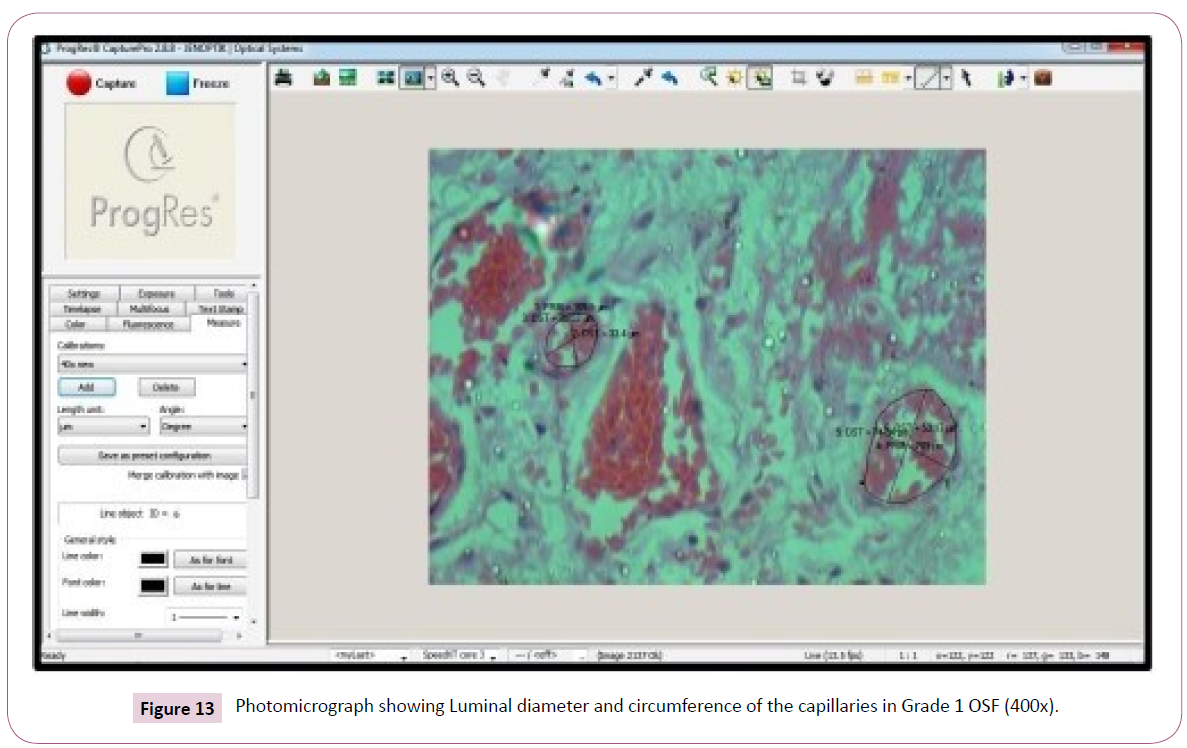
Figure 13: Photomicrograph showing Luminal diameter and circumference of the capillaries in Grade 1 OSF (400x).
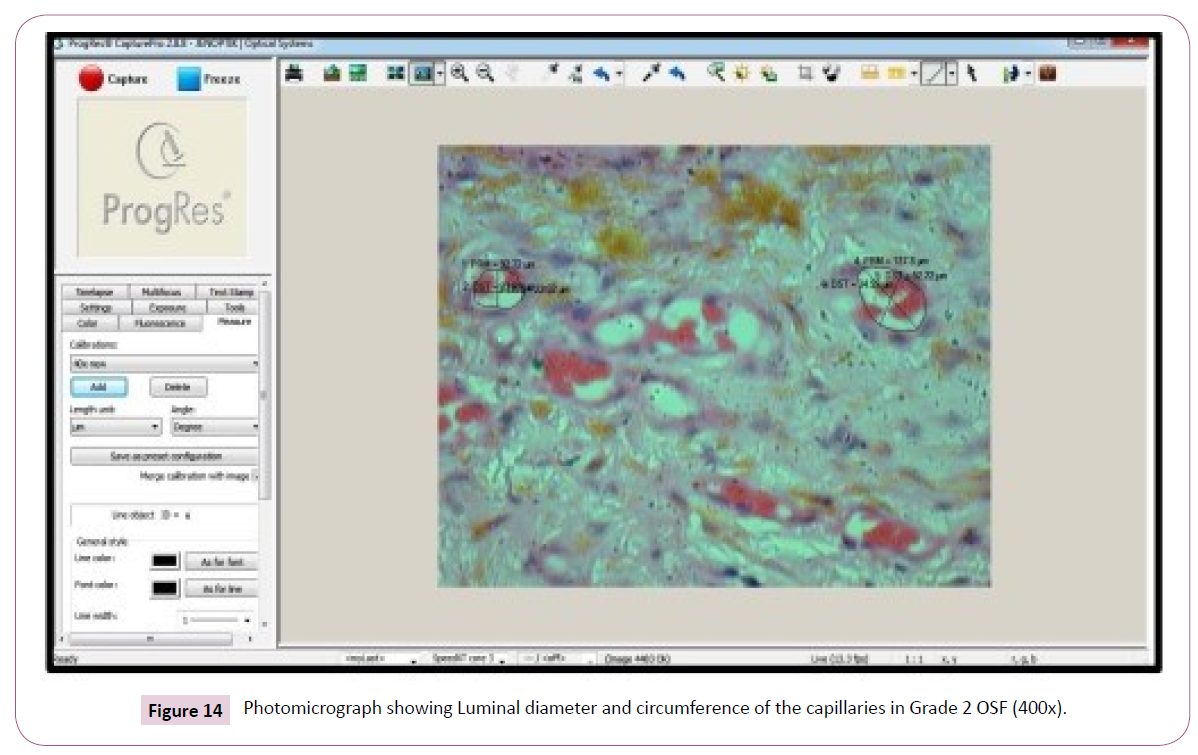
Figure 14: Photomicrograph showing Luminal diameter and circumference of the capillaries in Grade 2 OSF (400x).
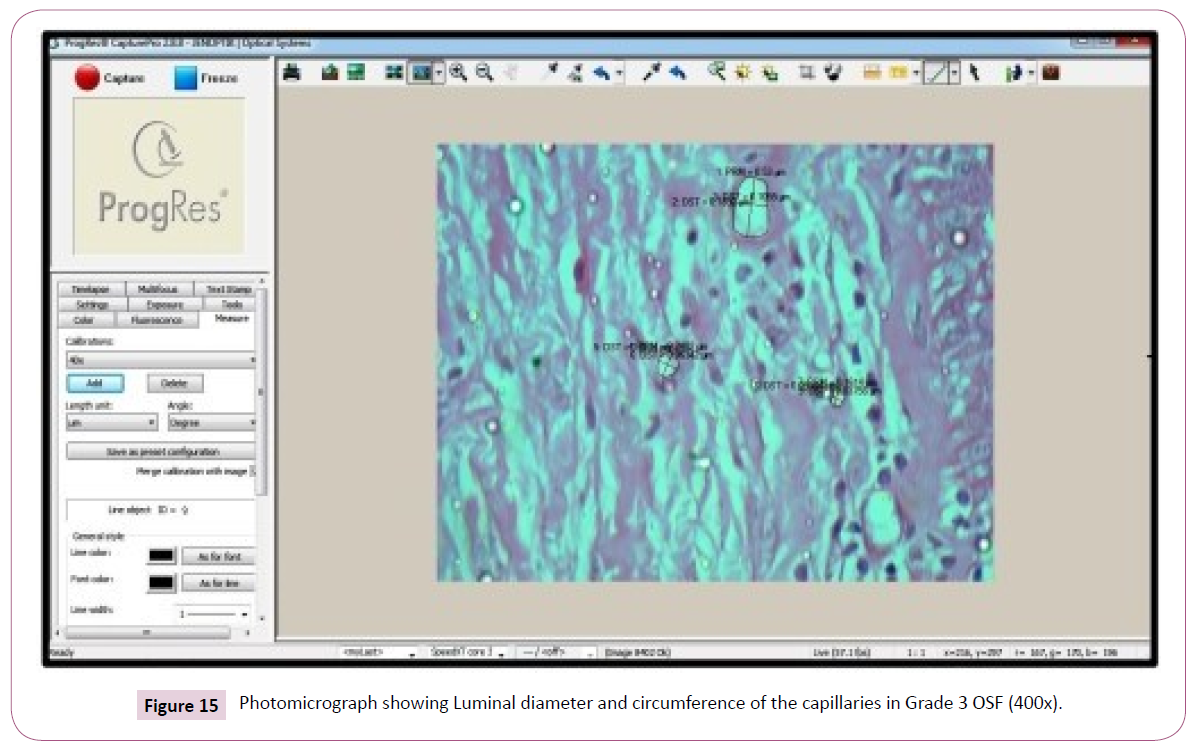
Figure 15: Photomicrograph showing Luminal diameter and circumference of the capillaries in Grade 3 OSF (400x).
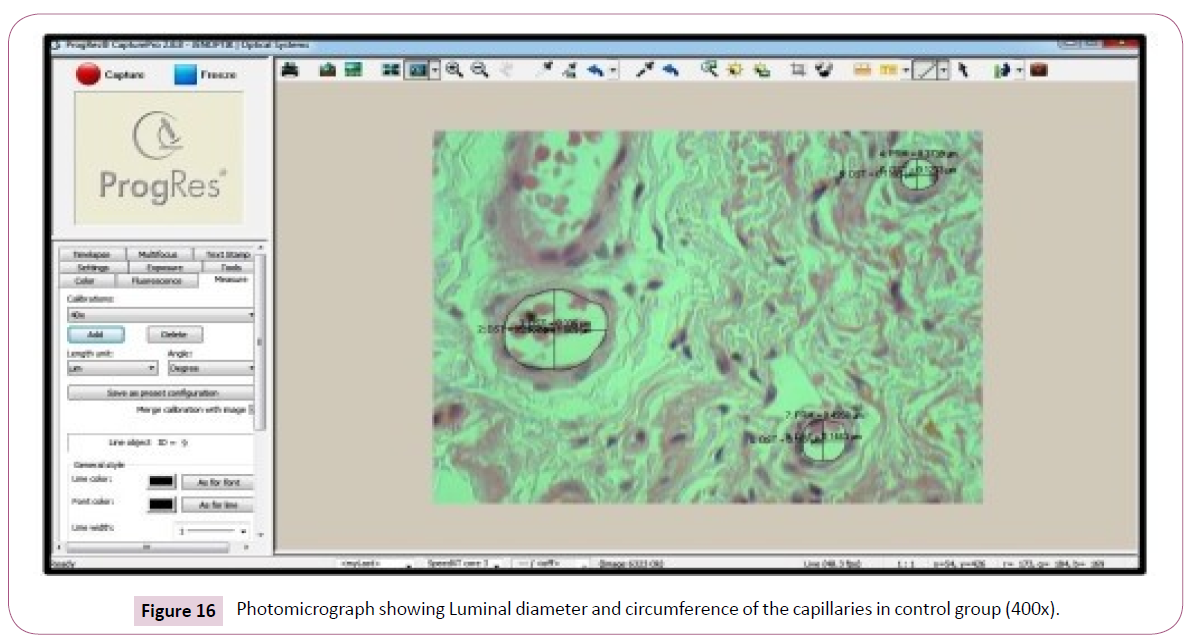
Figure 16: Photomicrograph showing Luminal diameter and circumference of the capillaries in control group (400x).
| Stage |
Mean |
SD |
F value |
P value |
| Grade l |
7.3 |
1.41 |
13.65 |
<0.001** |
| Grade 2 |
5.32 |
1.15 |
| Grade 3 |
6.1 |
1.14 |
| Control |
7.5 |
1.3 |
| One way ANOVA; P value <0.05 is statistically significant; ** <0.001 is statistically highly significant |
Table 6 Comparison of mast cell count in different grades of OSF.
Mean mast cell density in different groups of OSF: The study of mast cells shows the mean value and the SD in grade I was found to be 7.30 ± 1.417.5 (Figure 17). In grade II shows 5.32 ± 1.15 (Figure 18) and grade III shows 6.10 ± 1.14 (F value 13.65) (Figure 19) comparison with the control 7.50 ± 1.30 (Figure 20) (Table 6 and Graph 2). The results regarding the analysis of mast cell density were statistically highly significant (p value <0.001).
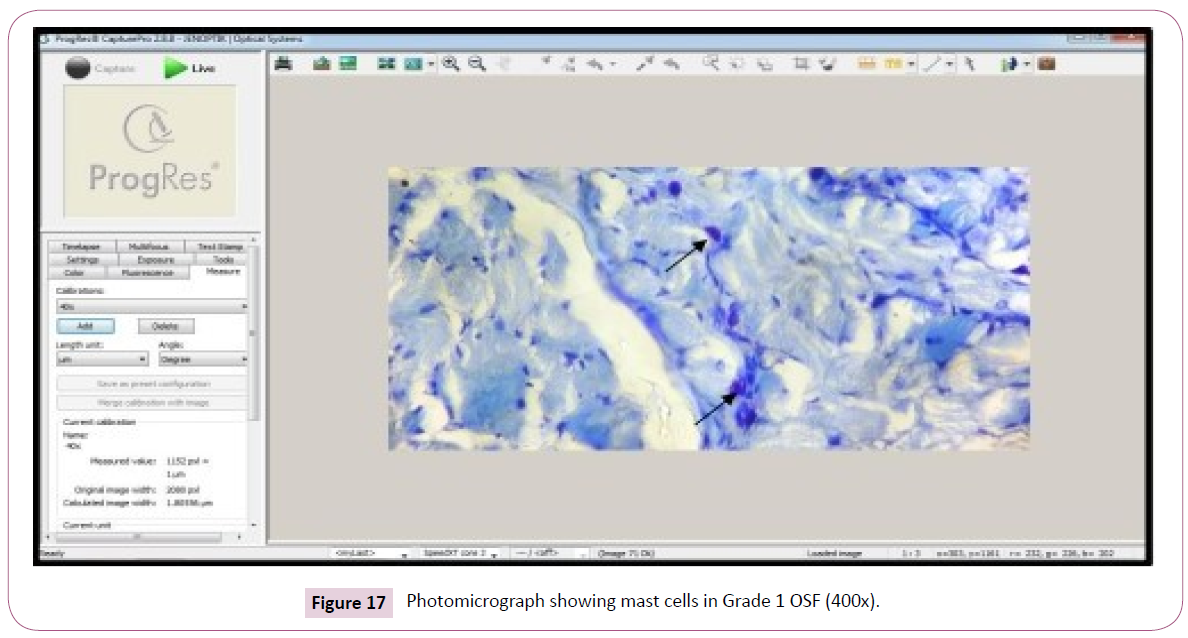
Figure 17: Photomicrograph showing mast cells in Grade 1 OSF (400x).
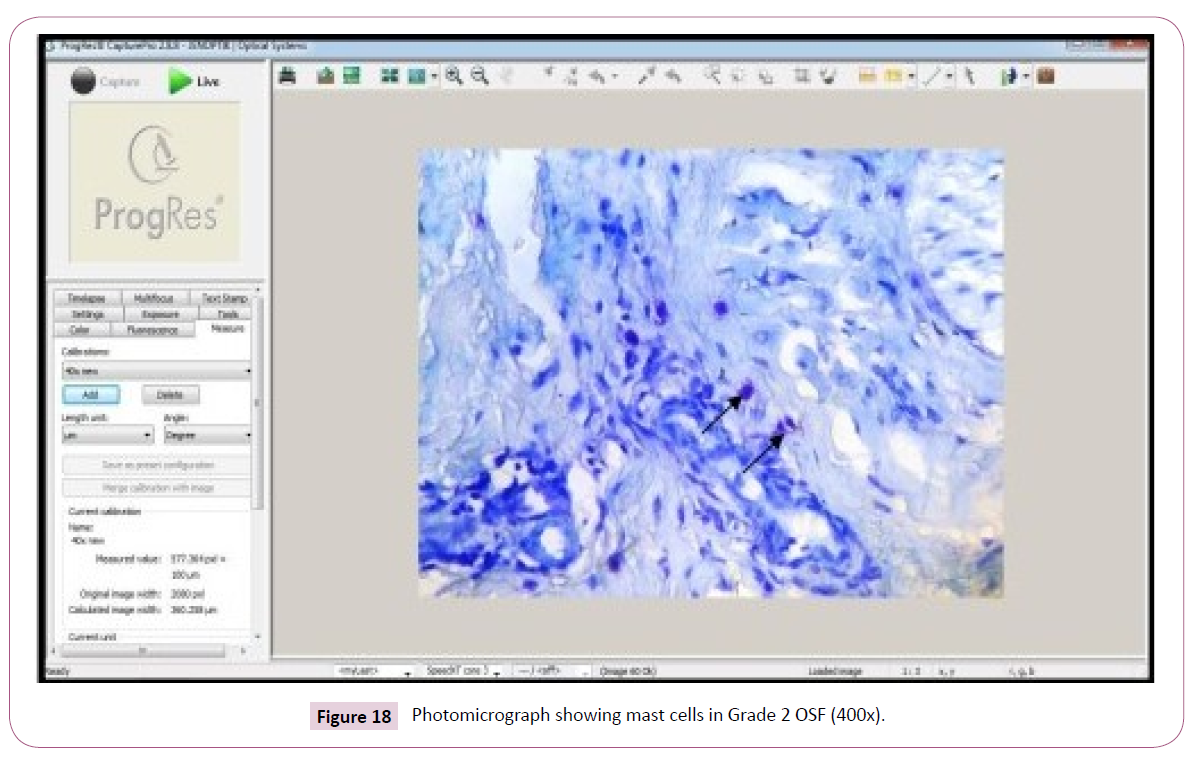
Figure 18: Photomicrograph showing mast cells in Grade 2 OSF (400x).
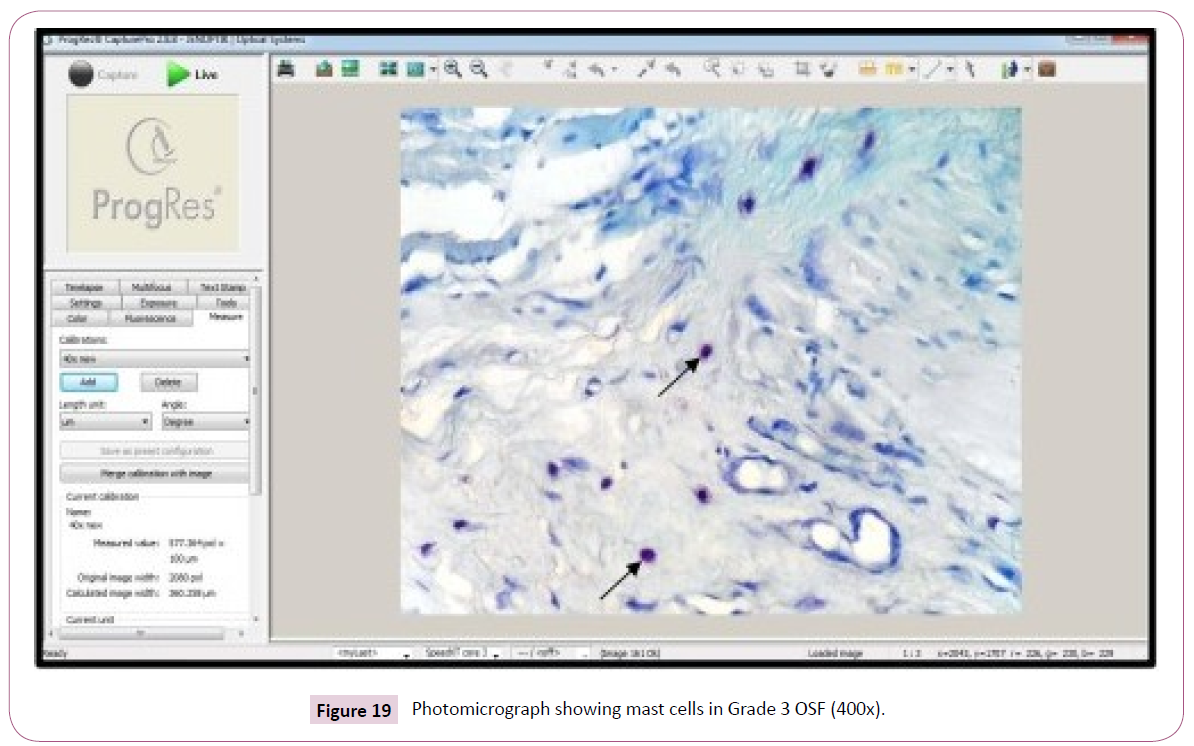
Figure 19: Photomicrograph showing mast cells in Grade 3 OSF (400x).
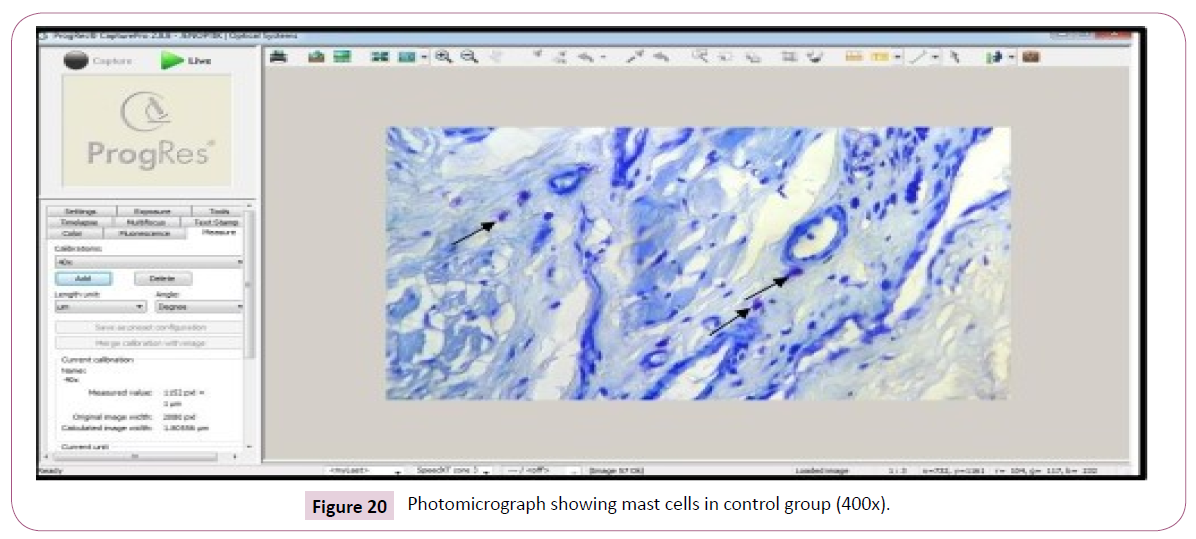
Figure 20: Photomicrograph showing mast cells in control group (400x).
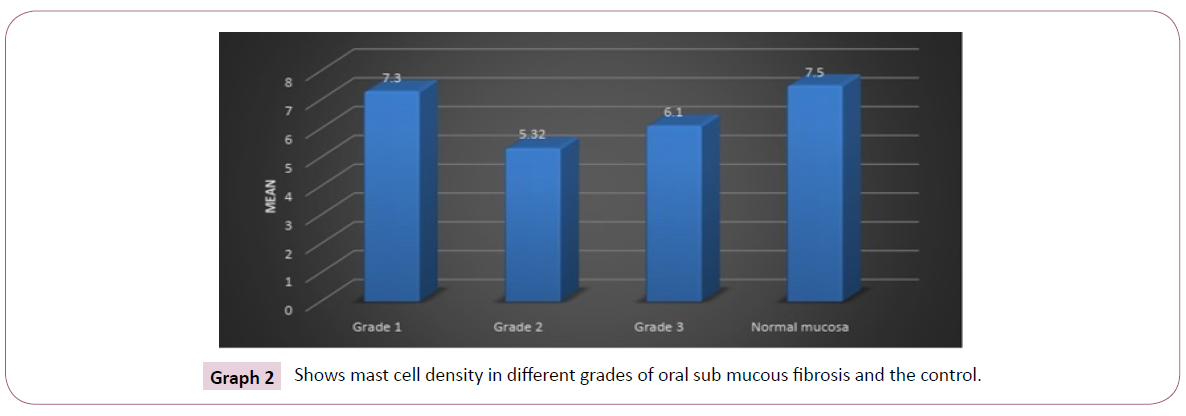
Graph 2: Shows mast cell density in different grades of oral sub mucous fibrosis and the control.
Multiple comparisons within the groups of OSF: Analysing the parameters by multiple comparison by Tukey HSD within the groups of OSF have shown that grade I stage, the mean difference is .000 in comparison with grade II stage and .005 in comparison with grade III stage. The mean difference in grade II stage in comparison with grade I stage is .000 and grade III stage is .01. In grade III stage, the mean difference in comparison with grade I stage is .005, grade II stage of OSF is .018. The mean difference by analysing all the parameter is significant at the 0.05 level (Table 7).
| Multiple Comparisions |
| Dependent Variable VAR00002 Tukey HSD |
| |
|
Mean Difference (I-J) |
Std. Error |
Sig. |
95% Confidence Interval |
| Lower Bound |
Upper Bound |
| Grade I |
Grade 2 |
1.97756' |
0.3527 |
0 |
1.0524 |
2.9028 |
| Grade 3 |
1.20630' |
0.3527 |
0.005 |
0.2811 |
2.1315 |
| Control |
-0.19964 |
0.46658 |
0.974 |
-1.4236 |
1.0243 |
| Grade 2 |
Grade 2 |
-1.97756' |
0.3527 |
0 |
-2.9028 |
-1.0524 |
| Grade 3 |
-0.77126 |
0.3527 |
0.136 |
-1.6965 |
0.1539 |
| Control |
-2.17720' |
0.46658 |
0 |
-3.4011 |
-0.9533 |
| Grade 3 |
Grade l |
-1.20630' |
0.3527 |
0.005 |
-2.1315 |
-0.2811 |
| Grade 2 |
0.77126 |
0.3527 |
0.136 |
-0.1539 |
1.6965 |
| Control |
-1.40594' |
0.46658 |
0.018 |
-2.6299 |
-0.182 |
| Control |
Grade 1 |
0.19964 |
0.46658 |
0.974 |
-1.0243 |
1.4236 |
| Grade 2 |
2.17720' |
0.46658 |
0 |
0.9533 |
3.4011 |
| Grade 3 |
1.40594' |
0.46658 |
.0 18 |
0.182 |
2.6299 |
| •. The mean difference is significant at 0.05 level |
Table 7 Showing multiple comparison within the group by Tukey HSD.
Discussion
Analysis of epithelial thickness
The overlying epithelium exhibits alteration in thickness in varying grades of OSF. Early stages show the epithelial hyperplasia and in advanced stages the epithelium is atrophied, due to diminished perfusion of the epithelium caused by defective vascularization of subjacent connective tissue and physical constraints of fibrosis.
Analysis of capillary density
The capillary density was found to be increased in the early stages and decreased in advanced stages. The rise in capillary density in early stages is probably due to neo-angiogenesis in the mucosa to compensate for the hypoxia created by fibrosis. As the disease advances, the stroma becomes hyalinized, and the mediators of angiogenesis diminishes, which could explain the decrease in mean capillary density in latter stage.
Analysis of luminal diameter and circumferences of the capillaries
The luminal diameter and circumference of the capillaries were increased in early stages and decreased in advanced stages. The increase due to compensatory or reactive to insults in the form of alkaloid (from areca nut). As the severity increases stroma become decompensated resulting constriction and obliteration of the blood vessels.
Analysis of mast cell density
The mast cell density was higher in the early stage where the tissue reaction to the irritant is strong. As the severity of the disease progress, the tissue becomes less reactive, hyaline and shows degeneration where the mast cells become reduced.
Related/Relevant studies
Analysis of epithelial thickness: Studies by Debnath et al. [2] have also found that the epithelium in early stages may have varying thickness and atrophied in latter stage. It is caused by decreased vascularization in the underlying connective tissue due to fibrosis as the severity of the disease progress.
Analysis of capillary density: The findings were in accordance with the studies of Fang CY et al. [7], Sirsat SM [8], Pindborg JJ [9] also observed an increase in vascular density in early stages and decrease in later stages of OSF. They stated microvessel hyperplasia occurring in early stages and decrease in vascular density in advanced stages could be attributed to the increasing fibrosis.
Analysis of luminal diameter and circumferences of the capillaries: Similar to the studies of Fang CY et al. [7] and Singh M et al. [10] who also observed that Mean Vascular Luminal Diameter (MVLD) and the circumference was increased in early stages of OSMF while deceased in later stages. They stated that the micro vessel hyperplasia occurring in early stages leads to increase in MVLD. As the severity of the disease progress, increased production of collagen fibres constraints the vessel wall causing obliteration and narrowing of the capillaries.
Analysis of mast cell density: The findings are in accordance with the previous reports of Chavan S and Deshmukh RS [6] who have stated that the mast cell response in oral sub mucous fibrosis was higher in the early stages and gets reduced in advanced stage, where the tissues become less reactive, gets hyalinized and shows degeneration.
Contradicted studies
Analysis of epithelial thickness: Garg N et al. [11] did not show consistent decrease in the epithelial thickness with increasing grades of the disease, as it is pointed out that further objective elucidation with larger number of patients, possibly in a multiinstitutional setting, to help better define the clinical implications of these alterations.
Analysis of capillary density: Studies of Rajendran R et al. [12] have shown that the mean vascular density was found to be more or less same in their study groups. It is due to the usual tissue reaction to hypoxia does not seem to operate in the disease which is preconditioned by significant stromal changes as part of the disease process.
Analysis of luminal diameter and circumferences of the capillaries: Rajendran R et al. [12] observed an increase in and Mean Vascular Luminal Diameter (MVLD) with progression of OSMF. The increase in mean vascular dilation noted was part of adaptive response to compensate tissue ischemia.
Analysis of mast cell density: Pujari R and Vidya N [13] studies have shown that the density of mast cell increased with disease progression suggesting chronic inflammation leads to mast cell activation and degranulation in advanced stages.
Conclusion
The deviation in the epithelial and connective tissue changes in OSF compared to normal epithelium seems to play a promising criterion for morphometric analysis. It offers aid in improving the knowledge to differentiate this condition from initial to an advanced stage which may help in management strategies by preventing its progression to malignancy. Early intervention is the key factor in managing potentially malignant lesions and conditions. Histopathological considerations help in recognizing early changes and thereby promoting early interventional therapy.
Declarations
Financial support
Nil
Consent to participate
Not applicable.
Competing interests
There is no competing of interest.
39771
References
- Pindborg JJ, Sirsat SM (1966) Oral submucous fibrosis. Oral Surg Oral Med Oral Pathol 22: 764-79.
- Debnath S, Mitra B, Paul B, Saha TN, Maity A (2013) Morphometric analysis of oral submucous fibrosis and its correlation with histological staging and clinical severity of trismus Egy J Ear, Nose, Throat Allied Sci 14: 85–90.
- Murgod VV, Kale AD, Angadi PV, Hallikerimath S (2014) Morphometric analysis of the mucosal vasculature in oral submucous fibrosis and its comparison with oral squamous cell carcinoma. J Oral Sci 56: 173-178.
- Suvarna SK, Layton C, Bancroft JD (2013) Bancroft's Theory and Practice of Histological Techniques 7e Elsevier Health Sciences.
- Carson FL, Hladik C, Cappellano CH (2015) Histotechnology, A Self-Instructional Text.
- Chavan S, Deshmukh RS (2013) Quantitative analysis of mast cells in oral submucous fibrosis. Al Ameen J Med Sci 6: 144-149.
- Fang CY, Han WN, Fong DY (2000) A morphometric study on the microvessel in oral submucous fibrosis. Hunan Yi Ke Da Xue Xue Bao 25: 55-57.
- Sirsat SM, Pindborg JJ (1967) The vascular response in early and advanced oral submucous fibrosis. Acta Pathol Microbiol Scand 70: 179-184.
- Pindborg JJ, Bhonsle RB, Murti PR, Gupta PC, Daftary DK, et al. (1980) Incidence and early forms of oral submucous fibrosis. Oral Surg Oral Med Oral Pathol 50: 40.
- Singh M, Chaudhary AK, Pandya S, Debnath S, Singh M, et al. (2010) Morphometric analysis in potentially malignant head and neck lesions: oral submucous fibrosis. Asian Pac J Cancer Prev 11: 257-260.
- Garg N, Mehrotra R (2014) Morphometric analysis of epithelial thickness and blood vessels in different grades of oral submucous fibrosis. Malays J Pathol 36: 189-193.
- Rajendran R, Paul S, Mathews PP, Raghul J, Mohanty M (2005) Characterization and quantification of mucosal vasculature in oral submucus fibrosis. Ind J Dent Res 16: 83-89.
- Pujari R, Vidya N (2013) Mast cell density in oral submucous fibrosis: a possible role in pathogenesis. Int J Health Sci (Qassim) 7: 23-29.