Introduction
Type 2 diabetes is a complex disease, genetic and environmental factors together contribute to the onset of the disease. In the present time type 2 diabetes has posed a serious threat to developing countries like India. The westernized life style, food habit, obesity, rapid economic expansion and urbanization are likely cause of increased prevalence of type 2 diabetes in India in the recent time. The occurrences of type 2 diabetes have a significant association with high blood pressure, waist to hip ratio (WHR) and body mass index (BMI) [1-2] Otherwise, the higher blood pressures, obesity and WHR are known risk factor for the development of type 2 diabetes. However the variations of BMI, WHR and blood pressure and its association with type 2 diabetes are different in different population and ethnic groups [3]. Epidemiological studies have suggested that genetic factors and obesity as measured by BMI and WHR are major risk factors for the development of type 2 diabetes [4]. The familial aggregation of type 2 diabetes with respect to elevated blood pressure, higher BMI and WHR is well established in Indian and western population [5-6]. However very scanty population and generational based data regarding familial correlation of type 2 diabetes are available in literature especially from Indian populations. The significant aggregation of multiple risk factors including obesity and elevated blood pressure, hyperlipidemia have been found among type 2 diabetic individuals as com- pared to non-diabetic individuals [2,4,7]. Several studies have shown that Indians have an increased risk of developing Type 2 diabetes and related metabolic abnormalities as compared to other ethnic groups [6,8-10]. It is therefore, important to estimate the association of type 2 diabetes mellitus along with potential risk factors in populations. Hence an analysis of familial correlation of blood pressure with associated risk factors such as BMI and WHR among type 2 diabetes subjects would provide to estimate the role of genes and environmental variables between biological related family members. Therefore the objective of the present study is to describe the basic design for family correlation between blood pressure phenotypes, BMI and WHR among non-diabetic and type 2 diabetic individuals.
Materials and methods
Sample
The selection of the Punjabi families was carried out through surveys and subsequent visits of randomly selected household inhabitants from three cities in Punjab i.e. Phagwara, Ludhiana and Amritsar. A total of 449 (246 non-diabetic and 203 type 2 diabetic) individuals from 130 families were ascertained for the present study. Punjabi population may be defined as similar genotypic groupings and aggregate of similar cultural practices, life style pattern, social influence and similar ethnic characteris tics with Punjabi language speaking and atleast reside in Punjab for the last 20 years.
Selection Criteria for Samples and Study Design
(i)Family history of type 2 diabetes mellitus. (ii) Negative history of other important disease. (iii) Normal physical examination. (iv) Blood pressure values not exceeding 170/100 mmHg for all generations. Therefore, families with at least one individual with type 2 diabetes mellitus were selected. For the present study, data have been collected among two generations like parental and offspring and the familial correlation was investigated by statistical methods in these two generations. For data collection in each subsequent visit, personal interviews were held and a well designed questionnaire was administered. General information about name, relationship with the head of the family, present age, age of onset of disease, sex, religion, caste, occupation education, economic status and address was obtained.
Measurements
Both the anthropometric and physiometric measurements were included in the present study. The anthropometric measurements included height (cm), weight (kg), waist circumference (cm), hip circumference (cm), biceps skinfold (mm), triceps skinfold (mm), mid upper arm circumference (MUAC) (cm). The physiometric variables included systolic blood pressure (SBP), diastolic blood pressure (DBP), mean arterial blood pressure (MBP) and pulse rate. All the anthropometric measurements were taken on each individual using standard anthropometric technique [11-12]. Height was measured the vertical distance from the point vertex to the base of the heels. The reading was then, recorded to the nearest 0.1cm. Weight was measured in kilograms by making subject stand on a weighing machine with minimal clothing and without shoes. Weight was recorded with an allowance deducted for clothing. Waist circumference was measured using a steel tape. The measurement was taken mid-way between the inferior margin of the last rib and the crest of the ilium in a horizontal plane. Hip circumference was taken with steel tape fitted around the pelvis at the point of maximal protrusion of buttocks while the subject was standing with his/her feet close to each other. Mid upper arm circumference (MUAC) was taken with steel tape. It measures the maximum circumference of upper arm taken horizontally i.e. where the biceps muscles are most developed. Four skinfolds (biceps skinfold, triceps skinfold, subscapular skinfold and suprailiac skinfold) were taken on each subjects with the help of Harpenden’s calipers. Body mass index (BMI) was calculated by dividing weight of the subject in kilograms by square of his/ her height in meters. Waist to hip ratio (WHR) was calculated by the formula: waist circumference (cm)/hip circumference (cm).
The physiometric variables included measurement of systolic blood pressure (SBP), diastolic blood pressure (DBP) and pulse rate. Two consecutive readings were recorded for each of SBP and DBP and the averages were used. The measurements were taken with the help of mercury sphygmomanometer in a sitting position with the right forearm placed horizontal on the table. The recordings were taken as recommended by the American Heart Association [13]. An appropriate sized cuff was fitted on the arm of the subject and was inflated to about 20mm Hg above the point at which the radial pulse disappeared. The pressure within the cuff was then, released at a rate of approximately 2mm Hg/second, while osculating with a stethoscope placed over the brachial artery. The onset of sound (Korotkoff- phase I) was taken as indicative of systolic blood pressure and the disappearance of sound (Korotkoff- phase V) was taken as indicative of diastolic blood pressure. Korotkoff phase was taken as recommended by the American Heart Association and others [14]. All efforts were made to minimize the factors which might affect blood pressure like anxiety, fear, stress, laughing and recent activity [15]. Mean Arterial blood pressure (MBP) was calculated for each of the two readings taken for SBP and DBP by using the formula: MBP= DBP + (SBP- DBP)/3 [16]. Pulse rate was counted over one minute and the radial artery at the wrist is most commonly used to feel the pulse.
Statistical analysis
Differences of means in different variables among various groups were compared using independent samples t-test. Family correlations and cross correlations matrix for dependent variables SBP and DBP were used to investigate the relations with independent variables BMI and WHR among different generations. Two-tailed probability levels for statistical significance are reported. All data were analysed by SPSS (SPSS Inc., Chicago, IL, USA; Version 17.0).
Results
All parameters except age of onset (only for diabetic individuals) have been measured from 62 non-diabetic male offspring and from 40 type 2 diabetic male offspring. The same parameters have been measured from 50 non-diabetic female offspring and 38 type 2 diabetic female offspring. The comparatively small numbers of type 2 diabetic individuals among male offspring and female offspring have been found due to higher age of onset of the disease. The same parameters have been measured from 69 non-diabetic male parents and 67 type 2 diabetic male parent. For the same measurements the number of female parent is 65 (non-diabetic female parent) and 58 (type 2 diabetic female parent). Therefore a total of 449 individuals have been measured for all parameters except age of on- set. Comparison of descriptive statistics for different measured variables such as age, age of onset, height, weight, BMI, waist and hip circumferences, waist to hip ratio, biceps and triceps skinfolds, pulse rate and pulse pressure are presented in table 1-4 among offspring and parental generations between type 2 diabetic and non-diabetic individuals. Among male offspring, all the variables except height have higher mean values among type 2 diabetic male individuals. The mean age of onset of type 2 diabetes has been found around 41±5.98 years among male offspring generation. The distribution of means and SD of four important variables for the present study such as SBP, DBP, BMI and WHR are as follows. The mean SBP is 125.00 ± 6.00 mmHg among type 2 diabetic male offspring as compared to nondiabetic individuals (123.38±7.11 mmHg). The mean for DBP is 85.00±5.77 mmHg (type 2 diabetic) as compared to 85.08±7.43 mmHg (non-diabetic), for BMI it is 28.88±3.82 kg/m2 (type 2 diabetic) as compared to 23.37±3.71 kg/m2 (non-diabetic). The same for WHR is 1.02±0.06 (type 2 diabetic) as compared to 0.89±0.04 (non-diabetic).However, the mean differences for all the parameter expect SBP and DBP are statistically significant (p<0.001) (Table 1). Among female offspring, all the variables except SBP have higher mean values among type 2 diabetic female offspring and all these differences were statistically significant (p<0.001). The mean age of onset of type 2 diabetes have been found around 31.67±5.58 years. The distribution of four concerned variables such as SBP, DBP, BMI and WHR are described as follows. The mean SBP is 120.00±7.5 mmHg (type 2 diabetic) as compared to 120.26+6.68 mm Hg (non-diabetic). The same for DBP is 90.00±6.2 mmHg (type 2 diabetic) as compared to 84.62±6.56 mmHg (non-diabetic). The mean BMI is 28.62±1.85 kg/m2 (type 2 diabetic) as compared to 24.04±2.37 kg/m2 (non-diabetic). Similarly for WHR mean is 0.90±0.05 (type 2 diabetic) as compared to 0.79±0.06 (non-diabetic) (Table 2). Among male parent, all the variables except age, weight, BMI, WHR, biceps and triceps skinfolds have higher mean values among type 2 diabetic subjects. The mean age of onset for type 2 diabetic has been found around 49.05±5.93 years. The distribution of four concerned variables such as SBP, DBP, BMI and WHR are as follows. The mean SBP is 131.31±6.23 mmHg (type 2 diabetic) as compared to 127.46±6.15 mmHg (non-diabetic). The same for DBP is 93.15±6.51 mmHg (type 2 diabetic) as compared to 89.63±7.64 mmHg (non-diabetic). For BMI mean is 26.19±2.53 kg/m2 (type 2 diabetic) and 28.39±1.86 kg/m2 (non-diabetic). The mean for WHR is 0.95±0.05 (type 2 diabetic) as compared to 0.96±0.05 (non-diabetic) (Table 3). However, mean differences are all significant (p<0.001). In case of female parent, all the variables except biceps and triceps skinfolds have higher mean values among type 2 diabetic female parent. The mean age of onset for type 2 diabetes has been found around 49.29±5.73 years. The distributions of four concerned variables such as SBP, DBP, BMI and WHR are as follows. The mean SBP is 131.56±7.25 mmHg (type 2 diabetic) as compared to 127.40±6.14 mm Hg (non-diabetic). The same for DBP is 92.69±7.54 mm Hg (type 2 diabetic) as compared to 88.90±7.62 mmHg (non-diabetic). The mean BMI is 28.54±2.78 kg/m2 (type diabetic) as compared to 27.87±2.66 kg/m2(non-diabetic). The mean value of WHR is 0.981±0.03 (type 2 diabetic) as compared to 0.88±0.05 (non-diabetic). Almost all the mean differences are statistically significant (p<0.001) (Table 4).
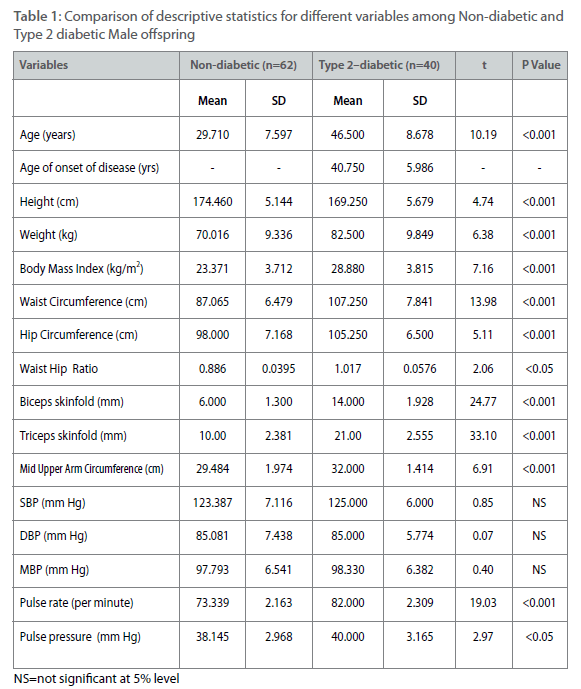
Table 1: Comparison of descriptive statistics for different variables among Non-diabetic and Type 2 diabetic Male offspring
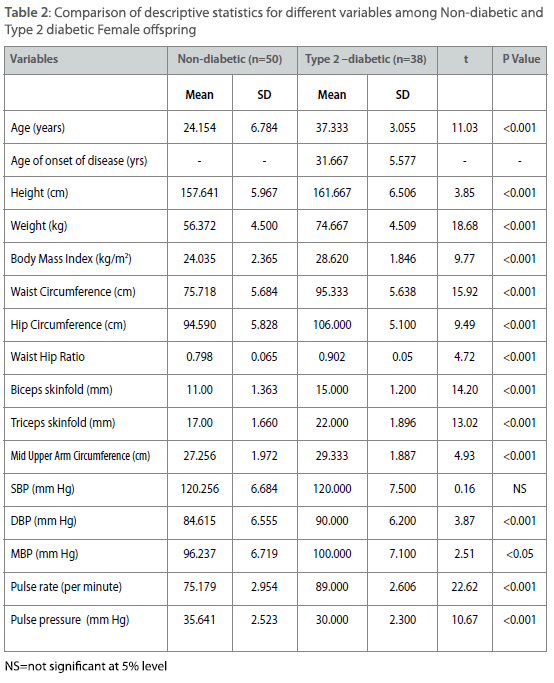
Table 2: Comparison of descriptive statistics for different variables among Non-diabetic and Type 2 diabetic Female offspring
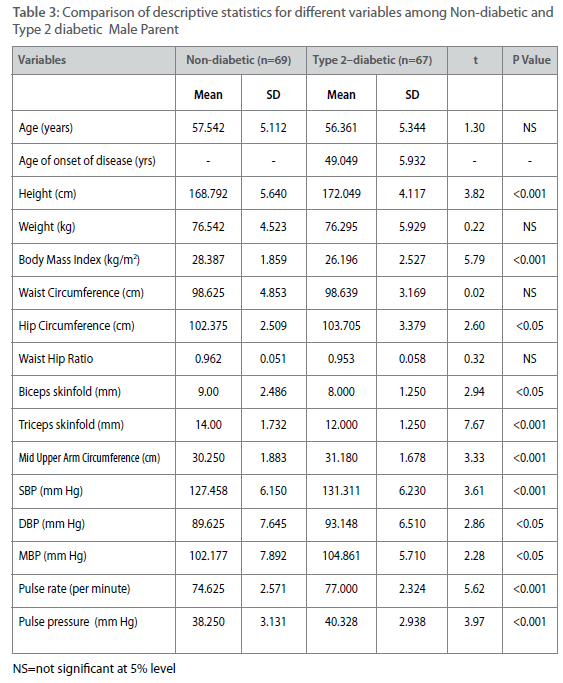
Table 3: Comparison of descriptive statistics for different variables among Non-diabetic and Type 2 diabetic Male Parent

Table 4: Comparison of descriptive statistics for different variables among Non-diabetic and Type 2 diabetic Female Parent
Table 5-12 represent family correlations and cross correlations matrix for dependent variables SBP and DBP with independent variables BMI and WHR among type 2 diabetic and non-diabetic subjects. Maximum significant (p<0.05) family correlations for SBP with BMI such as mother-male offspring, mother-female offspring, father-female offspring have been found among nondiabetic individuals. Whereas among diabetic subjects only spouse, mother-male offspring have found significant (p<0.05) (Table 5-6). Table 7 and 8 depict the result of the same analysis for SBP with WHR. All familial cross correlation have found insignificant among both diabetic and non-diabetic individuals except brothers among diabetic individuals. Table 9 and 10 present the result of matrix analysis for family correlation of DBP (independent variable) with BMI (dependent variable). Only three family correlations such as father-male offspring, brother- sister and father-female offspring have found significant (p<0.05) among non-diabetic individuals. Whereas, none of the correlations have found significant among type 2 diabetic individuals. Table 11 and 12 depicts the result of matrix analysis for family correlation of DBP (independent variable) with WHR (dependent variable). Surprisingly none of the correlations have found significant (P<0.05) among non-diabetic and diabetic individuals except father-male offspring among type 2 diabetic individuals.
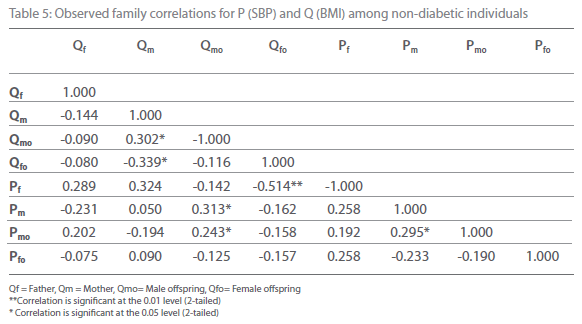
Table 5: Observed family correlations for P (SBP) and Q (BMI) among non-diabetic individuals
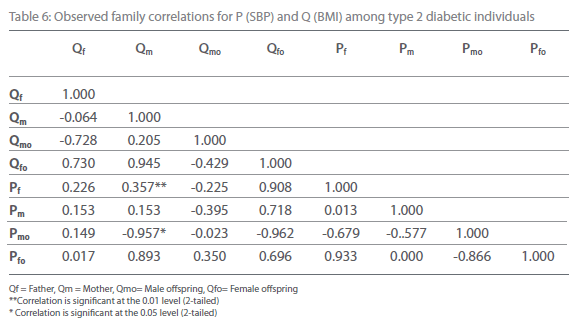
Table 6: Observed family correlations for P (SBP) and Q (BMI) among type 2 diabetic individuals.
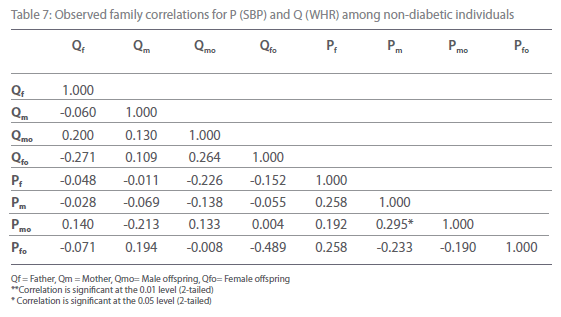
Table 7: Observed family correlations for P (SBP) and Q (WHR) among non-diabetic individuals.
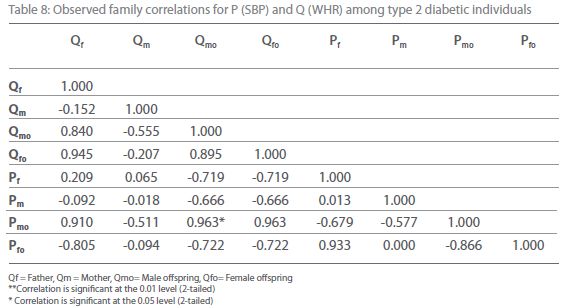
Table 8: Observed family correlations for P (SBP) and Q (WHR) among type 2 diabetic individuals.

Table 9: Observed family correlations for P (DBP) and Q (BMI) among non-diabetic individuals.
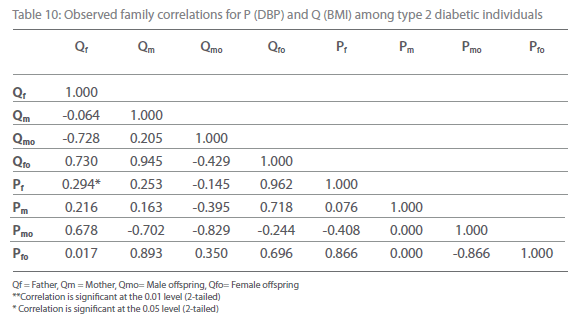
Table 10: Observed family correlations for P (DBP) and Q (BMI) among type 2 diabetic individuals.
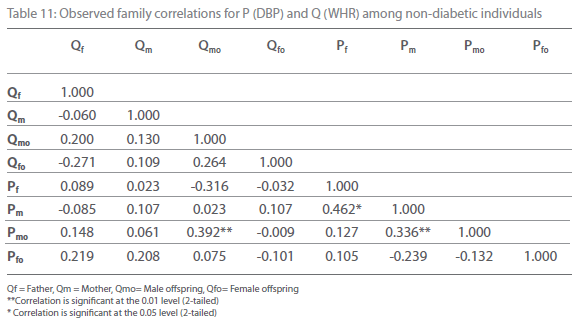
Table 11: Observed family correlations for P (DBP) and Q (WHR) among non-diabetic individuals.
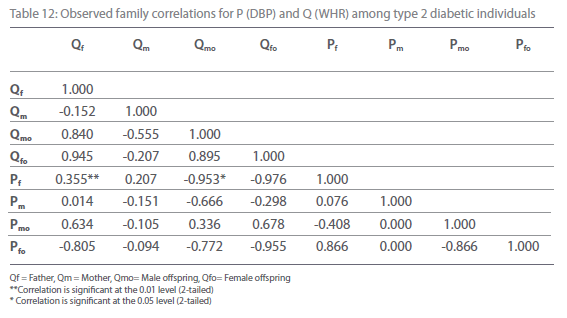
Table 12: Observed family correlations for P (DBP) and Q (WHR) among type 2 diabetic individuals.
Discussion
The major objective of the present study is to describe the basic design for family correlation between blood pressure phenotypes, BMI and WHR among non-diabetic and type 2 diabetic individuals. The total above said objectives were examined in Punjabi population in Punjab. The observations were done from Punjabi families in different cities and data were collected from two generations such as offspring and parental with four ca- tegories like male offspring, female offspring, male parent and female parent. With respect to present objectives many interesting results have been observed and discussed one by one. The high prevalence of type 2 diabetes have been observed in the present population among male parental generation (26%) followed by female parent (22%). It is observed from the present investigation that type 2 diabetes predominately occur among male individuals with mean age of 49.05 ± 5.9 years as compared to female counterpart with mean age of 49.29 ± 5.72 years. The present result is also supported by many other previous studies [4,17-18]. In the present evaluation it has been observed that onset of type 2 diabetes among female offspring is much lower (31.67 ± 5.58 years) as compared to male offspring (40.75 ± 5.98 years). This difference of age for onset of type 2 diabetics is statistically significant (t= 6.83, p<0.001) between the sexes. This is may be smaller sample size for these two categories. However this underline mechanism responsible for the development of type 2 diabetes in lower age among females remains to be investigated in larger sample size. The present cross sectional and observational study also pointed that on an average the age of onset of type 2 diabetes among offspring generation is much lower than parent generation. This is because the age of diagnosis of type 2 diabetes in probands was lower than their diabetic parents, furthermore increasing parental history of diabetes was significantly associated with the earlier diagnosis of type 2 diabetes in offspring and proband. Therefore this result emphasis the familial aggregation of type 2 diabetes in Punjabi population. In descriptive statistics, it has been noticed that diabetic individuals have higher average of SBP, DBP, BMI and WHR as compared to non-diabetic individuals, which suggests a certain pattern of obesity with abdominal fat distribution among diabetic individuals. Similar observations have been found in other studies [2,4,18-21]. From the family correlation matrix analysis, it seems that SBP and DBP have significant and pronounced relationship with BMI and WHR among non-diabetic individuals as compared to diabetic individuals.
Therefore, it may be assumed that the significant correlation of parental environment in the case of SBP and DBP indicates that effect of cohabitation and familial aggregation have a important role for significant association of blood pressures with BMI and WHR among non-diabetic individuals but not in diabetic individuals. The correlation matrix analysis suggested a stronger environmental and/or genetic component related with the morphology or variation SBP and DBP with respect to BMI and WHR among only non-diabetic individuals. These stronger components have not noticed in diabetic individuals due to the fact that diabetic individuals are under medical treatment which helps to reduce the blood pressure. The association of the blood pressure with BMI and WHR among type 2 diabetic individuals can also be reduced by making changes in diet, life style and increasing physical activity. However there are inadequate evidences available to justify the present observation. Therefore it may be concluded from the current study that sharing household environment has a significant effect in familial aggregation for, SBP, DBP, BMI and WHR among non-diabetic individuals and it is negligible for diabetic individuals. This hypothesis will require detailed study of household structure and day-to-day functioning verification.
2594
References
- Epstein M, Sowers JR (1992) Diabetes mellitus and hypertension. Hypertension 19: 403-418.
- Freemantle N, Holmes J, Hockey A, Kumar S (2008) How strong is the association between abdominal obesity and the incidence of type 2 diabetes? Int J Clin Practice 62:1742-1241.
- Ramachandran A, Snehalatha C, Viswanathan V, Jali MV, Mohan V (1997) Risk of non insulin dependent diabetes mellitus conferred by obesity and central adiposity in different ethnic groups: a comparative analysis between Asian Indians Mexican Americans and Whites. Diabetes Res Clin Pract 36: 121-125.
- Hussain A, Vaaler S, Sayeed MA, Mahtab H, Keramat SM, Khan A (2006) Type 2 diabetes and impaired fasting blood glucose in rural Bangladesh: a population based study. Euro J Public Health 17: 291-296
- Caroline S, Michael J, James B, Ramachandram S, Yamini S, Ralph B (2006) Trends in the incidence of type 2 diabetes mellitus from the 1970s to 1990s. Circulation 113: 2914-2918.
- Mohan V, Sandeep S, Deepa R, Shah B, Varghese C (2007) Epidemiology of type 2 diabetes: Indian Scenario. Ind J Med Res 125: 217-230.
- Ramachandran A, Snehalatha C, Latha E (2000) A healthy region/ community partnership for type 2 diabetes risk factor screening in Indo-Asian Communities. Diabetes Obes Metab 2: 149-154.
- Mc Keigue PM, Shah B, Marmot MG (1991) Relation of central obesity and insulin resistance with high diabetes prevalence and cardiovascular risk in South Asian. Lancet 337: 382-6.
- Abate N, Chandalia M (2001) Ethnicity and type 2 diabetes: Focus on Asian Indians. Diabetes Complications 15: 320-327.
- Mohan V, Sharp PS, Cloke HR, Burrin JM, Schumer B, Kohner EM (1986) Serum immunoreactive insulin responses to a glucose load in Asian Indian and European Type 2 (non insulin dependent) diabetic patients and control subjects. Diabetologia 29: 235-237.
- Singh IP, Bhasin MK (1968) Anthropometry. Delhi: Kamla-Raj Enterprises.
- Weiner JS, Lourie JA (1981) Practical Human Biology. London: Academic Press.
- American Heart Association (1981) Report of Sub committee of postgraduate education committee recommendations for human blood pressure determination of sphygmomanometer. Circulation 64: 510A-599B.
- Londe S, Goldring D (1976). High Blood pressure in children: Problems and Guidelines for evaluation and treatment. Am J Cardial 37: 650-657.
- Badaruddoza, Afzal M (1999). Age specific difference in blood pressure among inbred and non inbred north Indian children. J Biosci 24: 177-184.
- Perusse L, Rice T, Bouchard C, Vogler GP, Rao DC (1989) Cardiovascular risk factors in the French Canadian population. Resolution of genetic and familial environmental effects on blood pressure by using extensive information on environmental correlated. Am J Hum Genet 45: 240-251.
- Must A, Spadano J, EH, Field AE, Colditz G, Dietz WH (1999). The disease burden associated with overweight and obesity. JAMA 282: 1325-1529.
- Nemesure B, Hennis A, Crisima M., BESS study group (2008) The reatlionship of BMI and WHR on the 9 year incidence of type 2 diabetes and hypertension in a predominantely African-origin population. J Annepriden 18: 357-663.
- Gu D, Gupta A, Muntner P, Shengshou H, Duan X, Chen J, Reynolds RF, Whelton PK, He J (2005) Prevelance of cardiovascular disease risk factor clustering among the adult population of China: Results from the International Collaborative Study of Cardiovascular Disease in Asia (InterAsia). Circulation 112: 658-665
- Amini M, Janghorbani M (2007) Diabetes and impaired glucose regulation in first-degree relatives of patient with type 2 diabetes in Isfahan, Iran: Prevalence and Risk factors. Rev Diabet Stud 4: 169-179.
- Yamaguchi S, Yamada Y, Matsuo H, Segawa T, Watanabe S, Kato K, Yokoi K, Ichihara S, Metoki N, Yoshida H, Satho K, Nozawa Y (2007) Gender differences in the association of gene polymorphisms with type 2 diabetes mellitus. Int J Mol Med 19: 631-637.