Keywords
Diabetes mellitus, Hydroalcoholic extract, Gloriosa superba, Streptozotocin, Flavonoids.
Introduction
Diabetes mellitus (DM) is a metabolic disorder which consists of a group of syndromes characterized by chronic hyperglycaemia, accompanied by altered metabolism of lipids, carbohydrates, and proteins and sometimes ketonemia. Clinically, Insulin dependent diabetes mellitus (IDDM) or Type 1 diabetes is manifested by low insulin level due to destruction of beta cells by body’s own immune system. Antibodies against beta cells are detectable in blood (Type 1A) but sometime such antibodies are absent (Type 1B) [1]. Noninsulin dependent diabetes mellitus (NIDDM) affecting more than 90% of all cases are manifested by cellular resistance to insulin [2].
International Diabetes Federation estimated around 3.8 million (6%) deaths of total world mortality in age group between 20 and 79 years in 2007 which were solely due to diabetes [3]. Treatment approaches for diabetes include oral hypoglycaemias and insulin. However, as per Indian Council of Medical Research (ICMR), despite the availability of various allopathic approaches, diabetes still remains refractory [4]. Ayurveda has concealed promising herbal medicines which can prove to be effective against DM [5]. Herbs are less likely to produce deleterious effects on the body when compared to synthetic drugs [6,7]. Synthetic compounds also have a restricted use in pregnancy [8]. Acknowledging this fact, WHO has recommended the evaluation of traditional plant treatment for diabetes [9].
Gloriosa superba Linn. (Liliaceae) commonly referred to as Glory lily in English and Langali in Hindi, a native of tropical Asia and Africa is also found to occur throughout India but is mainly cultivated in south Indian regions [10]. The leaves are sessile, ovate, lanceolate, acuminate, entire, glabrous, and the tips are spirally twisted to form tendrils [11]. Plant is used in folklore medicine for treatment of skin diseases, diabetes and respiratory diseases [12]. The phytochemical studies of G. superba revealed that the whole plant contains colchicine, gloriosine, superbine, colchicosides, β-sitosterol, cornigerine, N-formyl-de-ac-colchicine [13,14]. Traditionally, it is used in the treatment of various clinical conditions like inflammation, edema, rheumatism, skin infections, and arthritis [11,15]. So far, no scientific study has been conducted on this plant for antidiabetic activity. So the present work is carried out to exhibit its hypoglycaemic potential.
Materials and Methods
All the experimental protocols (No. IPS/AH/227) and procedures used were approved by Institutional Animal Ethics Committee (IAEC) [Reg. No 536/02/a/CPCSEA] of Kurukshetra University, Kurukshetra, India and were in accordance with the guidelines of the Committee for the Purpose of Control and Supervision of Experiments on Animals.
Plant Material
Identification of plant material
Gloriosa superba Linn. leaves were collected from village Amin of district Kurukshetra of Haryana state, India in the month of October, 2012. The plant was authenticated by Dr. B. D. Vashishtha, Chairman, Department of Botany, Kurukshetra University, Kurukshetra, where one voucher specimen of plant (KUK/BOT/IPS-02) has been deposited in the herbarium of Botany Department and one specimen had been deposited in Institute of Pharmaceutical Sciences, Kurukshetra University, Kurukshetra for future reference.
Extraction procedure
The plant material was washed under running tap water and dried in shade for 3 weeks. Dried leaves were coarsely powdered, and passed through sieve of mesh size no.22. 400 g of coarse powder was extracted with hydroalcohol (30:70) in Soxhlet apparatus at a temperature not exceeding 60?C. The extractive value of of Gloriosa superba hydroalcoholic leaf extract (GSLE) was obtained to be 10%w/w. The extract was concentrated under reduced pressure in rotary evaporator to yield a crude semi-solid mass. The resultant semi-solid extract was then lyophilized to fine powder in a lyophilizer. It was then stored in airtight container at 4?C.
Animals Used
Healthy adult Swiss albino rats (250-300 g) of either sex of Wistar strain were selected for experimental study. The animals were housed in the Animal House, Institute of Pharmaceutical Sciences, Kurukshetra University. The animals were maintained under laboratory conditions of temperature (21.5 ± 22?C), humidity (60 ± 1%) and 12 hour light/dark cycle. They were allowed free access to food (standard pellets) and water.
Drugs, Chemicals and Instruments
Streptozotocin, glimepride (HiMedia labs), U.V. Spectrophotometer (Systronics UV-Spectrophotometer 2202), Rota evaporator (Heidolph Labrota 4011 digital, Germany), Centrifuge machine (R-8C, Mumbai), auto analyser (ERBA Chem-7), Blood glucose estimation kit (Elegance blood glucose monitoring system, Model no. CT-X12, Convergent Technologies Ltd, Germany), biochemical parameter kit (ERBA Diagnostics, Germany) are used in the present study. Other solvents and chemicals used were of AR grade.
Preliminary Phytochemical Study
The GSLE was investigated for the presence of possible phytoconstituents responsible for the potential anti-antidiabetic activity. The following tests were undertaken as documented by Khandelwal [16].
A. Test For Alkaloids
About 50mg of GSLE was stirred with little quantity of dilute hydrochloric acid and filtered. The filtrate was tested with various alkaloidal reagents as follows.
Dragendroff’s test
To a few ml of filtrate, 2ml of Dragendroff’s reagent (potassium bismuth iodide solution) was added. Appearance of orange brown precipitates was taken as evidence for the presence of alkaloids.
Mayer’s test
To a few ml of filtrate, two drops of Mayer’s reagent (mercury potassium iodide solution) were added. Appearance of cream coloured precipitates was taken as evidence for the presence of alkaloids in the extract.
Wagner’s test
To a few ml of filtrate, two drops of Wagner’s reagent (aqueous iodine solution) were added. Appearance of reddish brown precipitates was taken as evidence for the presence of alkaloids.
B. Test for glycosides
About 50mg of extract was hydrolyzed with hydrochloric acid on a water bath, filtered. To 2ml of filtrate, 3ml of chloroform was added and shaken, chloroform layer was separated. The chloroform layer was treated separately with (a) sodium picrate (Baljet’s test); (b) sodium nitroprusside solution followed by pyridine and 10% sodium hydroxide solution (Legal’s test); and (c) 10% ammonia solution (Borntrager’s test). Appearance of yellow to orange colour, pink colour, and rose red to pink colour in (a), (b), and (c) respectively indicated the presence of glycosides.
C. Test for steroids
Sallowski reaction
Few ml of extract, was separately shaken with chloroform (2ml), followed by addition of concentrated sulphuric acid (2ml) along the sides of the test tube. The presence of steroids was evident if chloroform layer appeared red and acid layer gave green flouroscence.
D. Tests for flavanoids
Shinoda test
An aqueous solution of the extract was treated with ethanol and conc. hydrochloric acid and then few magnesium turnings were added. Pink color indicated the presence of flavonoids.
Lead acetate test
Lead acetate solution was added to small quantity of the extract dissolved in distilled water. The appearance of yellow colored precipitates indicated the presence of flavonoids.
Sodium hydroxide test
An aqueous solution of the extract was treated with sodium hydroxide solution. The presence of yellow colored precipitates indicated flavonoids.
E. Tests for tannins
Ferric chloride test
About 50mg of the extract was dissolved in distilled water and to this few drops of neutral 5% ferric chloride solution was added. Formation of blue color indicates the presence of tannins.
Bromine solution test
To the extract solution few drops of bromine solution was added and concentrated sulphuric acid was added from the sides of the test tube. Violet ring was formed at junction of two liquids indicating the presence of tannins.
F. Tests for carbohydrates
About 100mg of the extract was dissolved in 5ml distilled water and filtered. The filtrate was subjected to following tests.
Molish’s test
To 2ml of filtrate, add few drops of alcoholic solution of alphanaphthol. The mixtures were shaken well and 1ml of conc. sulphuric acid was added along the sides of test tube. A violet ring at the junction showed the presence of carbohydrates.
Benedict’s test
To 1ml of extract few drops of Benedict’s reagent were mixed with and boiled on water bath. Green yellow or brick red color indicated presence of reducing sugar.
Fehling’s test
1ml of filtrate was boiled on water bath and 1ml each of Fehling’s A and B solution were added. Formation of red precipitates indicated the presence of sugar.
Barfoed’s test
To 1ml filtrate, 1ml of Barfoed’s reagent was added and heated on a boiling water bath for 2 minutes. Formation of red colored precipitates indicated the presence of sugar.
G. Tests for proteins
To 1ml of extract solution, 2ml of Biuret reagent was added and the mixture was allowed to stand for few minutes. Formation of blue color precipitates indicated the presence of proteins.
H. Tests for volatile oil
Aqueous solutions of the extract were treated with sudan III dye. Formation of red colored globule indicated the presence of volatile oil.
Dose Selection
The dose of GSLE selected for the present study was according to the findings of previous researchers [17].
Oral glucose tolerance test (Ogtt) [18]
Overnight fasted rats were randomly selected and assigned into 4 groups of 5 animals each. All the animals were administered with glucose (1g/kg) orally by means of gastric intubation. Water was provided ad libitum.
• Group I: (Glucose loaded) animals received glucose solution (1g/kg).
• Group II: animals treated with GSLE at a dose of 150 mg/ kg + glucose solution (1g/kg).
• Group III: animals received GSLE at a dose of 300 mg/kg + glucose solution (1g/kg).
• Group IV: (Standard control) animals received standard drug (glimepride) and glucose (1g/kg).
Blood samples were collected from Retro Orbital Plexus (ROP) of the eye at 0, 30, 60, and 90 minute after the administration of glucose solution and glucose levels were analyzed using glucose strips.
Streptozotocin (Stz) Induced Diabetes in Rats [19]
Induction of diabetes
Streptozotocin (35 mg/kg) was prepared by dissolving in freshly prepared ice-cold citrate buffer (0.1M, pH 4.5). After 18 hours of fasting, the rats were treated with freshly prepared STZ. The animals with blood glucose level more than 200 mg/dl were selected for study.
The diabetic rats after confirmation of stable hyperglycemia were divided into 5 groups with 7 animals in each group. That day was considered 0th day and the further experimental procedure was followed.
Experimentation procedure
Animals were fasted overnight (deprived of food for at least 12 h but allowed free access to water). The drug solutions or vehicle were administered orally by gastric intubation once daily for 21 days.
• Group I: Diabetic control received vehicle (Tween 80 and distilled water).
• Group II: Diabetic rats received glimepride (5 mg/kg).
• Group III: Diabetic rats received GSLE (150 mg/kg).
• Group IV: Diabetic rats received GSLE (300 mg/kg)
The effect of vehicle, extract and standard drug on blood glucose, body weight, food and water intake was determined in fasted animals at 0th, 5th, 10th, 15th, and 21st day after oral administration.
Effect of Gsle on Body Weight
During the study period of 21 days, animals were weighed on 0th, 5th, 10th, 15th, and 21st days and effect of vehicle, standard drug and GSLE on the body weight was calculated.
Determination of Biochemical Parameters
Whole blood samples (2 mL) of all the animals were collected by ROP under ether anesthesia and were centrifuged at 3000 rpm for 20 min. Serum was separated and stored at temperature of -20° C until analysis was performed. Serum samples were analyzed for cholesterol (CH), triglycerides (TG), high density lipoproteins (HDL), low density lipoproteins (LDL), total proteins, urea, creatinine, serum glutamate oxaloacetate transaminase (SGOT), serum glutamate pyruvate transaminase (SGPT), Alkaline Phosphatase (ALP) by using the diagnostic kit in auto analyzer.
Histopathological Examination
On the 21st day of study, the animals were sacrificed under ether anesthesia, and pancreas was excised. They were stored in 10% formalin after washing with normal saline, processed for paraffin embedding, tissue sections (5 μm thick) were stained with haematoxylin and eosin. The histopathological parameters were analysed in Medicose Laboratories, Chandigarh. An experienced pathologist, unaware of the different drug treatment, evaluated the slides under light microscope to check the damage caused due to diabetes and protective effect by extract under study.
Statistical Analysis
All the results are presented as mean ± standard error of mean (S.E.M.). The statistical analysis involving two groups was evaluated by means of Student’s t-test whereas one way analysis of variance (ANOVA) followed by Dunnet’s multiple comparison post-test was used for statistical comparison between control and various treated groups. Statistical significance was accepted at the P<0.01 values.
Results
Preliminary phytochemical study of Gsle
The GSLE was found to contain various phytochemical as mentioned in (Table 1).
.
| S. No. |
Phytoconstituents |
Results |
| 1 |
Carbohydrates |
- |
| 2 |
Glycosides |
+ |
| 3 |
Flavonoids |
+ |
| 4 |
Amino acids |
- |
| 5 |
Alkaloids |
+ |
| 6 |
Tannins |
+ |
| 7 |
Proteins |
- |
| 8 |
Steroids |
+ |
“+” indicates the presence; “-“ indicates the absence of phytoconstituents
Table 1: Effect of GLSE on preliminary phytochemical screening tests.
Oral glucose tolerance test of Gsle
An increase in fasting blood glucose level in OGTT was significantly lower in extract treated rats as compared to control. In rats treated with 150 and 300 mg/kg of extract a significant (P<0.01) reduction was observed in blood glucose level when compared with control at 30 min after oral administration of glucose. A consistent significant fall in blood glucose level was observed in rats treated with glimepride (5mg/kg BW) at 30, 60, 90 min after glucose administration (Table 2).
| Group (n=5) |
Time (min) |
| 0 |
30 |
60 |
90 |
| Control (glucose 1 mg/kg) |
74 ± 9.445 |
121 ± 5.904 |
90.2 ± 2.458 |
69.6 ± 2.821 |
| Glucose + Glimepride (5 mg/kg) |
61 ± 5.788 |
57.4 ± 3.43** |
55 ± 10.599** |
45.2 ± 5.229** |
| Glucose + GSLE (150 mg/kg) |
60.4 ± 2.379 |
85.4 ± 6.427** |
83.2 ± 4.115 |
57.2 ± 2.478* |
| Glucose + GSLE (300 mg/kg) |
66.2 ± 6.829 |
89 ± 7.902** |
103 ± 3.742 |
64 ± 1.140 |
All values represent means ± SEM (number of animals= 5), P<0.01 and P<0.05 when compared with control group using Dennett’s test
Table 2: Effect of GSLE on serum glucose level in oral glucose tolerance test.
Streptozotocin induced diabetes in rats
The intra-peritoneal administration of streptozotocin (35 mg/kg) leads to elevation of blood glucose levels in rats as shown in (Table 3). GSLE at both the doses (150 and 300 mg/ kg) showed significant (P<0.01) and continuous reduction in blood glucose levels. The effect was prominent after 10th day of the study. GSLE at 300 mg/kg exhibited maximum glucose lowering effect in diabetic animals when compared to 150 mg/ kg. Fall in blood glucose by glimepride was more considerable at the beginning, followed by a consistent fall henceforth.
| Group (n=7) |
Days |
| 0th |
5th |
10th |
15th |
21st |
| Diabetic control |
435.57 ± 25.77 |
460.57 ± 19.33 |
465.57 ± 19.33 |
467.57 ± 19.33 |
474.71 ± 19.94 |
| STZ + glimepride (5 mg/kg) |
415.57 ± 31.03 |
247.71 ± 23.22** |
196 ± 18.22** |
135.14 ± 7.16** |
86.28 ± 3.22** |
| STZ + GSLE (150 mg/kg) |
451 ± 34.96 |
323.57 ± 36.52** |
317.71 ± 36.78** |
111.86 ± 12.62** |
91 ± 2.22** |
| STZ + GSLE (300 mg/kg) |
497.86 ± 29.73 |
321.71 ± 33.79** |
312 ± 32.90** |
162 ± 18.09** |
99.42 ± 4.80** |
All values represent means ± SEM (number of animals= 7), (P<0.01) when compared with diabetic control group using Dennett’s test
Table 3: Effect of GSLE on blood glucose level in STZ induced diabetic rats.
Effect of Gsle on body weight
The diabetic rats show a continuous decrease in body weight. The diabetic rats treated with glimepride (5mg/kg) as well as GSLE 150 mg/kg and 300 mg/kg showed significant improvement in BW (Table 4). However, GSLE at 300 mg/kg showed more prominent increase in BW. An initial drop in BW was observed in extract treated rats on 10th day as compared to diabetic control animals. This was followed by a period of continuous and significant improvement in BW at both the doses.
| Group (n=7) |
Days |
| 0th |
5th |
10th |
15th |
21st |
| Diabetic control |
268 ± 0.488 |
262.7 ± 0.08 |
249.6 ± 0.922 |
234 ± 1.478 |
211 ± 2.628 |
| STZ + glimepride (5 mg/kg) |
250.7 ± 1.30 |
248.3 ± 1.409** |
236.3 ± 2.082** |
243 ± 1.309** |
246.1 ± 2.558** |
| STZ + GSLE (150 mg/kg) |
250 ± 1.17 |
246.7 ± 1.063** |
234.3 ± 1.304** |
242.6 ± 1.86** |
240.3 ± 1.948** |
| STZ + GSLE (300 mg/kg) |
249.7 ± 1.12 |
246.3 ± 1.209** |
237 ± 1.480** |
239.3 ± 1.70 |
242.6 ± 2.213** |
All values represent means ± SEM (number of animals= 7), (P<0.01) when compared with diabetic control group using Dennett’s test
Table 4: Effect of GSLE on body weight in STZ-induced diabetic rats.
Effect of Gsle on lipid profile
The diabetic control rats showed a increase in the serum total cholesterol, triglycerides, LDL and decrease in HDL level. The treatment of diabetic animals with standard drug as well as with GSLE (150 and 300mg/kg) showed significant (P<0.01) increase in the level of HDL and a decrease in LDL levels, total cholesterol and triglycerides in a dose dependent manner (Table 5).
| Group (n=7) |
Lipid profile (mg/dl) |
| CH |
HDL |
LDL |
TG |
| Diabetic control |
230 ± 1.20 |
32 ± 2.42 |
159 ± 1.11 |
91 ± 1.45 |
| STZ + glimepride (5 mg/kg) |
170 ± 1.40** |
43 ± 2.00** |
99 ± 1.65** |
70 ± 1.22** |
| STZ + GSLE (150 mg/kg) |
189 ± 1.93** |
40 ± 2.03 |
106 ± 1.88** |
81 ± 1.52** |
| STZ + GSLE (300 mg/kg) |
190 ± 2.11** |
31 ± 1.09** |
110 ± 2.34** |
80 ± 1.42** |
All values represent means ± SEM (number of animals= 7), (P<0.01) when compared with diabetic control group using Dennett’s test.
Table 5: Effect of GSLE on serum cholesterol levels in STZ-induced diabetic rats.
Effect of Gsle on kidney functions
Kidney function markers like urea, creatinine and proteins were elevated in diabetic control rats when compared with the normal rats (Table 6). GSLE reduced the levels of all the parameters in dose dependent manner. Although the reduction of creatinine and protein was not significant, level of urea was decreased significantly.
| Group (n=7) |
Kidney Parameters (mg/dl) |
Liver Parameters (U/L) |
| Urea |
Creatinine |
Proteins |
SGPT |
SGOT |
ALP |
Diabetic
control |
65.8 ± 1.09 |
1.1 ± 1.07 |
5.2 ± 1.83 |
62 ± 1.67 |
49 ± 1.67 |
87 ± 1.07 |
STZ +
glimepride (5 mg/kg) |
40.9 ± 1.73** |
0.95 ± 1.52 |
7.4 ± 1.62 |
45 ± 2.67** |
30 ± 1.56** |
93 ± 3.01** |
STZ +
GSLE (150 mg/kg) |
48.6 ± 2.43** |
0.97 ± 2.05 |
6.3 ± 1.90 |
41 ± 2.31** |
32 ± 2.03** |
73 ± 2.71** |
STZ +
GSLE (300 mg/kg) |
47.3 ± 2.31** |
0.98 ± 2.11 |
5.2 ± 2.03 |
51 ± 1.34** |
43 ± 1.93** |
68 ± 1.09 |
All values represent means ± SEM (number of animals= 7), (P<0.01) when compared with diabetic control group using Dunnett’s test.
Table 6: Effect of GSLE on kidney and liver parameters of STZ-induced diabetic rats.
Effect of Gsle on liver functions
Liver enzymes e.g. SGPT, SGOT and ALP were increased in diabetic rats. The GSLE treated rats showed a significant (P<0.01) reduction in elevated levels of liver enzymes (Table 6). Decrease in both SGPT and SGOT was more with GSLE at 150 mg/kg.
Histopathological examination
Histopathological study of pancreas of diabetic control, normal control and extract treated groups was done to ascertain the damage caused due to diabetes and protective effect by extract under study. As shown in Figure 1A. Diabetic control rats showed the presence of pancreatic acini and small atrophic islets. In diabetic control rats extensive damage was seen in the islets of Langerhans. Glimepride treated rats restored the normal cell production and enlarged size of β-cells (Figure 1B). The GSLE treated groups showed slight increase in the size of β-cells and normal architecture (Figure 1C and 1D).
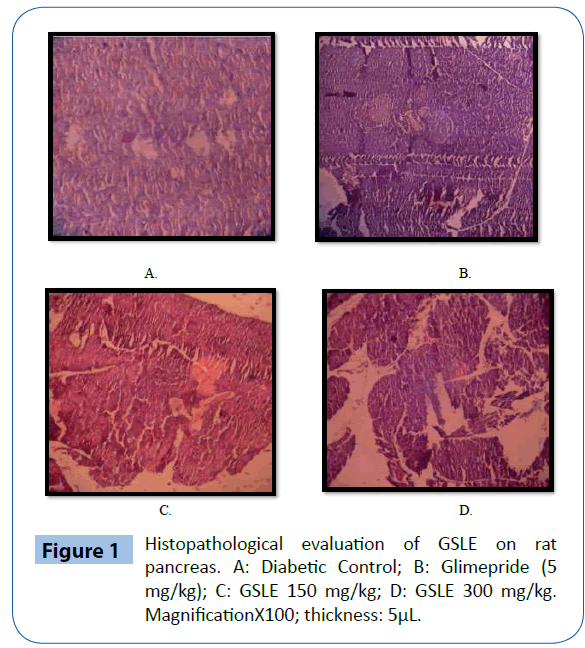
Figure 1: Histopathological evaluation of GSLE on rat pancreas. A: Diabetic Control; B: Glimepride (5 mg/kg); C: GSLE 150 mg/kg; D: GSLE 300 mg/kg. MagnificationX100; thickness: 5μL.
Discussion
The present study was conducted to ascertain the hypoglycemic activity of Gloriosa superba leaves. For this purpose, a hydroalcoholic extract of Gloriosa superba leaves (GSLE) was successfully prepared by Soxhlet method and the extractive value was obtained to be 10% w/w. Type 2 diabetes was induced in male albino rats of Wistar strain via single i.p. injection of STZ (35 mg/kg). STZ acts by selectively destroying β-cells of pancreatic islets possibly by breaking the DNA strand, resulting in decreased endogenous insulin release [20].
When GSLE was administered to glucose loaded normal fasted rats (OGTT), significant reduction in blood glucose level was achieved at higher doses within 120 min of administration. It suggests that extract treated animals utilize glucose more promptly. This is a mechanism similar to biguanides which decrease hepatic glucose output and promote tissue glucose uptake and do not increase insulin secretion, hence producing anti-hyperglycemic effect and not hypoglycemic effect [21].
STZ [2-deoxy-2(3-methyl-3-nitrosoureido)-D-glucopyranose] is an antibiotic that is used to induce diabetes in experimental animals. Throughout the period of study, STZ-induced diabetic rats showed significant and consistent decrease in FBG levels after administration of GSLE, when compared to diabetic controls, indicating its potent anti-diabetic activity. This may be due to protective action of GSLE on pancreatic β-cells. As evident from the histopathological examination of animal pancreas, the GSLE exhibited the regeneration and prevention of necrosis of β-cells.
Induction of diabetes by STZ leads to loss of body weight due to increased muscle wasting and loss of tissue structural proteins [20,22]. Carbohydrates are utilized by muscles as an energy source; therefore their unavailability might lead to protein wasting [23]. The GSLE treated groups enhanced glucose metabolism and thus improved body weight in STZdiabetic rats.
Hyperlipidemia is a recognized complication of DM with an increased risk of coronary heart disease and atherosclerosis secondarily. It is characterized by elevated serum cholesterol levels, triglycerides and phospholipids and changes in lipoprotein composition [24,25]. As in the diabetic state, the insulin secretion is impaired and the lipolytic hormones are not checked. Lipoprotein lipase, an enzyme which hydrolyses triglycerides is activated by insulin under normal circumstances. However, in diabetic state, lipoprotein lipase is not activated leading to hypertriglyceridemia. Hypercholesterolemia is also associated with insulin deficiency. As evident in the present study, GSLE significantly reduced the serum cholesterol, serum triglycerides, LDL and increased the HDL cholesterol levels, indicating its hypolipidemic activity and may also decrease the risk of vascular disease and related complications [21]. The hypocholesterolemic activity of GSLE may be due to a number of mechanisms including a) stimulation of cholesterol-7-alphahydroxylase (CYP7A1), which covert cholesterol into bile acids; b) inhibition of HMG-CoA reductase; and/or c) inhibition of cholesterol absorption from the intestine due to the formation of complexes with compounds such as glycosides and saponins [26-28].
Serum urea and creatinine levels are considerably elevated in diabetic animals due to hyperglycemia. These are considered significant markers of renal dysfunction. When glucose concentration in blood is raised beyond renal threshold, complications like glycosuria accompanied by polyuria, polydypsia and polyphagia are clinically manifested [29]. After the treatment of STZ-diabetic rats with GSLE, the serum urea and creatinine were significantly reduced.
The elevation of biomarker enzymes such as AST, ALT and ALP was observed in diabetic control rats which indicated the hepatocellular damage. The GSLE showed significant decrease in AST, ALT and ALP level indicating its hepatoprotective action.
The phytochemical screening of G. superba revealed that it contains saponin glycosides, flavonoids, alkaloids, tannins and steroids. It has been previously documented that flavonoids and phenols are responsible for the hypoglycemic action [30-36]. So, the anti-diabetic effect of the G. superba might be attributed to its flavonoid content.
Conclusion
The result of the present study concludes that hydroalcoholic extract of G. superba leaves possess significant anti-diabetic activity. This may be due to the presence of flavonoids and phenolic contents in the extract. The current work opens an avenue of further investigation for possible anti-diabetic drug development and research. Further investigations can reveal its active phytochemical principle responsible for its hypoglycemic activity. Moreover, insight into cellular and molecular levels can further elucidate its mechanism.
Acknowledgement
The authors are thankful to the Institute of Pharmaceutical Sciences, Kurukshetra University, Kurukshetra for providing sufficient research facilities for the conduct of present research work
7712
References
- Tripathi KD (2008) Essentials of Medicinal Pharmacology. Jaypee Brothers Medical Publishers (P) Ltd, New Delhi 254-255.
- Andrade-Cetto A, Martínez-Zurita E, Wiedenfeld H (2005) Hypoglycemic effect of Malmeadepressa root on streptozotocin diabetic rats. J Ethnopharmacol 100: 319-322.
- vanDieren S, Beulens JW, van der Schouw YT, Grobbee DE, Neal B (2010) The global burden of diabetes and its complications: an emerging pandemic. Eur J Cardiovasc Prev Rehabil 17 Suppl 1: S3-8.
- Verma L, Khatri A, Kaushik B, Patil UK, Pawar RS (2010) Antidiabetic activity of Cassia occidentalis (Linn) in normal and alloxan-induced diabetic rats. Indian J Pharmacol 42: 224-228.
- Verma SM, Suresh KB, Verma A (2010) Antidiabetic activity of leaves of Indoferatinctoria Linn. (Fabaceae). International Journal of Toxicological and Pharmacological Research 1: 42-3.
- Kumar R, Arora V, Ram V, Bhandari A, Vyas P (2015) Hypoglycaemic and hypolipidemic effect of Allopolyherbal formulation in streptozotocin induced diabetes mellitus in rats. Int J Diabetes Mellit 3: 45-50.
- Momin A (1987) Role of indigenous medicine in primary health care. Proceedings of first international seminar on Unani medicine, New Delhi.
- Kavitha N, De S, Kanagasabai S (2013) Oral Hypoglycemic Agents in pregnancy: An Update. J Obstet Gynaecol India 63: 82-87.
- Day C (1998) Traditional plant treatments for diabetes mellitus: pharmaceutical foods. Br J Nutr 80: 5-6.
- Gopi R, Kavina J, Selvam P (2011) Gloriosasuperba Linn.- A medicinally important plant. Journal of Pharmacy Research 3: 69-71.
- Jana S, Shekhawat GS (2011) Critical review on medicinally potent plant species: Gloriosasuperba. Fitoterapia 82: 293-301.
- AstanghrudayaSahitaSutrasthan, ShodanadhiganSangrah On Group Aragwadhadi Gan,
- Pawar BM, Wavhal VP, Pawar ND, Agarwal MR, Shinde PB, Kamble HV (2011) Anthelmintic activity of Gloriosasuperba Linn (Liliaceae). Int J Pharm Technol Res 2:1483-1487.
- Malpani AA, Aswar UM, Kushwaha SK, Zambare GN, Bodhankar SL (2011) Effect of the aqueous extract of Gloriosasuperba Linn (Langli) roots on reproductive system and cardiovascular parameters in female rats. Trop J Pharm Res 10: 169-76.
- Bhide B, Acharya R (2012) Uses of Langali (Gloriosasuperba Linn.): An Ethnomidicinal Perspective. AyurpharmInt J AyurAlliSci 1(3): 65-72.
- Khandelwal KR (2007) Practical Pharmacognosy, techniques and experiments. 8th ed. Pune, India; Nirali Prakashan:149-153.
- John JC, Fernandes J, Nandgude T, Niphade SR, Savla A, Deshmukh PT (2009). Analgesic and anti-inflammatory activities of the hydroalcoholic extract from Gloriosasuperba Linn. Int J Green Pharm 3: 215-219.
- Coyne CP (2006) Comparative diagnostic pharmacology; applications in living system models. Blackwell Publishing Ltd, UK: 101.
- Khan HB, Vinayagam KS, Sekar A, Palanivelu S, Panchanadham S (2012) Antidiabetic and antioxidant effect of Semecarpusanacardium Linn. nut milk extract in a high-fat diet STZ-induced type 2 diabetic rat model. J Diet Suppl 9: 19-33.
- Stephen Irudayaraj S, Sunil C, Duraipandiyan V, Ignacimuthu S (2012) Antidiabetic and antioxidant activities of Toddaliaasiatica (L.) Lam. leaves in streptozotocin induced diabetic rats. J Ethnopharmacol 143: 515-523.
- Jarald EE, Joshi SB, Jain DC (2008) Antidiabetic activity of flower buds of Micheliachampaca Linn. Indian J Pharmacol 40: 256-260.
- RamachandranS, Rajasekaran A, Manisenthilkumar KT (2012) Investigation of hypoglycemic, hypolipidemic and antioxidant activities of aqueous extract of Terminaliapaniculata bark in diabetic rats. Asian Pac J Trop Biomed 2: 262-268.
- Weinert DJ (2009) Nutrition and muscle protein synthesis: a descriptive review. J Can ChiroprAssoc 53: 186-193.
- Ford ES, Greenlund KJ, Hong Y (2012) Ideal cardiovascular health and mortality from all causes and diseases of the circulatory system among adults in the United States. Circulation 125: 987-995.
- Kaur J (2014) A comprehensive review on metabolic syndrome. Cardiol Res Pract 2014: 943162.
- Riyad MA, Abdul-Salam SA, Mohammad SS (1988) Effect of fenugreek and lupine seeds on the development of experimental diabetes in rats. Planta Med 54: 286-290.
- Yokogoshi H, Oda (2002) Dietary taurine enhances cholesterol degradation and reduces serum and liver cholesterol concentrations in rats fed a high cholesterol diet. Amino Acids 23: 433-439.
- Chen W, Matuda K, Nishimura N, Yokogoshi H (2004) The effect of taurine on cholesterol degradation in mice fed a high-cholesterol diet. Life Sci 74: 1889-1898.
- Changrani NR, Chonkar A, Adeghate E, Singh J (2006) Effects of streptozotocin induced type 1 diabetes mellitus on total protein concentration and cation contents in the isolated pancreas, parotid, submandibular, and lacrimal glands of rats. Annual New York Acad Scien 1084: 503-519.
- Coskun O, Kanter M, Korkmaz A, Oter S (2005) Quercetin, a flavonoid antioxidant, prevents and protects streptozotocin-induced oxidative stress and beta-cell damage in rat pancreas. Pharmacol Res 51: 117-123.
- Dias AS, Porwski M, Alonso M, Marroni N, Collado PS, Gonzalez-Gallego J (2005) Quercetin decreases oxidative stress, NF-kappa B activation, and iNOS over expression in liver of streptozotocin induced diabetic rats. J Nutr 135: 2299-2304.
- Shetty AK, Rashmi R, Rajan MGR, Sambaiah K, Salimath PV (2004) Antidiabetic influence of quercetin in streptozotocin induced diabetic rats. Nutr Res 24: 373-81.
- Suba V , Murugesan T, Rao RB, Ghosh L, Pal M, et al. (2004) Antidiabetic potential of Barlerialupulina extract in rats. Fitoterapia 75: 1-4.
- [No authors listed] (1988) Plant flavonoids in biology and medicine II. Biochemical, cellular, and medicinal properties. Proceedings. Strasbourg, France, August 31-September 3, 1987. Prog Clin Biol Res 280: 1-461.
- Wilson JM, Ohashi M, Budzikiewicz H, Santavý F, Djerassi C (1963) Mass spectrometry in structural and stereochemical problems. 33. Colchicine alkaloids. Tetrahedron 19: 2225-2231.