Keywords
Anticonvulsant enaminone E 122; Excipientcompatibility; DSC; FT-IR; Isothermal stress testing
Introduction
Epilepsy is a neurological condition, characterized by the onset of spontaneous convulsant and non-convulsant seizures [1]. Serious problems such as resistance to antiepileptic drugs (AEDs) and the side effects associated with the current AEDs have necessitated the need for novel anticonvulsant compounds [2-10]. Enaminones are a novel class of compounds that possess a range of pharmacological effects including anticonvulsant and antimalarial properties [11]. These compounds contain the conjugated system N-C=C-C=O (enamines of β-dicarbonyl). Edafiogho et al. have synthesized numerous halogenated enaminone esters and investigated their pharmacological activities [12-14]. The use of enaminones as potential anticonvulsant compounds has also been well documented [15].
Compound E 122 is chemically described as Ethyl 4-(4’-bromophenyl) amino-6-methyl-2-oxocyclohex-3-en-1-oate, and was first synthesized and characterized by Scott et al. [12,16]. However, no preformulation studies have been performed on anticonvulsant enaminones. Therefore, it was desirable to embark on the preformulation studies as described in this manuscript. Compound E 122 was selected as it is a class 1 anticonvulsant enaminone (active at doses 100 mg/kg and below) that showed minimum side effects (Figure 1) [16].
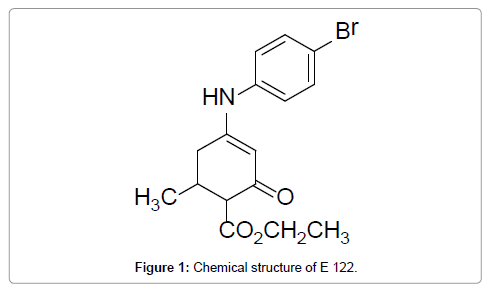
Figure 1: Chemical structure of E 122.
In order to develop a successful solid dose formulation, careful selection of excipients is crucial. Excipients play a very important role in formulation by facilitating the administration and the release of the active drug as well as protect it from the harsh environmental conditions such as moisture, oxygen, and extreme pH [17]. Though excipients are considered pharmaceutically inert, they may interact physically and chemically with active pharmaceutical ingredients, thus drug excipient compatibility study is an important step in the preformulation stage in drug development [18]. Incompatibility between drug and excipient can alter the stability and bioavailability of drugs, therefore, affecting its safety and efficacy [19]. Thus, prior knowledge of the drugexcipient behavior is considered crucial and must be examined before the formulation development. There are numerous ways to conduct excipient compatibility screening, amongst which thermal analysis techniques such as differential scanning calorimetry (DSC) are widely popular due to advantages such as minimal sample requirements, rapid measurements, and relative experimental simplicity [20-24]. Beside thermal analysis, Fourier transform infrared spectroscopy (FT-IR), and x-ray diffractometry (XRD), are used as complementary techniques to investigate drug-excipient interactions [25]. Isothermal stress testing (IST) is another important method that is used for evaluating the drug– excipient compatibility. In this method, the drug-excipient mixture is stored with or without moisture at a high temperature and the drug content determined [25,26].
In this study, the compatibility of E 122 with three selected excipients was evaluated. DSC profiles of the E122 enaminone and each of the excipients were compared with those obtained from 1:1 physical mixtures of the E 122 and the excipients. DSC results are complemented by FT-IR and isothermal stress testing studies.
Materials and Methods
Chemicals
The model drug enaminone E 122 sample was synthesized and purified by Dr. Edafiogho [12,16]. The excipients used were either analytical or USP grade. Corn starch, lactose monohydrate, microcrystalline cellulose (MCC) and hydroxy propyl methyl cellulose (HPMC) were purchased from Professional Compounding Centers of America (PCCA), Houston TX USA. Physical mixtures of E122 with each selected excipient were prepared in the 1:1 ratio by simple mixture of the components in a mortar and pestle at room temperature.
Simultaneous Thermal Analyzer (STA)
All the thermal analysis studies were conducted using simultaneous thermal analyzer STA 6000 from Perkin Elmer USA. Samples of individual components as well as each drug-excipient mixture were weighed directly in ceramic pans (3-10 mg) and scanned in the 30- 5000°C temperature range at the rate of 100°C/minute. Dry nitrogen gas was used as a purge gas at 30-45 pressure per square inch with a balance purge of approximately 40 cc/min.
Fourier Transform Infrared (FT-IR)
FT-IR spectra of drug, excipients and physical mixtures were recorded on Protege 460 Spectrometer, from Nicolet USA using Nujol oil mull in the range of 4000-400 cm-1. Samples were prepared by grinding them in a mortar and pestle, approximately 2 to 3 drops of mineral (Nujol) oil was added to the ground mixture, producing an opaque white paste. Small amount of this paste was loaded onto NaCl windows for spectral acquisition (background spectra taken periodically).
Isothermal Stress Testing (IST)
125 mg of drug and selected excipients were weighed directly into a 5.5 mL clear glass vials (n=2). Mixing was done on a vertex mixture for 3 minutes, with 10% (w/w) water in each vial. The drug-excipient blend was further mixed with a glass capillary. The capillary was broken and left inside the vial. The vials were tightly closed with a screw cap lid, sealed with parafilm, and then were stored at 60°C in the oven for 2 weeks. Another set of samples was stored in the refrigerator at 4°C and a third set stored at room temperature (25°C). Drug-excipient blends without water were served as controls. The samples were periodically examined for any change in physical appearance. Quantitative analysis of samples was conducted using UV-visible spectrophotometer (Genesys 10S UV-Vis, Thermo Scientific USA) after two weeks of storage at above conditions. The samples were diluted in 95% alcohol. The UV-Vis spectroscopic studies were carried out at a wavelength of 315 nm.
Results and Discussion
Thermal behavior of E 122
In Figure 2, the TG/DTG curves of E 122 compound is presented and it is clear that E 122 remains stable up to 200°C, presenting no mass loss. Starting approximately at 215°C, E 122 compound begins mass loss till 300°C, followed by an exothermic event at 315°C which can also be seen from Figure 3 representing the DSC curve of E 122 compound. Mass loss is more gradual after 315°C and shows a residual of 34% at 487°C. Figure 3 showing the DSC curve of E122 reveals important information about the melting behavior. An endothermic peak at 156.5°C corresponds to the melting of E 122 compound [12,16], and it is evident that E 122 is stable beyond its melting point up to 200°C as seen from the TG/DTG curve. An exothermic event at 315°C can also be seen from the DSC curve corresponding to decomposition of E 122.
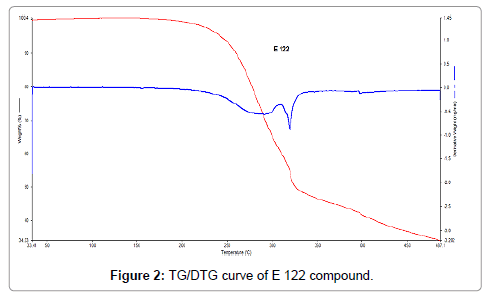
Figure 2: TG/DTG curve of E 122 compound.
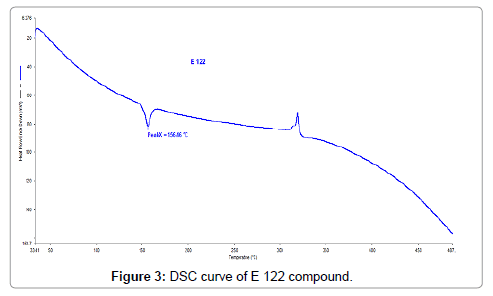
Figure 3: DSC curve of E 122 compound.
Compatibility with excipients studied with thermal analysis
From the TG curves of α-lactose monohydrate, presented in Figure 4, four regions of mass loss can be observed. The first mass loss step occurs between 100°C and 180°C and corresponds to 5% mass loss which is attributed to loss of crystalline water and is in good agreement with the literature [27]. The next degradation steps are consecutive and result in overlapping peaks of the DSC curve represented in Figure 5. DSC curve of α-lactose monohydrate also reveals important observations. The first endothermic peak at a 146.6°C, corresponds to water evaporation which is also identified from the TG curve. The second endothermic peak corresponds to the melting of α-lactose monohydrate which has an onset at 210°C with a peak temperature at 218.2°C [28], while a small third endothermic peak is also observed at approximately 230°C which corresponds to the mass loss step, as seen from the TG curve. A broad endothermic and an exothermic peaks are also observed between the temperature regions of 250°C and 315°C which corresponds to the endothermic mass loss and exothermic degradation for α-lactose monohydrate.
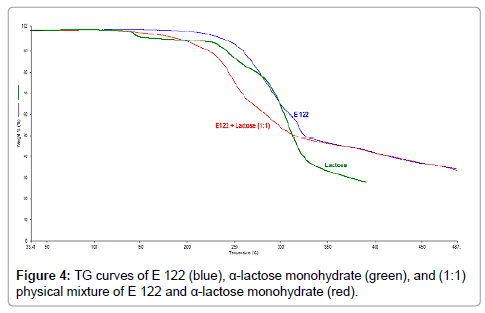
Figure 4: TG curves of E 122 (blue), α-lactose monohydrate (green), and (1:1) physical mixture of E 122 and α-lactose monohydrate (red).
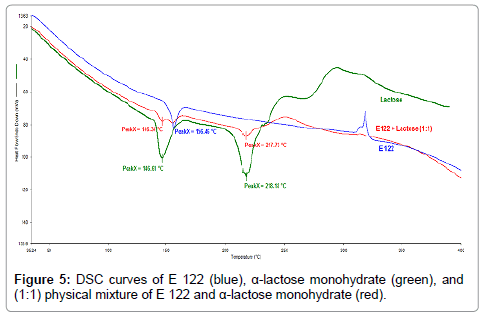
Figure 5: DSC curves of E 122 (blue), α-lactose monohydrate (green), and (1:1) physical mixture of E 122 and α-lactose monohydrate (red).
From the TG curves of the 1:1 physical mixtures of E 122 and α-lactose monohydrate (Figure 4), (red curve), three degradation steps can be seen. The first occurs between 100°C and 180°C, the second step ranges between 180°C and 340°C, while the third step is a continuous gradual mass loss step beyond 340°C. DSC curves of both the substances and their physical mixtures (Figure 5) reveals an important observation that the melting of the E 122 compound and α-lactose monohydrate is practically unchanged in the 1:1 blend, indicating the compatibility of the two substances up to 340°C. Above 340°C, some interaction is suspected since the exothermic peak for E 122 and the endothermic peak of α-lactose monohydrate disappear in the 1:1 blend.
From the TG curve of MCC (Figure 6), (green curve), it appears that water loss is the first step beginning at ambient temperature and ending at 120°C. The second mass loss step occurs between the ranges of 200°C-400°C as previously reported in the literature [27] and a gradual mass loss is seen above 400°C. TG curve of the 1:1 blend of the E 122 and MCC (Figure 6), (red curve) shows a small initial mass loss step corresponding to water evaporation from MCC. The second step corresponding to mass loss and main degradation of the blend occurs between the ranges of 200°C-400°C, after which mass loss is very gradual. DSC curve of MCC (Figure 7), (blue curve) shows a broad endothermic peak with an onset at 300°C and a peak temperature at 332.6°C. From the DSC curves (Figure 7) of the pure components and their 1:1 blend, it is evident that E 122 is compatible with MCC at least below 300°C. The melting of E 122 practically remains unchanged in the binary mixture revealing no interaction between the components below 300°C.
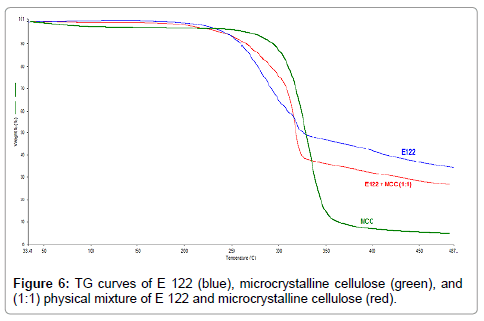
Figure 6: TG curves of E 122 (blue), microcrystalline cellulose (green), and (1:1) physical mixture of E 122 and microcrystalline cellulose (red).
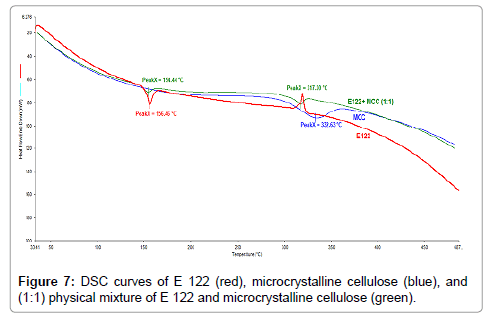
Figure 7: DSC curves of E 122 (red), microcrystalline cellulose (blue), and (1:1) physical mixture of E 122 and microcrystalline cellulose (green).
TG curves indicate that starch (Figure 8), (blue curve) exhibits a wide endothermic peak in the initial temperature ranges where it loses adsorbed water upto a temperature of 160°C. It is then followed by a main decomposition step ranging from 210°C-410°C resulting in the total mass loss of 80%. From the TG curves of the binary 1:1 blend of E 122 and starch (Figure 8), (red curve), three degradation steps can be observed. The first step occurs below 160°C and corresponds to water loss from starch, while the second and third step occur in the range of 200 °C-400°C corresponding to the sum of mass loss curves of the individual components. DSC curves of the binary 1:1 blend of E 122 and starch (Figure 9), (red curve) clearly reveals that the characteristic melting peak of E 122 remains practically unchanged, thus indicating full compatibility with starch. Above 280°C, the heat flow curve of the blend corresponds to the sum of exothermic degradation and endothermic mass loss as the blend undergoes its major degradation steps.
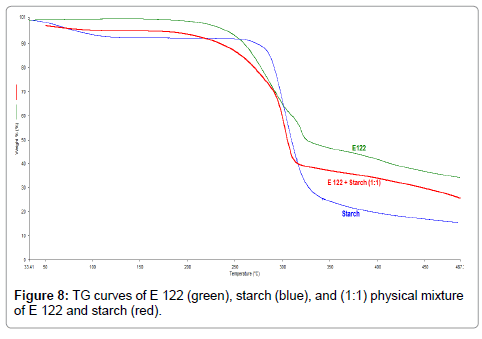
Figure 8: TG curves of E 122 (green), starch (blue), and (1:1) physical mixture of E 122 and starch (red).
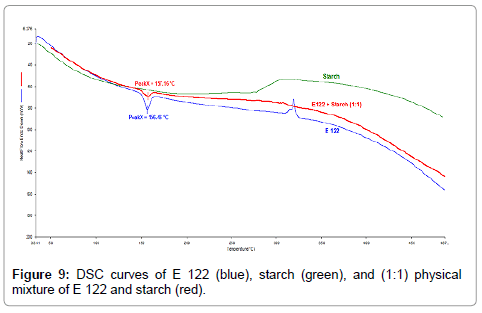
Figure 9: DSC curves of E 122 (blue), starch (green), and (1:1) physical mixture of E 122 and starch (red).
TG curves indicate that HPMC (Figure 10), (blue curve) also exhibits a broad endothermic peak corresponding to water loss up to a temperature of 110°C. The main degradation step occurs from 200°C-450°C resulting in major mass loss with a residual mass of 10% at 450°C. TG curves of the binary 1:1 blend of E 122 and HPMC reveal a first broad endothermic peak corresponding to water loss from HPMC, a second and a third step occurring from 150°C to 450°C corresponding to the sum of mass loses of the individual components. Although DSC curves of HPMC (Figure 11), (green curve) exhibits several endothermic peaks; HPMC is not a thermoplastic material and thus does not undergo change in physical characteristic before its degradation. The first endothermic peak corresponding to water loss is seen from ambient temperature up to 120°C and the peaks seen above 210°C correspond to various stages of browning and charring finally resulting in degradation. The careful study of the DSC curve of the binary 1:1 blend of E 122 and HPMC (Figure 11), (red curve) reveals that the peak melting endotherm for E 122 practically remains unchanged. The characteristic HPMC endothermic peak at 348.9°C shifts to a lower temperature at 344.5°C which might indicate some interaction further indicating that E 122 is fully compatible with HPMC atleast below 300°C.
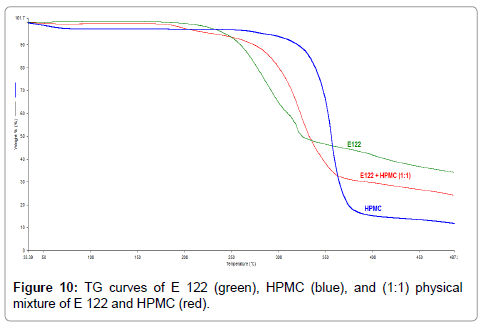
Figure 10: TG curves of E 122 (green), HPMC (blue), and (1:1) physical mixture of E 122 and HPMC (red).
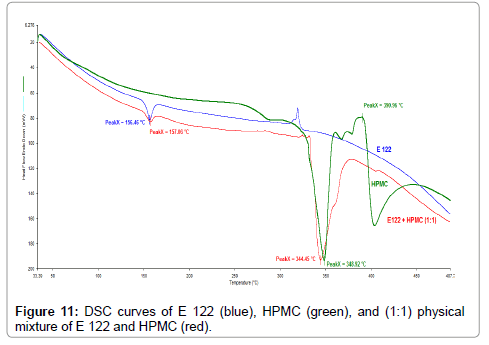
Figure 11: DSC curves of E 122 (blue), HPMC (green), and (1:1) physical mixture of E 122 and HPMC (red).
Compatibility with excipients studied with FTIR
One of the advantages of using FTIR spectroscopy as a complimentary technique to investigate possible chemical interaction is that it is a non-destructive method providing high quality results. FTIR spectra of E 122 (Figure 12A) showed the characteristic band peaks at 1726 cm-1 which corresponds to the C=O stretching vibrations of the COOCH3 group. A characteristic peak at 1600 cm-1 resulting from the C=C alkene bond was also observed. Peaks present at 1560 cm-1 and 1530 cm-1 were characteristic of the enaminone system N-C=C-C=O. Furthermore, peak due to N-H stretching vibration was observed at 3237 cm-1. These characteristic peaks were also observed in the samples containing binary 1:1 physical mixtures of E122 with starch, lactose and HPMC respectively, which further confirms full compatibility between E122 and the selected excipients. From FT-IT spectra obtained for binary 1:1 blend of E 122 and selected excipients, it is also clear that the curves of the blend indicate the sum of the characteristic peaks of individual components, which is in agreement with the thermal analysis finding that no physical or chemical interactions is taking place between E 122 and the selected excipients at room temperature.
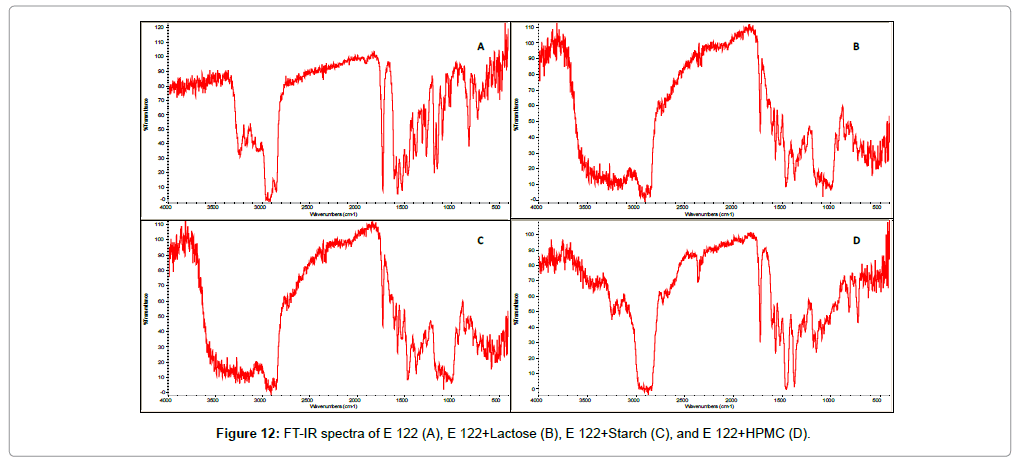
Figure 12: FT-IR spectra of E 122 (A), E 122+Lactose (B), E 122+Starch (C), and E 122+HPMC (D).
Isothermal stress testing studies
The stability of E 122 and its 1:1 dry powder mixture with selected excipients was evaluated at 60°C for 2 weeks using a UV-Vis spectroscopy. Table 1 shows % drug remaining at the end of the 2-week study at 60°C. In the isothermal stress testing, drug-excipient binary mixtures showed no discoloration or degradation at room temperature or refrigerated temperature. No significant drug degradation was observed with any of the excipient mixtures.
| Sample |
% Drug remaining |
Change in physical appearance |
| Control sample |
Stressed conditions |
| E 122 |
101.24 |
98.00 |
None |
| E 122+Corn starch |
100.45 |
102.23 |
None |
| E 122+Lactose |
103.20 |
98.10 |
None |
| E 122+HPMC |
103.67 |
99.18 |
None |
| E 122+MCC |
102.20 |
99.98 |
None |
Table 1: UV analysis results under Isothermal stress testing after 2 weeks of storage.
Conclusions
Compatibility study has now become an essential step in preformulation stage. Thermal analysis especially DSC is proven to be a useful tool in rapid screening of drug excipients interaction and decomposition studies. The compatibility and stability of E 122 with different excipients were studied by thermal analysis, FT-IR spectroscopy, and isothermal stress testing methods. The DSC results demonstrated the suitability of enaminone compound E122 with various excipients such as corn starch, lactose, microcrystalline cellulose and hydroxyl propyl methyl cellulose. Additional studies using FT-IR confirmed compatibility between E 122 and the selected excipients. Results of IST confirmed that there is no interaction between the E 122 and the selected excipients and E 122 is stable in binary blends with selected excipients for 2 weeks under stressed conditions. These results will aid in the preparation of stable solid dosage formulations of E 122 with the excipients such as corn starch, lactose, microcrystalline cellulose and hydroxyl propyl methyl cellulose. In conclusion, DSC, FTIR, and IST studies were successfully used to determine compatibility and stability of a novel anticonvulsant E 122 enaminone compound with common tableting excipients.
Acknowledgments
The authors thank Dr. Edafiogho for providing the pure sample of E122 compound, the University of Saint Joseph (USJ) for its financial support through a Faculty Mini-Grant and the Department of Chemistry at USJ for the use of the FT-IR instrument.
18869
References
- Löscher W (2017) Animal Models of Seizures and Epilepsy: Past, Present, and Future Role for the Discovery of Antiseizure Drugs. Neurochemical Research,pp: 1-16.
- Santulli L, Coppola A, Balestrini S, Striano S (2016) The challenges of treating epilepsy with 25 antiepileptic drugs. Pharmacol Res 107:211-219.
- Ramaratnam S, Panebianco M, Marson AG (2016) Lamotrigine add-on for drug-resistant partial epilepsy. Cochrane Database Syst Rev 6:CD001909.
- Nicita F, Spalice A, Raucci U, Iannetti P, Parisi P (2016) The possible use of the L-type calcium channel antagonist verapamil in drug-resistant epilepsy. Expert Rev Neurother 16:9-15.
- Narayanan J, Frech R, Walters S, Patel V, Frigerio R, et al. (2016) Low dose verapamil as an adjunct therapy for medically refractory epilepsy–An open label pilot study. Epilepsy research 126: 197-200.
- Giussani G, Canelli V, Bianchi E, Erba G, Franchi C, et al. (2016) Longâ€ÂÂÂÃÂterm prognosis of epilepsy, prognostic patterns and drug resistance: a populationâ€ÂÂÂÃÂbased study. European journal of neurology 23: 1218-1227.
- Manna I, Gambardella A, Labate A, Mumoli L, Ferlazzo E, et al. (2015) Polymorphism of the multidrug resistance 1 gene MDR1/ABCB1 C3435T and response to antiepileptic drug treatment in temporal lobe epilepsy.Seizure24: 124-126.
- Galindo-Mendez B, Mayor LC, Velandia-Hurtado F, Calderon-Ospina C (2015) Failure of antiepileptic drugs in controlling seizures in epilepsy: What do we do next? Epilepsy Behav Case Rep 4:6-8.
- Espinosa-Jovel CA, Sobrino-Mejia FE (2015) Drug resistant epilepsy. Clinical and neurobiological concepts. Rev Neurol 61:159-166.
- Doeser A, Dickhof G, Reitze M, Uebachs M, Schaub C, et al. (2014) Targeting pharmacoresistant epilepsy and epileptogenesis with a dual-purpose antiepileptic drug. Brain awu pp339.
- Edafiogho IO, Kombian SB, Ananthalakshmi KV, Salama NN, Eddington ND, et al. (2007) Enaminones: Exploring additional therapeutic activities. Journal of pharmaceutical sciences 96: 2509-2531.
- Edafiogho IO, Hinko CN, Chang H, Moore JA, Mulzac D, et al. (1992) Synthesis and anticonvulsant activity of enaminones. J Med Chem 35:2798-2805.
- Eddington ND, Cox DS, Roberts RR, Butcher RJ, Edafiogho IO, et al. (2002) Synthesis and anticonvulsant activity of enaminones.: 4. Investigations on isoxazole derivatives. Eur J Med Chem 37:635-648.
- Eddington ND, Cox DS, Roberts RR, Stables JP, Powell CB, et al. (2000) Enaminones-versatile therapeutic pharmacophores. Further advances. Current medicinal chemistry 7: 417-436.
- Edafiogho IO, Ananthalakshmi KV, Kombian SB (2006) Anticonvulsant evaluation and mechanism of action of benzylamino enaminones. Bioorg Med Chem 14:5266-5272.
- Scott KR, Edafiogho IO, Richardson EL, Farrar VA, Moore JA, et al. (1993) Synthesis and anticonvulsant activity of enaminones. 2. Further structure-activity correlations. J Med Chem 36:1947-1955.
- Huang LF, Tong WQ (2004) Impact of solid state properties on developability assessment of drug candidates. Adv Drug Deliv Rev 56:321-334.
- Gu L, Strickley RG, Chi LH, Chowhan ZT (1990) Drug-excipient incompatibility studies of the dipeptide angiotensin-converting enzyme inhibitor, moexipril hydrochloride: dry powder vs wet granulation. Pharm Res 7:379-383.
- Jackson K, Young D, Pant S (2000) Drug-excipient interactions and their effect on absorption. Pharm Sci Technolo Today 3:336-345.
- Mazurek-Wadolkowska E, Winnicka K, Czajkowska-Kosnik A, Czyzewska U, Miltyk W (2013) Application of differential scanning calorimetry in evaluation of solid state interactions in tablets containing acetaminophen. Acta Pol Pharm 70:787-793.
- Campanella L, Magri AL, Tomassetti M, Rossi V, Vecchio S (2007) Quantitative determination of acetaminophen in pharmaceutical formulations using differential scanning calorimetry. Comparison with spectrophotometric method. Drug Dev Ind Pharm 33:830-840.
- Mora PC, Cirri M, Mura P (2006) Differential scanning calorimetry as a screening technique in compatibility studies of DHEA extended release formulations. J Pharm Biomed Anal 42:3-10.
- McDaid FM, Barker SA, Fitzpatrick S, Petts CR, Craig DQ (2003) Further investigations into the use of high sensitivity differential scanning calorimetry as a means of predicting drug-excipient interactions. Int J Pharm 252:235-240.
- Fathy M, Hassan MA, Mohamed FA (2002) Differential scanning calorimetry to investigate the compatibility of ciprofloxacin hydrochloride with excipients. Pharmazie 57:825-828.
- Verma RK, Garg S (2005) Selection of excipients for extended release formulations of glipizide through drug-excipient compatibility testing. J Pharm Biomed Anal 38:633-644.
- Pani NR, Nath LK, Acharya S (2011) Compatibility studies of nateglinide with excipients in immediate release tablets. Acta Pharm 61:237-247.
- Tita B, Fulias A, Bandur G, Marian E, Tita D (2011) Compatibility study between ketoprofen and pharmaceutical excipients used in solid dosage forms. J Pharm Biomed Anal 56:221-227.
- Gombas A, Antal I, Szabo-Revesz P, Marton S, Eros I (2003) Quantitative determination of crystallinity of alpha-lactose monohydrate by Near Infrared Spectroscopy (NIRS). Int J Pharm 256:25-32.


