Keywords
Tumor markers, Carbohydrate antigen 19-9, Alpha-fetoprotein, Carcinoembryonic antigen, Carbohydrate antigen 125, Immunoassay.
Introduction
Tumor markers are substances that are produced by cancer or other cells of the body in response to cancer or certain benign (non-cancerous) conditions. Such substances are found in cells, tissues, or body fluids and can be measured qualitatively or quantitatively by chemical, immunological, or molecular biological methods [1]. For many malignancies, the determination of serum tumor markers plays an important role in clinical diagnosis and prognosis. Currently, tumor markers are widely used in conjunction with radiology and histopathology to determine the type and course of therapy and to differentiate between remission and progression. Tumor markers can also provide important information regarding recurrences and metastases at an early phase in disease progression.
Carcino embryonic antigen (CEA) is a highly glycosylated cell surface glycoprotein with a molecular weight of 150-300 kDa, and is normally produced in gastrointestinal tissue during fetal development, but its production stops before birth. Levels of CEA become elevated when inflammation or tumors arise in any endodermal tissue, including that of the gastrointestinal tract, respiratory tract, pancreas, and breast [1]. CEA measurement is mainly used to monitor colorectal carcinoma treatment, to identify recurrences after surgical resection, for staging or to localize cancer spread through measurement of biological fluids [2]. Alpha-fetoprotein (AFP) is a glycoprotein with a molecular mass of 70 kDa, which is synthesized in large quantities during embryonic development of the fetal yolk sac and liver, and it can be used as a marker for hepatocellular or germ cell (non-seminoma) carcinoma, except in pregnant individuals [3]. The carbohydrate antigen 125 (CA 125) is a glycoprotein with about a 200 kDa molecular weight and is the most frequently used biomarker for ovarian cancer detection [4]. Around 90% of women with advanced ovarian cancer have elevated levels of CA-125 in their blood serum, making CA-125 a useful tool for detecting ovarian cancer after the onset of symptoms [5]. Carbohydrate antigen 19-9 (CA 19-9) is a marker for both colorectal and pancreatic carcinoma, and is used in monitoring patients with these cancers during palliative chemotherapy in conjunction with imaging tests [6].
As most tumor markers are used to monitor treatment responses and recurrences of cancers, therefore more sensitive, specific and reproducible detection methods would be helpful for managing patients with cancers. However, despite the ongoing standardization efforts, it is seen that the concentration of a tumor marker in a given specimen, determined with assays from different manufacturers, can vary due to differences in assay methods, types of antibodies and epitopes used, and reagent specificity. Due to these reasons, when determining the concentration of tumor markers, quality requirements must be fulfilled, and the method of determination must be reported with the results. If the method of determination needs to be changed, it is recommended to perform simultaneous determination, using both methods [7].
With the increasing incidence and prevalence of cancers, the workload on tumor marker assays in clinical laboratories has also increased. HISCL-5000 (Sysmex Corporation; Japan) immunoassay analyzer is a fully automated system that can handle a large volume of various test parameters with high throughput. HISCL-5000 immunoassay system employs the chemiluminescent enzyme immunoassay (CLEIA) detection technology, has a short detection time of only 17 min. for all the test parameters and requires a volume of only 30μL for samples. In the present study, four tumor markers (AFP, CEA, CA 125, and CA 19-9) chemiluminescence immunoassays on HISCL-5000 were evaluated for detection limit, dilution linearity, imprecision and clinical specimens’ results were correlated with ARCHITECT i2000SR ( Abbott; USA) chemiluminescent immunoassay analyzer for interassay comparability.
Materials and Method
The evaluation was conducted in Immunology section of Department of Lab Medicine at Manila Doctors Hospital (MDH), Manila, Philippines. The institutions’ review board approved all studies using human samples. The analytical performance of Sysmex immunoassay analyzer HISCL-5000 was evaluated using Sysmex reagents/controls/calibrators and consisted of limit of detection (LOD), dilution linearity, imprecision for all four tumor markers (CEA, AFP, CA19-9 & CA 125). Method comparison for all four tumor markers (CEA, AFP, and CA19-9 & CA 125) was performed with the laboratory’s current immunoassay analyzer ARCHITECT i2000SR. All assays were performed according to manufacturers’ instructions.
Performance Evaluation
Limit of detection (LOD) of the assays
To verify the LOD of the analytical method at the claimed cutoff by manufacturer, known residual patient serum were used after being serially diluted with HISCL® diluent to achieve near zero tumor marker value and then, each dilution was analysed in duplicate in 10 runs to obtain mean and two standard deviation (2SD).
Linearity of the assays
Dilution Linearity of the analytical method was verified at the manufacturers’ claimed range, by using known residual patient serum. The upper limits chosen were based on the analytic measurement range stated in each assay’s package insert. HISCL® diluent was used to do serial dilution (1:1 to 1:32), and each dilution was analyzed in duplicate for their respective markers and the mean values were compared with the expected values using regression analyses. Dilution linearity was tested for each tumor marker in low, medium and high concentration range.
Imprecision
Imprecision studies were performed by using Sysmex quality control material Sero-trol (Sysmex Corp., Japan). Two concentration levels of HISCL Sero-trol control 1 & 2 were reconstituted according to the manufacturer’s package insert instructions. Within-run reproducibility was performed by duplicate measurements of control materials for 20 consecutive runs. Between-day reproducibility was performed by duplicate measurements of control materials for ten (10) consecutive working days.
Method Comparison
Method comparison was conducted using 236 left-over routine patient samples analyzed for the purpose of the standard diagnostic or prognostic work-up in the hospital. 102 sera samples for CEA, 87 sera samples for AFP, 118 sera samples for CA19-9 and 149 sera samples for CA 125 were analyzed. The samples were included after receiving patient‘s consent as per the hospital policy. Patients’ residual serum samples were collected in the period of Sept 2014 to Feb 2015 and prepared according to laboratory procedures. All the samples were divided into two aliquots immediately after centrifugation and were analyzed on HISCL-5000 and ARCHITECT i2000SR analyzers simultaneously.
Statistical analysis
Data was analysed using MedCalc® Statistical Software Version 15.8 (MedCalc software; Belgium) and was expressed as Mean, Standard Deviation (SD) and Coefficient of Variation (CV) for each test parameter. The measured values of patient serum samples which did not fall into the manufacturer’s claimed analytic measurement range were excluded during inter-assay comparative data analysis. Passing-Bablok and linear regression analysis was performed to determine the analytical relationship (correlation) between the HISCL-5000 analyzer and the ARCHITECT i2000SR analyzer as the reference analyzer.
Results
Limit of detection
The limit of detection (LOD) for each assay was calculated and compared with the manufacturers’ claimed values. The AFP showed an average limit of detection of 0.1ng/mL with a manufacturer’s claim of 0.1ng/mL; the CEA showed an average limit of detection of 0.29 ng/mL with a manufacturer’s claim of 0.4 ng/mL; the CA 19-9 showed an average limit of detection of 0.12U/mL with a manufacturer’s claim of 0.5U/mL; the CA 125 showed an average limit of detection of 0.37 U/mL with a manufacturer’s claim of 1.0 U/ml. For all tumor markers, the detection limit measured was lower than the manufacturer’s claim.
Linearity of the assays
Linearity of the four tumor markers was evaluated at 3 different levels (low, medium and high) of concentrations of serum samples. The concentrations measured ranged from 2500 to 1.7ng/ml for AFP, from 923.4 to 5.55 ng/ml for CEA, from 732.7 to 1.0 U/ml for CA19-9 and from 931.2 to 0.7 U/ml for CA-125. The results from HISCL-5000 showed excellent linear responses in measuring the concentrations of the four tumor markers (Figure 1).
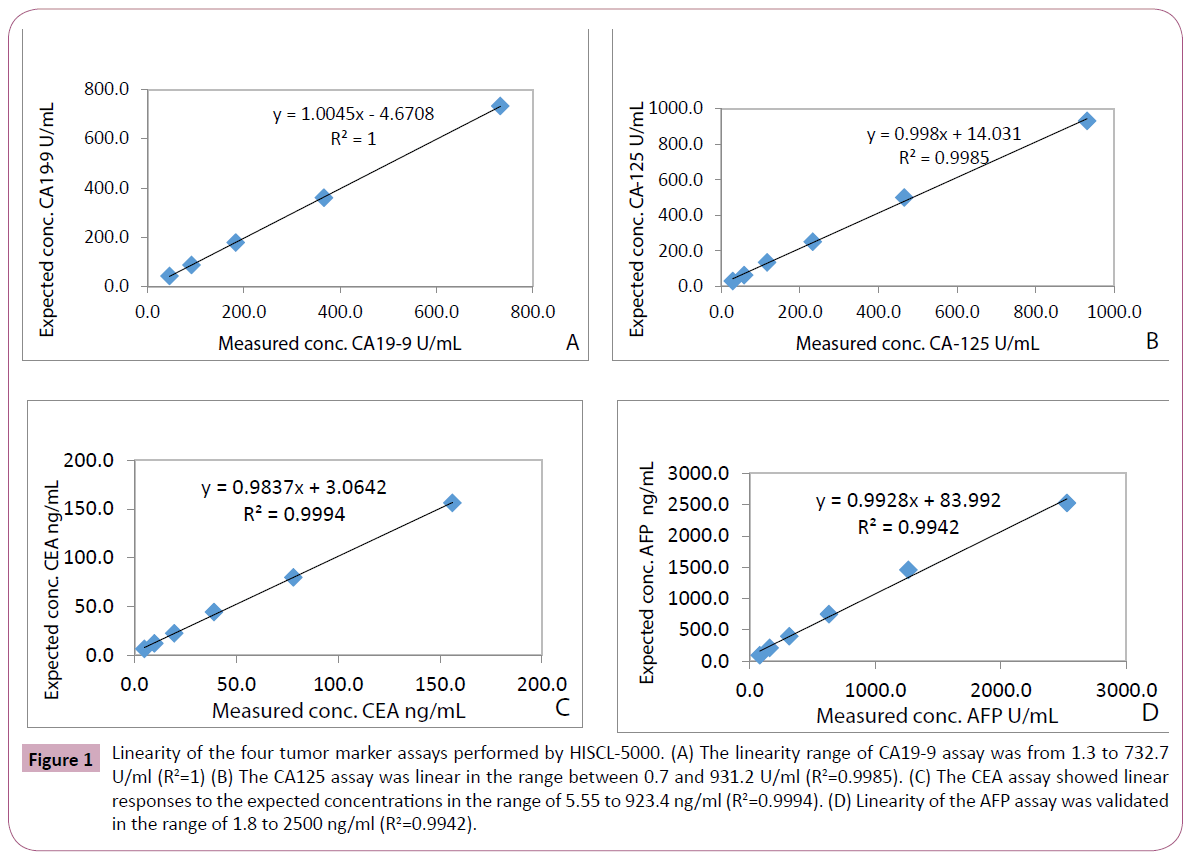
Figure 1: Linearity of the four tumor marker assays performed by HISCL-5000. (A) The linearity range of CA19-9 assay was from 1.3 to 732.7 U/ml (R2=1) (B) The CA125 assay was linear in the range between 0.7 and 931.2 U/ml (R2=0.9985). (C) The CEA assay showed linear responses to the expected concentrations in the range of 5.55 to 923.4 ng/ml (R2=0.9994). (D) Linearity of the AFP assay was validated in the range of 1.8 to 2500 ng/ml (R2=0.9942).
Precision performances
Within run imprecision of four tumor markers ranged from 2.3% to 5.6% coefficient of variation (CV) for Sero-trol level 1 and 3.1% to 4.8% CV for Sero-trol level 2 (Table 1). Between run imprecision ranged from 2.5% to 3.7% CV for Sero-trol level 1 and 2.0% to 2.9 % CV for Sero-trol level 2 (Table 1).
| Tumor marker |
Mean conc. |
Within run CV% |
Between day CV% |
| AFP(ng/mL) |
| Sero-trol 1 |
79.6 |
3.3 |
2.5 |
| Sero-trol 2 |
10.2 |
4.8 |
2.8 |
| CEA(ng/mL) |
| Sero-trol 1 |
15.8 |
2.3 |
3.5 |
| Sero-trol 2 |
5.5 |
4.6 |
2.0 |
| CA19-9(U/mL) |
| Sero-trol 1 |
44.7 |
3.6 |
3.4 |
| Sero-trol 2 |
12.2 |
3.4 |
2.9 |
| CA125(U/mL) |
| Sero-trol 1 |
215.1 |
5.6 |
3.7 |
| Sero-trol 2 |
73.1 |
3.1 |
2.2 |
Table 1: Summary of Imprecision data.
Comparison between the assays
Results from method comparison revealed acceptable agreement when compared with the ARCHITECT i2000SR (Figures 2-5). Passing-Bablok slopes ranged from 0.95 to 1.14 with correlation coefficients ranging from 0.57 to 0.99. An average of the results from the original and repeated run was used in the final method comparison analysis.
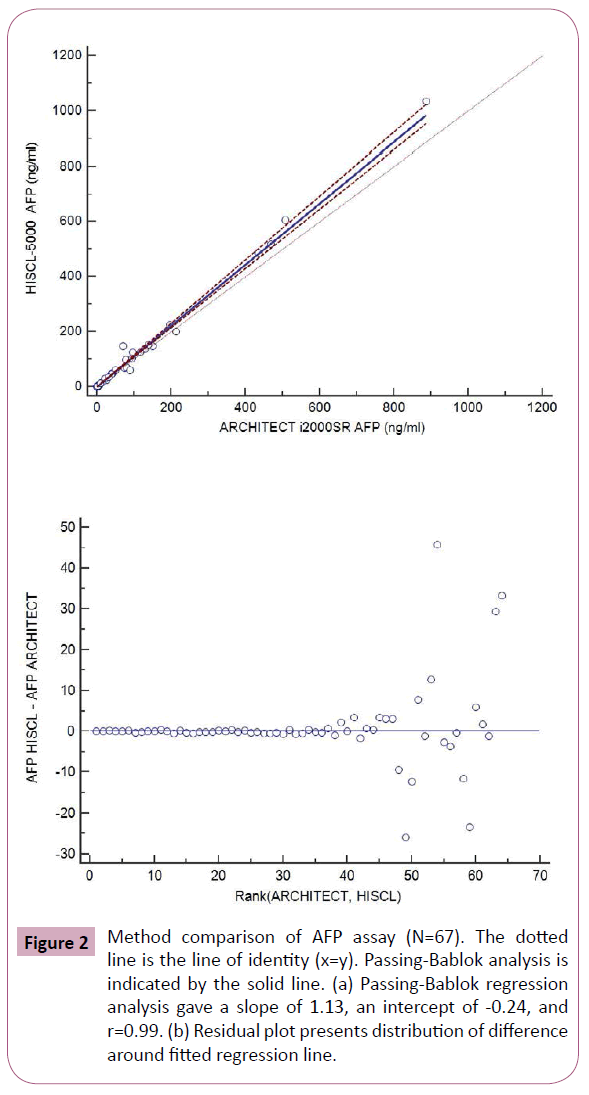
Figure 2: Method comparison of AFP assay (N=67). The dotted line is the line of identity (x=y). Passing-Bablok analysis is indicated by the solid line. (a) Passing-Bablok regression analysis gave a slope of 1.13, an intercept of -0.24, and r=0.99. (b) Residual plot presents distribution of difference around fitted regression line.
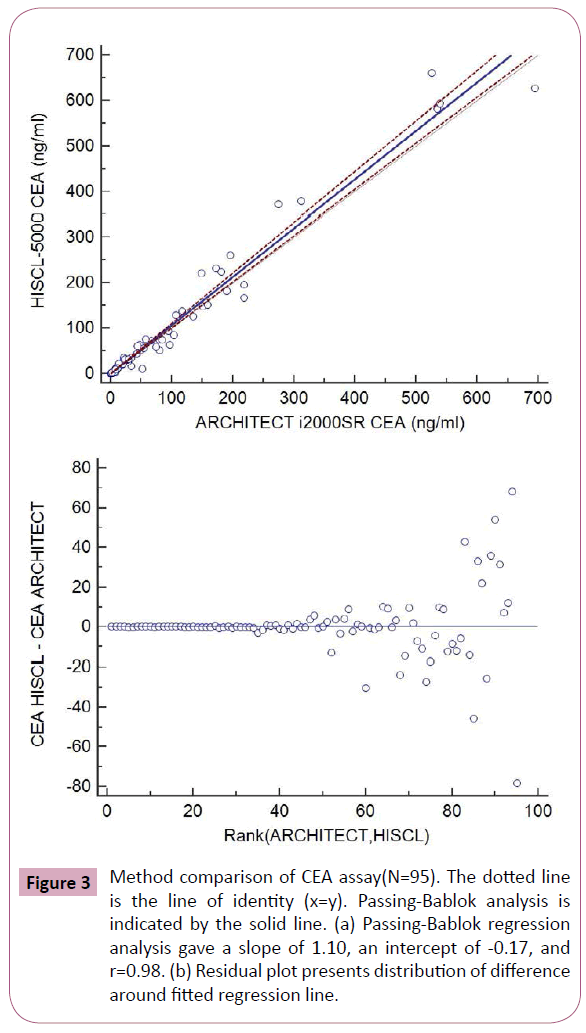
Figure 3: Method comparison of CEA assay(N=95). The dotted line is the line of identity (x=y). Passing-Bablok analysis is indicated by the solid line. (a) Passing-Bablok regression analysis gave a slope of 1.10, an intercept of -0.17, and r=0.98. (b) Residual plot presents distribution of difference around fitted regression line.
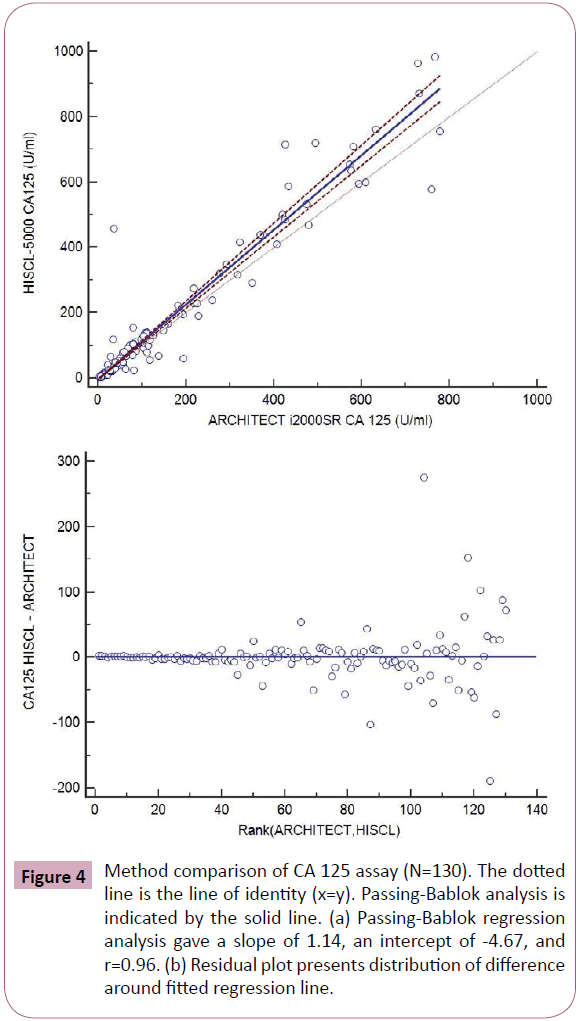
Figure 4: Method comparison of CA 125 assay (N=130). The dotted line is the line of identity (x=y). Passing-Bablok analysis is indicated by the solid line. (a) Passing-Bablok regression analysis gave a slope of 1.14, an intercept of -4.67, and r=0.96. (b) Residual plot presents distribution of difference around fitted regression line.
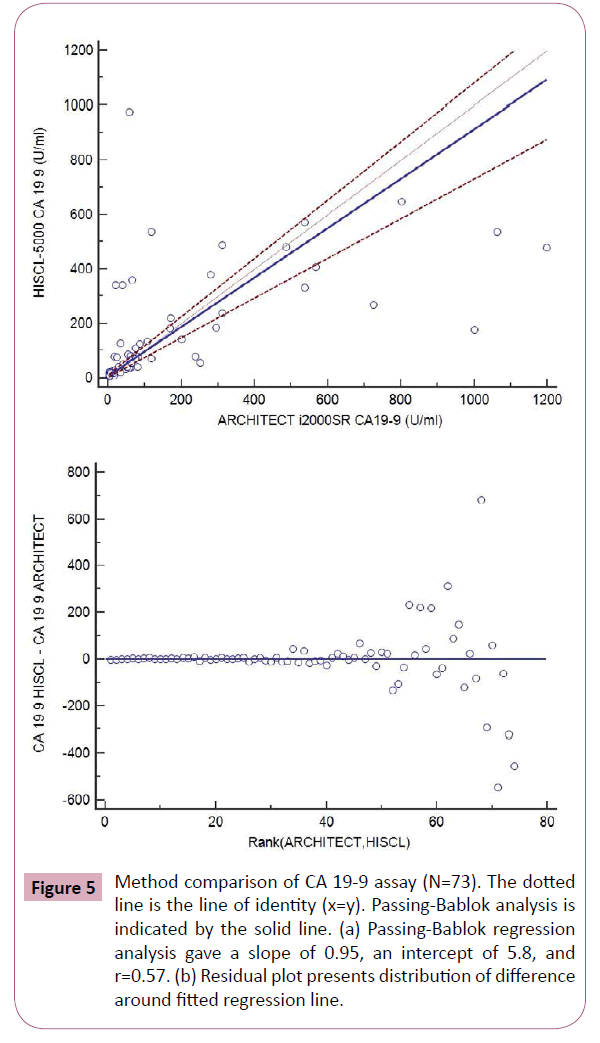
Figure 5: Method comparison of CA 19-9 assay (N=73). The dotted line is the line of identity (x=y). Passing-Bablok analysis is indicated by the solid line. (a) Passing-Bablok regression analysis gave a slope of 0.95, an intercept of 5.8, and r=0.57. (b) Residual plot presents distribution of difference around fitted regression line.
Discussion
The aim of the study was to assess the analytical performance of HISCL-5000 immunoassay analyzer in measuring tumor marker concentrations and to perform inter-assay comparability with ARCHITECT i2000SR immunoassay analyzer. The detection limit of all 4 tumor marker assays on HISCL-5000 was found to be lower than the manufacturers’ claimed limit. All four tumor marker assays showed linear recovery as evidenced by the slope and intercept values. The imprecision results of all the assays on HISCL-5000 were highly acceptable, with most of the CVs less than 5.6%.
In addition, we compared the results from HISCL-5000 for CEA, AFP, CA19-9 and CA 125 with those measured by ARCHITECT i2000SR. The results of AFP and CEA measured by HISCL-5000 and ARCHITECT i2000SR were well correlated according to their correlation coefficients and the values were comparable with relatively small mean differences (Figures 2 and 3). WHO international standards for CEA and AFP have been made available (CEA-IRP 73/601; AFP IRP 72/225) [8,9] which ensure standardization and accurate calibration. Hence different methods by different manufacturers’ which are calibrated to these international standards do show good correlation. Although the results of CA125 were well correlated according to their correlation coefficients, they showed relatively larger mean differences (Figure 4). The large differences observed between methods for some individual patient samples, which are best seen in Figure 4, could be because of the use of different antibodies or unique components of these patient samples. A previous report that examined 7 CA 125 immunoassays found slopes from regression analysis that ranged between 0.87 and 1.19 [10]. Our results were in agreement with this study results.
Tumor marker CA 19-9 measured by HISCL-5000 and Architect i2000SR in this study showed relatively lower correlation coefficient among the results between the two analyzers. The concordance between assay systems can vary according to the evaluated tumor markers and researchers [10-12]. Different antibodies recognize different parts of the molecule, and heterogeneity or conformational alteration of the antigens may explain inter-method differences, in part. Considering the number of studied samples is very small to make any strong conclusions, this limitation should be taken into consideration when interpreting our results. Another limitation of the study is lack of background information for the patients.
Therefore, even though the results, on average, agreed fairly well across the assays, when replacing tumor marker assays for clinical use, parallel tests by old and new methods are recommended to establish a new baseline in the management of patients. These days, the incidence and prevalence of tumors are increasing due to advances in the technology of cancer detection and longer average life expectancies. Accordingly, the number of specimens for tumor marker testing has increased. Hence, faster results derived using the HISCL-5000, which can analyze a tumor marker test parameter within 17 minutes and have throughput of 200 samples per hour can be of immense benefit to laboratories.
Conclusion
Our study demonstrated that the HISCL-5000 analyzer has good analytical performance for the tested four tumor markers. In spite of efforts to harmonize the results from different analyzers developed by different manufacturers, discrepant results still remain among analytical methods. These differences may result from the application of different antibodies by different assays and suppliers. Additional efforts to standardize tumor marker assays are greatly necessitated, and the establishment of reliable reference materials and methods are also needed. The substantial differences between methods also indicate that the redetermination of baselines and cut-off levels is necessary when replacing analyzers and methods for measuring tumor marker assays.
7330
References
- Burtis CA, Ashwood ER, Bruns DE (2013) Tietz Textbook of Clinical Chemistry and Molecular Diagnostics (5th edn). St. Louis: Elsevier saunders.
- Duffy, Michael J (2001) Carcinoembryonic Antigen as a Marker for Colorectal Cancer: Is It Clinically Useful? Clinical Chemistry 47: 624-630.
- Toyoda H, Kumada T, Kiriyama S, Sone Y, Tanikawa M, et al. (2006) Prognostic significance of simultaneous measurement of three tumor markers in patients with hepatocellular carcinoma. Clin Gastroenterol Hepatol 4:111-117.
- Suh KS, Park SW, Castro A, Patel H, Blake P,et al. (2010)Ovarian cancer biomarkers for molecular biosensors and translational medicine. Expert Rev of Mol Diagn 10: 1069-1083.
- Gupta D, Lis CG (2010) Pretreatment serum albumin as a predictor of cancer survival: a systematic review of the epidemiological literature. Nutr J 9: 69.
- Connor S, Bosonnet L, Alexakis N, Raraty M, Ghaneh P, et al (2005) Serum CA19-9 measurement increases the effectiveness of staging laparoscopy in patients with suspected pancreatic malignancy. Dig Surg 22:80-85.
- Westgard QC (2015) The comparison of method experiment. Available: https://www.westgard.com/lesson23.htm. Acessed: Sept 18th 2015.
- Christiansen M, Hogdall CK, Andersen JR, Norgaard-Pedersen B (2001) Alpha-fetoprotein in plasma and serum of healthy adults: preanalytical, analytical and biological sources of variation and construction of age-dependent reference intervals. Scand J Clin Lab Invest 61:205-215.
- Thomas L (1998) Clinical Laboratory Diagnostics (10th edn) Frankfurt/Main: TH-Books Verkagsgesellschaft mbH; p 936-94.
- Mongia SK, Rawlins ML, Owen WE, Roberts WL (2006) Performance characteristics of seven automated CA 125 assays. Am J Clin Pathol 125:921-927.
- Hotakainen K, Tanner P, Henrik A, Haglund C, Stenman UH (2009) Comparison of three immunoassays for CA19-9. Clin Chim Acta 400:123-127.
- Deinzer M, Faissner R, Metzger T, Kaminski WE, Löhr M, et al. (2010) Comparison of two different methods for CA19-9 antigen determination. Clin Lab 56:319-325.