Keywords
Mitral annular calcification; Tp-e interval; Tpe/ QT ratio.
Introduction
Mitral annular calcification (MAC) is the fibrous, degenerative calcification of the annular ring that supports the mitral valve [1]. Its prevalence increases with ageing. It has previously been reported that patients with MAC have a higher prevalence of coronary artery disease, arrhythmias, aortic valve calcification, and cerebrovascular diseases [2-4]. MAC and atherosclerosis have similar risk factors including old age, hypertension, diabetes, and obesity; it is hypothesized that the presence of MAC reflects the duration and intensity of exposure to these risk factors [5]. Myocardial repolarization abnormalities are correlated with ventricular arrhythmias and high cardiovascular mortality. Myocardial repolarization is calculated using superficial electrocardiography (ECG) based on QT dispersion (QTd) and corrected QT dispersion (cQTd). In recent years, it was suggested that the interval between the peak and endpoint of the T wave (Tp-e) could be used as a marker of dispersion of total repolarization. Indeed, it was found to be a significant predictor of increased mortality due to ventricular arrhythmia and cardiovascular factors [6]. Thus, the Tp-e/QT ratio was used as a new index to assess ventricular repolarization that is not affected by heart rate variability, rendering it more reliable than the QT interval, QTd, or Tp-e interval [7]. In this study, we aimed to analyze ventricular repolarization dispersion (VRD) using new indices, the Tp-e interval and Tp-e/QT ratio, calculated on 12-lead superficial ECG in patients with MAC.
Materials and Methods
Study design
This prospective cross-sectional study performed, after the study protocol had been approved by institutional ethics committee. The principles of the Declaration of Helsinki were followed throughout the study, and informed consent was obtained from all participants.
Study population
Fifty consecutive patients with MAC admitted to our clinic for routine follow-up and 50 volunteers without MAC were included in this study. Patients with heart failure, moderate or severe valve disease, primary cardiomyopathy, obesity, hypertension, anemia, renal failure, chronic lung disease, thyroid dysfunction, electrolyte imbalance, bundle branch block, or atrioventricular conduction abnormalities on ECG were excluded. Any ECGs without clearly measurable Tp-e or QT intervals were also excluded from the study. All patients were in sinus rhythm, and none were on medications that could affect the QT or Tp-e interval, including antibiotics, antiarrhythmics, tricyclic antidepressants, antihistamines, or antipsychotics.
Study protocol
Age, sex, and other cardiac risk factors were recorded in all patients. Hypertension was defined as an arterial blood pressure of >140/90 mmHg measured on three separate occasions during different weeks, or the use of antihypertensive medications for at least 3 months. The patients’ heart rate and body mass index (BMI; kg/m2) were calculated. Fasting blood glucose, creatinine, blood urea nitrogen, total cholesterol, high-density lipoprotein (HDL) cholesterol, lowdensity lipoprotein (LDL) cholesterol, and triglyceride levels were measured.
Diabetes mellitus was defined as patients on antidiabetic agents or with fasting plasma glucose levels >126 mg/dL. Coronary artery disease (CAD) was defined as the presence of an angiographic lesion occupying ≥ 50% of the coronary artery, a history of coronary bypass surgery, or percutaneous coronary intervention.
All echocardiographic examinations (IE-33, Philips Medical Systems, Bothell, WA, USA) were performed by cardiologists blinded to the experimental design and patient histories. Measurements were performed according to the criteria of the American Society of Echocardiography [8], and three consecutive cycles were averaged for each parameter. Standard parasternal long-axis and apical 4-chamber, 2- chamber, and 5-chamber images were obtained. M-mode, 2-D, Doppler (color flow, PW Doppler (PWD)), and tissue Doppler echocardiography images and measurements were evaluated. Left atrial (LA) diameter, end systolic and end diastolic dimensions were measured from parasternal long-axis view. Ejection fraction was calculated by using modified Simpson method. Mitral early diastolic velocity (E), mitral late diastolic velocity (A) the doppler image isovolumetric relaxation and contraction times (IVRT and IVCT, respectively) and deceleration time (dT) were recorded from the apical transducer position of the sample volume situated between the mitral leaflet tips, and the ratio of E to A (E/A ratio) was calculated. Myocardial early diastolic velocity (Em) and myocardial late diastolic velocity (Am) wave velocities were measured with the sample volume using PWD from the mitral lateral annulus.
Diastolic dysfunction was classified by mitral inflow pattern according to guidelines [9], normal diastolic function was considered a lateral E/Em ratio of less than 10. Mild diastolic dysfunction was defined as a lateral E/Em ratio of greater than 10, an E/A ratio of less than 0.8 and a DT of greater than 200 ms; moderate diastolic dysfunction was characterized by a lateral E/Em ratio of greater than 10, an E/A ratio of between 0.8 and 1.5, and DT of between 160 ms and 200 ms; and severe diastolic dysfunction was defined as a lateral E/Em ratio of greater than 10, an E/A ratio of greater than 2 and DT of less than 160 ms.
MAC was defined as an intense echocardiographic producing structure, >3 mm in width, with highly reflective characteristics that was located at the junction of the atrioventricular groove and the posterior or anterior mitral leaflet on the parasternal long-axis, apical 4-chamber or 2- chamber, parasternal short-axis view [10].
The 12-lead ECG was performed at a paper speed of 50 mm/s with the subject at rest in the supine position. Resting heart rate was then measured from the ECG data. The QT and Tp-e intervals were calculated from ECG data manually by two cardiologists using calipers and a magnifying glass to decrease measurement errors. Subjects with U waves, negative, and biphasic T wave on their ECGs were excluded from the study. The average value from three examinations was calculated for each lead. The QT interval was measured from the beginning of the QRS complex to the end of the T wave and was corrected for heart rate using the Bazett formula. The QTd was defined as the difference between the maximum (QTmax) and minimum QT (QTmin) intervals of the 12 leads. The difference between the corrected QTmax and corrected QTmin (cQTmin) was defined as the cQTd [11].
Measurement of the Tp-e interval was performed from the precordial leads [12]. The Tp-e interval was defined as the interval from the peak to the end of the T wave and was corrected for heart rate (cTp-e). Tp-e/QT and corrected Tpe/ QT (cTp-e/QT) ratios were then calculated from these values. The interobserver and intraobserver variation coefficients for the Tp-e/QT ratio were 2.8% and 3.1%, respectively, and those for the cTp-e/QT ratio were 3.1% and 3.0% respectively.
Statistical analysis
All statistical analyses were performed using the SPSS 22.0 statistical program (SPSS Inc., Chicago, IL, USA). Continuous variables were presented as means ± standard deviation, and categorical variables were presented as numbers and percentages. Normal distribution was determined using the Shapiro-Wilk test. The groups were compared using the t-test and chi-square test with Yates’ correction in independent samples. Pearson’s correlation coefficients were used to assess the association among continuous variables. A p-value< 0.05 was considered to indicate statistical significance.
Results
The demographic characteristics of the participants are shown in Table 1. There were no significant differences between the patients and controls in terms of age, sex, smoking status, BMI, systolic or diastolic blood pressures, or fasting blood glucose, hemoglobin, creatinine, total cholesterol, LDL, HDL, or triglyceride levels. Moreover, the incidence of CAD was higher in the MAC group (p=0.833).
| Variables |
MAC group (n=50) |
Control group (n=50) |
P value |
| Age (years) |
71.6 ± 8.1 |
69.3 ± 6.2 |
0.180 |
| Gender |
| Male |
23 (46%) |
24 (48%) |
0.841 |
| Female |
27 (54%) |
26 (52%) |
| Coronary artery disease n (%) |
18 (36%) |
16 (%32) |
0.833 |
| Body mass index (kg/m2) |
27.9 ± 2.7 |
27.9 ± 3.3 |
0.392 |
| Smoking, n (%) |
8(%16) |
10 (%20) |
0.795 |
| Systolic BP (mmHg) |
125.2 ± 10.8 |
124.1 ± 8.4 |
0.587 |
| Diastolic BP (mmHg) |
72.2 ± 7.0 |
72.4 ± 6.7 |
0.896 |
| Hemoglobin (g/dl) |
13.4 ± 1.3 |
13.7 ± 1.3 |
0.192 |
| Fasting glucose (mg/dl) |
99.2 ± 9.6 |
95.4 ± 13.3 |
0.105 |
| Creatinine (mg/dl) |
0.68 ± 0.31 |
0.72 ± 0.32 |
0.520 |
| Total cholesterol (mg/dl) |
206.1 ± 35.4 |
206.7 ± 38.8 |
0.942 |
| HDL cholesterol (mg/dl) |
37.5 ± 9.7 |
40.8 ± 8.2 |
0.070 |
| LDL cholesterol (mg/dl) |
119.8 ± 25.9 |
128.0 ± 33.0 |
0.167 |
BP: Blood Pressure; HDL: High-Density Lipoprotein; LDL: Low-Density Lipoprotein; MAC: Mitral Annular Calcification.
Table 1: Clinical characteristics and laboratory findings of the study population.
Comparisons of the standard 2D and Doppler echocardiographic measurements are shown in Table 2. There were no significant differences between the groups with regard to left ventricular (LV) end-diastolic diameter, LV endsystolic diameter, interventricular septum thickness, posterior wall thickness, aortic root, or ejection fraction. The LA diameter was significantly greater in patients with MAC compared with the controls (p< 0.001). Moreover, E (p< 0.001) and the E/A ratio (p< 0.001) were smaller, whereas Am (p=0.029) was greater, in patients with MAC compared with the controls.
| Variables |
MAC group
(n=50) |
Control group
(n=50) |
P value |
| LV ejection fraction (%) |
59.7 ± 8.9 |
61.9 ± 2.8 |
0.091 |
| LV EDD (mm) |
43.7 ± 5.3 |
42.5 ± 3.5 |
0.190 |
| LV ESD (mm) |
30.7 ± 4.1 |
30.9 ± 3.4 |
0.854 |
| Septal thickness (mm) |
15.3 ± 21.6 |
10.4 ± 1.1 |
0.118 |
| PW thickness (mm) |
9.7 ± 1.2 |
9.6 ± 1.1 |
0.739 |
| Aortic root (mm) |
22.3 ± 2.80 |
22.1 ± 2.82 |
0.750 |
| Left atrial diameter (mm) |
37.3 ± 4.7 |
33.6 ± 3.7 |
<0.001 |
| E (cm/sn) |
54.4 ± 13.0 |
65.9 ± 15.6 |
0.000 |
| A (cm/sn) |
77.7 ± 19.8 |
74.1 ± 13.2 |
0.204 |
| E/A |
0.73 ± 0.19 |
0.91 ± 0.27 |
0.000 |
| IVRT (ms) |
88.0 ± 14.3 |
93.3 ± 13.5 |
0.061 |
| IVCT (ms) |
48.0 ± 14.3 |
53.3 ± 13.5 |
0.061 |
| dT (ms) |
219.2 ± 34.4 |
209 ± 30.8 |
0.145 |
| Em (cm/sn) |
6.8 ± 2.2 |
7.7 ± 2.3 |
0.072 |
| Am (cm/sn) |
10.2 ± 2.7 |
9.0 ± 2.4 |
0.029 |
| E/Em oranı |
7.7 ± 2.3 |
9.9 ± 8.8 |
0.920 |
A: Mitral Late Diastolic Velocity; Am: Myocardial Late Diastolic Velocity; Dt: Mitral E-Wave Deceleration Time; E: Mitral Early Diastolic Velocity; Em: Myocardial Early Diastolic Velocity; IVCT: Isovolumetric Contraction Time; IVRT: Isovolumetric Relaxation Time; LV: Left Ventricular; LVEDD: LV End-Diastolic Dimension; LVESD: LV End-Systolic Dimension; MAC: Mitral Annular Calcification; PW: Posterior Wall.
Table 2: Comparison of echocardiographic data of the study population.
The ECG parameters of the groups are shown in Table 3. The cQTmin (p=0.006), Tp-e interval (p< 0.001), cTp-e interval (p< 0.001), Tp-e/QT ratio (p< 0.001), and cTp-e/QT ratio (p< 0.001) were significantly higher in patients with MAC compared with the control group.
| Variables |
MAC group
(n=50) |
Control group
(n=50) |
P value |
| Heart rate (beat/min) |
77.74 ± 11.7 |
74.7 ± 9.9 |
0.166 |
| QT max (ms) |
392.0 ± 31.5 |
391.7 ± 23.4 |
0.957 |
| cQT max (ms) |
435.8 ± 42.5 |
426.8 ± 31.1 |
0.230 |
| QT min (ms) |
340.1 ± 53.2 |
343.0 ± 17.4 |
0.711 |
| cQT min (ms) |
390.1 ± 31.5 |
373.8 ± 26.1 |
0.006 |
| QTd (ms) |
44.54 ± 22.2 |
48.7 ± 15.6 |
0.283 |
| cQTd (ms) |
51.3 ± 24.9 |
52.9 ± 16.9 |
0.702 |
| Tp-e (ms) |
75.8 ± 11.6 |
62.1 ± 8.7 |
<0.001 |
| cTp-e (ms) |
84.9 ± 14.3 |
67.5 ± 9.7 |
<0.001 |
| Tp-e/QT |
0.19 ± 0.02 |
0.15 ± 0.02 |
<0.001 |
| cTp-e/QT |
0.19 ± 0.03 |
0.15 ± 0.02 |
<0.001 |
QTmax: QT Maximum, Cqtmax: Corrected Qtmaximum, Qtmin: QT Minimum, Cqtmin: Corrected QT Minimum, Qtd: QT Dispersion, Cqtd: Corrected QT Dispersion, Tp-E: Transmural Dispersion of Repolarisation, Ctp-E: Corrected Transmural Dispersion of Repolarisation
Table 3: Electrocardiographic findings of the study population.
In the MAC group, positive correlations between the E/Em ratio and cTp-e interval (r=0.396; p=0.004) and between the E/Em ratio and cTp-e/QT ratio (r=0.535; p< 0.001) were found (Figures 1 and 2). In addition, there were positive correlations between LA diameter and cTp-e interval (r=0.50; p=0.001), and between LA diameter and cTp-e/QT ratio (r=0.31; p=0.028) in MAC group.
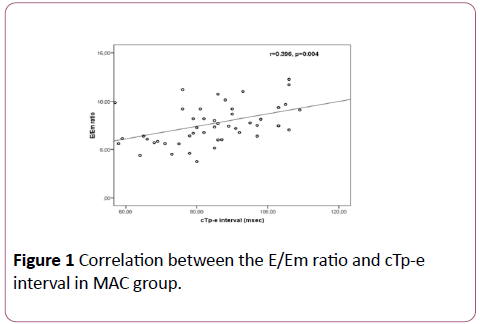
Figure 1: Correlation between the E/Em ratio and cTp-e interval in MAC group.
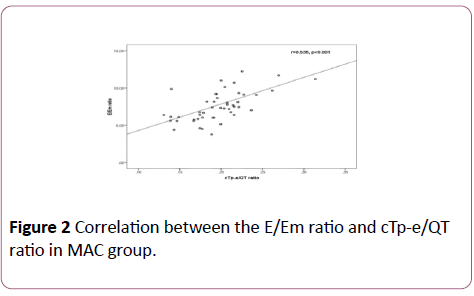
Figure 2: Correlation between the E/Em ratio and cTp-e/QT ratio in MAC group.
Discussion
In this study, we investigated ECG parameters of ventricular repolarization and depolarization in patients with MAC. The parameters that showed VRD, such as the Tp-e interval and Tpe/ QT ratio, were higher in patients with MAC compared with the controls. In addition, strong associations were found between ECG parameters that showed diastolic dysfunction and the aforementioned VRD parameters in the MAC group.
MAC is a chronic, degenerative, non-inflammatory disease of the fibrous skeleton of the mitral valve. Its prevalence increases with age and is higher in females. In a multiethnic cohort study [10] MAC and severity of MAC were found to be strong and independent predictors cardiovascular events. After adjustment for other cardiovascular risk factors, MAC remained associated with an increased risk of myocardial infarction and vascular death. Also, a recent retrospective study used a large echocardiographic database found that Mac was independently associated with all-cause mortality [13]. Some researchers have suggested that MAC, calcification of the aortic valve, and coronary atherosclerosis have the same etiology and are in fact different forms of the same disease [14]. MAC was proposed as an independent predictor of the extent of CAD [15]. Boon et al. reported that MAC and aortic valvular calcification should be regarded as signs of extensive atherosclerosis [16]. In addition, MAC is correlated with cardiovascular events including atrial fibrillation, atherosclerotic disease, stroke, and death [17].
Studies have shown that a large LA is associated with a higher incidence of atrial fibrillation development in patients with MAC [18]. A larger LA in patients with MAC may be related to the comorbid diseases that typically accompany MAC [19]. Since MAC is a sclerodegenerative disease, it results in inflammation of the LA and increased “stiffness”. This results in diastolic dysfunction and enlargement of the LA. Using the same mechanisms, MAC interferes with inter- and intra-atrial conduction, resulting in conduction defects [20].
In the present study, we showed a significant increase in LA diameter. In addition, there were positive associations between the LA diameter and cTp-e interval and between the LA diameter and cTp-e/QT ratio in MAC patients. The common co-occurrence of MAC and diastolic dysfunction is well known. Indeed, insufficient relaxation and limitation of the posterior valve cause diastolic dysfunction in MAC [21]. In addition, old age and comorbid diseases result in increased fibrous tissue, and hence, a defect in relaxation of the left ventricle occurs. In our study, diastolic dysfunction was significantly apparent in the MAC group compared with the control group. Sauer et al. evaluated 84 patients and reported significant correlations of the Em with the E/Em ratio and Tp-e interval. They also reported that the Tp-e interval increased as the grade of diastolic dysfunction increased [22]. Similarly, in our study, we found positive correlations between the E/Em ratio parameter of diastolic dysfunction and the cTp-e interval and between the cTp-e interval and cTp-e/QT ratio.
Ventricular myocardial repolarization can be analyzed using the QT interval and measurement of the T wave. Previous electrophysiological studies have demonstrated the association between repolarization heterogeneity and stimulation of arrhythmias [23].
A number of clinical and experimental investigations have shown that primary or secondary elongation of the QT interval is a predisposing factor for ventricular arrhythmias [24]; QTd has been accepted as an index of ventricular arrhythmias [25-29]. An increased QTd was demonstrated in various disorders including acute coronary syndrome, ventricular arrhythmias, and cardiac autonomic neuropathy [26,27]. Priori et al. showed that QTd increased in idiopathic long QT syndrome [28], while Ta¸olar et al. [29] did not find significant differences in QTd and cQTd parameters between patients with MAC and controls. Similarly, in our study we did not find significant differences in QTd and cQTd between patients with MAC and the controls.
On the other hand, some studies have suggested that QTd does not clearly demonstrate VRD. A previous study reported that QTd did not directly show heterogeneity of ventricular repolarization [30]. Moreover, Somberg et al. noted that QTd did not clearly demonstrate ventricular heterogeneity, and that medications that increase the QT interval should be used during follow-up [31]. Yamaguchi et al. showed that the Tp-e interval was a more valuable parameter for predicting torsades de pointes (TdP) in acquired long QT syndrome than was QTc or QTd, and that the use of QTd had some limitations in measuring the heterogeneity of ventricular repolarization [29]. In recent years, it has been reported that newer ECG parameters such as the Tp-e interval and Tp-e/QT ratio can be used for VRD analysis, and that these parameters are predictors of ventricular arrhythmias and cardiovascular death, similar to the QT interval and QTd [6,7-33]. To our knowledge, the effect of MAC on the Tp-e duration and Tp-e/QT ratio has not been evaluated before now. It was previously reported that QTd was calculated on DII, V5, and V6 derivations; however, the derivations to be used for Tp-e interval measurement have not been clearly indicated, and precordial derivations are typically used to perform measurements. We measured the Tp-e interval from the V6 derivation. An increased Tp-e interval is a beneficial parameter for predicting ventricular arrhythmias and cardiovascular events [34].
In addition, it was reported that parameters including Tp-e and QT intervals are affected by body mass and heart rate, while the Tp-e/QT ratio is not, and that the Tp-e/QT ratio is more sensitive for the prediction of ventricular arrhythmias than is the Tp-e interval or QTd [33]. Hevia et al. showed that use of the Tp-e interval was beneficial for risk stratification in patients with Brugada syndrome. They included 29 patients in their prospective study and followed the patients for a duration of 11–108 months, during which time they demonstrated a significantly increased prevalence of recurrent cardiac events in patients with a high Tp-e interval [12]. A study show that cQTmax, cQTd, and Tp-e interval were significantly higher in diabetic with subclinical LV diastolic dysfunction than in diabetic with normal LV diastolic dysfunction [35], TdP and sudden cardiac death were found to be correlated with the Tp-e interval in Brugada syndrome, hypertrophic cardiomyopathy, and acquired and congenital long QT syndrome [36]. A study performed on 338 STEMI patients with successful primary percutaneous coronary intervention revealed higher in-hospital mortality and cardiac event rates in patients with high Tp-e/QT ratios. The authors reported that a high Tp-e/QT ratio was an independent predictor of all-cause mortality after discharge from the hospital [7]. Shu et al. evaluated 120 patients with STEMI and demonstrated that the Tp-e/QT ratio was increased in patients who had malignant ventricular arrhythmia compared with patients who did not [37].
Ta¸olar et al. [38] reported that Tp-e and cTp-e intervals and Tp-e/QT ratio were increased significantly in healthy individuals who smoked compared with those who did not. In addition, they showed a significant correlation between these markers and the amount of cigarettes smoked. Similarly, in our study we found that the Tp-e and cTp-e intervals and Tp-e/QT ratio were increased in patients with MAC compared with the controls. However, our study is limited by its cross-sectional and observational design, as well as by the lack of clinical follow-up for arrhythmic events.
Limitations of the study
Our study has some limitations. Number of patients in our study is relatively small. The main limitations of our study were its cross-sectional design and lack of patient follow-up, since the study population could not be followed prospectively for ventricular arrhythmias. Further studies with larger sample sizes and longer follow-up periods are warranted to determine the correlation between the prevalence of ventricular arrhythmias and ventricular repolarization markers in patients with MAC.
Conclusion
The Tp-e and cTp-e intervals and Tp-e/QT ratio, which are indices of ventricular arrhythmia, were higher in asymptomatic patients with MAC. Increased Tp-e and cTp-e intervals and Tpe/ QT ratios may be early predictors of the increased frequency of ventricular arrhythmias in patients with MAC.
20838
References
- D'Cruz I, Panetta F, Cohen H, Glick G (1979) Submitral calcification or sclerosis in elderly patients: M-Mode and two-dimensional echocardiography in ''mitral annulus calcification''. Am J Cardiol 44: 31–38.
- Benjamin EJ, Plehn JF, D'Agostino RB, Belanger AJ, Comai K, et al. (1992) Mitral annular calcification and the risk of stroke in an elderly cohort. N Engl J Med 327: 374–379.
- Atar S, Jeon DS, Luo H, Siegel RJ (2003) Mitral annular calcification: A marker of severe coronary artery disease in patients under 65 years old. Heart 89: 161–164.
- Fox CS, Parise H, Vasan RS, Levy D, O′Donell CJ, et al. (2004) Mitral annular calcification is a predictor for incident atrial fibrillation. Atherosclerosis 173: 291–294.
- Allison MA, Cheung P, Criqui MH, Langer RD, Wright CM (2006) Mitral and aortic annular calcification are highly associated with systemic calcified atherosclerosis. Circulation 113: 861–866.
- Kors JA, Ritsema Van Eck HJ, Van Herpen G (2008) The meaning of the Tp-Te interval and its diagnostic value. J Electrocardiol 41: 575–580.
- Zhao X, Xie Z, Chu Y, Yang L, Xu W, et al. (2012) Association between Tp-e/QT ratio and prognosis in patients undergoing primary percutaneous coronary intervention for ST-segment elevation myocardial infarction. Clin Cardiol 35: 559–564.
- Lang RM, Bierig M, Devereux RB, Flachskampf FA, Foster E, et al. (2005) Recommendations for chamber quantification: A report from the American Society of Echocardiography’s Guidelines and Standards Committee and the Chamber Quantification Writing Group, developed in conjunction with the European Association of Echocardiography, a branch of the European Society of Cardiology. J Am Soc Echocardiogr 18: 1440–1463.
- Nagueh SF, Appleton CP, Gillebert TC (2009) Recommendations for the evaluation of left ventricular diastolic function by ehocardiograpy. Eur J Echocardiogr 10: 165–193.
- Kohsaka S, Jin Z, Rundek T, Albala BB, Homma S, et al. (2008) Impact of mitral annular calcification on cardiovascular events in a multiethnic community. The Northern Manhattan Study. JACC Cardiovasc Imaging. 1: 617–623.
- Day CP, McComb JM, Campbell RW (1990) QT dispersion: An indication of 267 arrhythmia risk in patients with long QT intervals. Br Heart J 63: 342–344.
- Castro Hevia J, Antzelevitch C, Tornes Barzaga F, Dorantes Sanchez M, Dorticos Balea F, et al. (2006) Tpeak-Tend and Tpeak-Tend 271 dispersion as risk factors for ventricular tachycardia/ventricular fibrillation in patients with the Brugada syndrome. J Am Coll Cardiol 47: 1828–1834.
- Ramaraj R, Manrique C, Hashemzadeh M, Movahed MR (2013) Mitral annulus calcification is independently associated with all-cause mortality. Exp Clin Cardiol 18: e5–e7.
- Roberts WC (1986) The senile cardiac calcification syndrome. Am J Cardio 58: 572–574.
- Utsunomiya H, Yamamoto H, Kunita E, Kitagawa T, Ohashi N, et al. (2010) Combined presence of aortic valve calcification and mitral annular calcification as a marker of the extent and vulnerable characteristics of coronary artery plaque assessed by 64-multidetector computed tomography. Atherosclerosis 213: 166–172.
- Boon A, Cheriex E, Lodder L, Kessels F (1997) Cardiac valve calcification: characteristics of patients with calcification of the mitral annulus or aortic valve. Heart 78: 472-474.
- Adler Y, Herz I, Vaturi M, Fusman R, Shohat-Zabarski R, et al. (1998) Mitral annulus calcium detected by transthoracic echocardiography is a marker for high prevalence and severity of coronary artery disease in patients undergoing coronary angiography. Am J Cardiol 82: 1183–1186.
- Savage DD, Garrison RJ, Castelli WP, McNamara PM, Anderson SJ, et al. (1983) Prevalence of submitral (annular) calcium and its correlates in a general population-based sample (The Framingham Study). Am J Cardiol 51: 1375–1378.
- Pressman GS, Crudu V, Parameswaran-Chandrika A, Romero-Corral A, Purushottam B, et al. (2011) Can total cardiac calcium predict the coronary calcium score? Int J Cardiol 146: 202–206.
- Fulkerson PK, Beaver BM, Auseon JC, Graber HL (1979) Calcification of the mitral annulus: Etiology, clinical associations, complications and therapy. Am J Med 66: 967–977.
- Labovitz AJ, Nelson JG, Windhorst DM, Kennedy HL, Williams GA (1985) Frequency of mitral valve dysfunction from mitral annular calcium as detected by Doppler echocardiography. Am J Cardiol 55: 133–137.
- Sauer A, Wilcox JE, Andrei AC, Passman R, Goldberger JJ, et al. (2012) Association of the ECG T-peak to T-end interval with echocardiographic markers of diastolic dysfunction. Circ Arrhythm Electrophysiol 5: 537–543.
- Surawicz B (1989) Electrophysiologic substrate of torsade de pointes: Dispersiyon of repolarisation or early afterdepolarization? J Am Coll Cardiol 14: 172–177.
- Moss AJ, Schwartz PJ, Crampton RS, Tzivoni D, Locati EH, et al. (1991) The long T syndrome. Prospective longitudinal study of 328 families. Circulation 84: 1136–1144.
- Topilski I, Rogowski O, Rosso R, Justo D, Copperman Y, et al. (2007) The morphology of the QT interval predicts torsade de pointes during acquired bradyarrhythmias. J Am Coll Cardiol 49: 320–328.
- Pye M, Quinn AC, Cobbe SM (1994) QT interval dispersion: A non-invasive marker of susceptibility to arrhythmia in patients with sustained ventricular arrhythmias? Br Heart J 71: 511–514.
- Wei K, Dorian P, Newman D, Langer A (1995) Association between QT dispersion and autonomic dysfunction in patients with diabetes mellitus. J Am Coll Cardiol 25: 859–863.
- Priori SG, Napolitano C, Diehl L, Schwartz PJ (1994) Dispersion of the QT interval: A marker of therapeutic efficacy in the idiopathic long QT syndrome. Circulation 89: 1681–1689.
- Ta¸olar H, Cansel M, Ya¸mur J, Baktr AO, Ermi¸ N, et al. (2011) Comparison of P wave and QT parameters between patients with mitral annulus calcification and healthy subjects. Üniversitesi Tp Fakültesi Dergisi 18: 9–13.
- Rautaharju PM (2002) Why did QT dispersion die? Card Electrophysiol Rev 6: 295–301.
- Somberg JC, Monar J (2002) Usefulness of QT dispersion as an electrocardiographically derived index. Am J Cardiology 89: 291–294.
- Yamaguchi M, Shimizu M, Ino H, Terai H, Uchyama K, et al. (2003) T wave peak-to-end interval and QT dispersion in acquired long QT syndrome: A new index for arrhythmogenicity. Clin Sci (Lond) 105: 671–6.
- Gupta P, Patel C, Patel H, Narayanaswamy S, Binu M, et al. (2008) Tp-e/QT ratio as an index of arrhythmogenesis. J Electrocardiol 41: 567–574.
- Erikssen G, Liestol K, Gullestad L, Haugaa KH, Bendz B, et al. (2012) The 347 terminal part of the QT interval (T peak to T end): A predictor of mortality 348 after acute myocardial infarction. Ann Noninvasive Electrocardiol 17: 85–94.
- Jani Y, Kamberi A, Xhunga S, Pocesta B, Ferati F, et al. (2015) The influence of type 2 diabetes and gender on ventricular repolarization dispersion in patients with sub-clinic left ventricular diastolic dysfunction. Am J Cardiovasc Dis 5: 155–166.
- Shimizu M, Ino H, Okeie K, Yamaguchi M, Nagata M, et al. (2002) T-peak to T-end interval may be a better predictor of high-risk patients with hypertrophic cardiomyopathy associated with a cardiac troponin I mutation than QT dispersion. Clin Cardiol 25: 335–339.
- Shu J, Li H, Yan G, Cui C (2010) Tp-e/QT ratio as a predictive index of sudden cardiac death in patients with ST-segment elevation myocardial infarction. J Xi-an Jiaotong Univ Med Sci 31: 441–443.
- Tasolar H, Balli M, Bayramoglu A, Otlu YO, Cetin M, et al. (2014) Effect of smoking on Tp-e interval, Tp-e/QT and Tp-e/QTc ratios as indices of ventricular arrhythmogenesis. Heart Lung Circ 23: 827–832.