Keywords
HIV; Health; Surveillance system; Health services
Introduction
Over the last 20 years, Uganda has piloted and implemented various management information systems (MIS) to improve surveillance of HIV/AIDS [1]. In 2012 a District Health Information Software (DHIS2) was introduced with support from the United States Agency for International Development (USAID) and scaled down to all districts. Introduction of DHIS2 nationally encouraged districts into gradual transition from use of traditional paper medical records to electronic database. Currently, the Ministry of health, with support from USAID funded HIV/AIDS projects, provided regular technical support to local districts to ensure equitable adoption of DHIS2. Improved surveillance of HIV/AIDS in Uganda has become increasingly important given a steady increase of HIV prevalence (6.4% to 7.2% between 2009 and 2013) among the general population [2]. HIV prevalence dropped almost threefold in the late 1990s, long before such reductions were achieved elsewhere in the world and the number of new HIV cases has been steadily rising since- from approximately 124,000 in 2009 to 128,000 in 2010 and to 145,000 by 2011. In 2010, Uganda was reported to have the fourth highest rate of HIV infections among fifty three African countries. The data from sentinel surveillance sites indicate that there was a decline in HIV prevalence, from a high of 22.0% in the early 1990’s to a low of approximately 5.2% in 2004 [2]. However, the national HIV prevalence in 2011 was reported to be 7.3% and even much higher (8.3%) among women at [2]. The baseline measurement of 102,157 new cases of HIV in 2010 was used to set the country’s 2011-2015 National HIV Prevention Strategy (NPS) which set a target of reducing new cases to 71,510 by 2015 [3]. To monitor and evaluate the progress being made towards realization of NPS targets, the Ministry of Health with support from the US government introduced a District Health Management Information Software (DHIS2), a web-based database that collects and analyses routine HIV/AIDS program data in real-time. All local districts hospitals and private health care providers offering HIV/AIDS services were tasked to report their patient data through the DHIS2 to ensure equitable adaptation of the new technology.
Districts’ Departments for Health Services are responsible for entering all of the data into the DHIS2 as soon as they receive the medical forms from health facilities. Data reporting is carried out through a chain of ecological hierarchy from community health centers to hospitals, and then up to the district level. Districts in Uganda are yet to fully adopt DHIS2 as revealed by low reporting completeness associated with medical records for outpatient, inpatient and antenatal services during the reporting period between April and June 2013. However, researchers have dubbed the process of “technological transfer” from developed to developing countries, as often carried out without taking into account local contextual and cultural factors such as language, infrastructure, availability of personnel [4-6]. Achieving NSP targets requires a functional national MIS that provides timely, accurate, and complete data on not only exact numbers of new HIV infections, but also on comprehensive HIV/AIDS programs like AIDS care and treatment. It is important for the Ministry of Health and its partner organizations to utilize HIV/AIDS program data and ensure program effectiveness and leveraging the interventions that are found to be most successful in addressing HIV/AIDS in other countries which have brought down the epidemic [7].
Methods
We argue that investigating factors such as number of HIV/AIDS [8] clients served within a district in a particular reporting period; number of health faculties districts are required to report HIV/ AIDS data on; number of US Government non-governmental organizations (NGOs) present and supporting a district to report HIV/AIDS program data; and regional location of districts, can provide insight to understanding how local districts are adapting to reporting of HIV/AIDS program data in DHIS2. The study adopted one dependent variable of reporting completeness attained by districts and measured as a continuous variable from zero (0) to one hundred percent (100%). We used cross-sectional study design which allows researchers to compare many different variables at the same time.
Definitions
Number of client visits: Client visits refer to total number of individuals seeking HIV prevention and treatment services within a particular district during the months of April – June, 2013. Services range from voluntary counseling and testing (VCT), educational campaigns, antenatal services (ANC), and early infant diagnosis of HIV, safe male circumcision (SMC) for HIV prevention and prevention of mother-to-child transmission [9] of HIV (PMTCT), and anti-retroviral therapy (ART) for HIV positive individuals. To measure the impact of client load on reporting completeness among local districts, the number of client visits was grouped into ordinal of
1) Under 2500
2) Between 2501 to 5000
3) Over 5001.
Number of NGOs present in a district: The United States Government’s Presidential Emergency Plan for AIDS Relief (PEPFAR) is the major funder for the Uganda’s HIV/AIDS programs [10]. Between 2009 and 2010, the US government contributed 83% and 93% of the entire donor funding. Data on NGO support is only available on the US supported NGOs. These NGOs work in all local districts to implement HIV/AIDS programs. They equally support district health facilities to report their HIV/AIDS program data into the DHIS2. However Districts are disproportionally supported by PEPFAR NGOs (Implementing Partners-IPs) with some districts supported by over ten NGOs while others by only one or none [11]. We hypothesize that reporting completeness is lower among those districts receiving less NGO support than others. Number of health units operated by the districts was also grouped into ordinal scales of
1) Under 20
2) Between 21 to 40
3) Over 41.
Number of health units: Districts operate varying numbers of health units, some as few as ten while others over fifty [12]. This disparity in numbers of health units operated by districts translated into a disparity in reporting workload faced by districts. This scenario is compounded by a shortage of health workers among districts. We hypothesize that districts operating far more health units than others are at a less disadvantage of reporting completeness of HIV/AIDS program data [13]. Number of HIV/ AIDS present in a district was equally grouped on an ordinal scale of
1) Only one
2) Only two
3) Three and above.
Region: Uganda's health sector is managed through regional administrative structures of Central, Eastern, Northern and Western regions. Each one of these regions differs in terms of infrastructural development. Some regions E.g. the Central is has a well-developed infrastructure like more stable and easily accessible internet, electricity, more health workers, etc., which could augment smooth adaptability of DHIS2 among districts located within this region [14-16]. Districts located in the Northern and some parts of Eastern regions are more underdeveloped, primarily due to a 20 year civil war that ravaged this region. We hypothesize that a district’s regional location will have an effect on reporting completeness of HIV/AIDS data in the DHIS. Districts' regional location of North, Central, Eastern and Western remained as categorical variables [17,18].
Results
The factorial analysis of variance (Table 1) tested for the effects of client visits, number of NGOs, number of health units and regions, on reporting completeness. In the omnibus F-test, we obtained F=17.117 (p<0.05) and an effect size of 0.639, indicating one or more of the independent variables has a significant association with mean reporting completeness [19]. This warranted an examination of the F-statistics for each independent variable. The omnibus F-statistic=17.117 and p<0.05 and effect size of 0.639 [20].
| Source |
Type III Sum of Squares |
df |
Mean Square |
F |
Sig. |
Partial Eta Squared |
| Corrected Model |
25719.121a |
9 |
2857.68 |
17.117 |
0 |
0.639 |
| Intercept |
373844.6 |
1 |
373844.6 |
2.24E+03 |
0 |
0.963 |
| Client visits |
5056.523 |
2 |
2528.261 |
15.144 |
0 |
0.258 |
| Number of NGOs |
4632.008 |
2 |
2316.004 |
13.872 |
0 |
0.242 |
| Number of health units |
3839.449 |
2 |
1919.724 |
11.499 |
0 |
0.209 |
| Region |
257.352 |
3 |
85.784 |
0.514 |
0.674 |
0.017 |
| Error |
14524.73 |
87 |
166.951 |
|
|
|
| Total |
519584.4 |
97 |
|
|
|
|
| Corrected Total |
40243.85 |
96 |
|
|
|
|
a. R Squared =0.639 (Adjusted R Squared =0.602)
Table 1: Dependent variables: Tests of between-subjects effectson reporting completeness.
Client visits: There was a downward trend in mean reporting completeness as the number of client visits increased (Figure 1). Districts with the fewest client visits (under 2500) had the highest mean reporting completeness (81.6%); the scale ‘between 2501 to 5000, and that of over 5001 attained reporting completeness of 72.4% and 51.7% respectively [21].
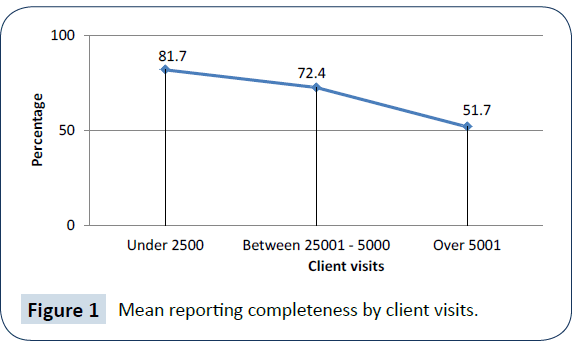
Figure 1: Mean reporting completeness by client visits.
The mean differences in reporting completeness between groupings of number of client visits are reported in the multiple comparisons in Table 2 above.
| (I) Number of client visits |
(J) Number of client visits |
Mean Difference (I-J) |
Std. Error |
Sig. |
95% Confidence Interval |
| Lower Bound |
Upper Bound |
| Under 2500 |
Between 2501- 5000 |
9.253* |
3.3614 |
0.022 |
1.048 |
17.459 |
| Over 5001+ |
29.933* |
3.0455 |
0 |
22.499 |
37.368 |
| Between 2501- 5000 |
Under 2500 |
-9.253* |
3.3614 |
0.022 |
-17.459 |
-1.048 |
| Over 5001+ |
20.680* |
3.6268 |
0 |
11.826 |
29.534 |
| Over 5001+ |
Under 2500 |
-29.933* |
3.0455 |
0 |
-37.368 |
-22.499 |
| Between 2501- 5000 |
-20.680* |
3.6268 |
0 |
-29.534 |
-11.826 |
Based on observed means.
The error term is Mean Square(Error)=166.951.
*The mean difference is significant at the 0.05 level therefore we reject the null which assumes equal means.
Table 2: Multiple Comparisons for client visits on reporting completeness/Bonferroni.
| (I) Number of NGOs |
(J) Number of NGOs |
Mean Difference (I-J) |
Std. Error |
Sig. |
95% Confidence Interval |
| Lower Bound |
Upper Bound |
| Only one NGO |
Only two NGOs |
-10.459* |
3.5166 |
0.011 |
-19.044 |
-1.875 |
| Three + |
-23.912* |
3.1727 |
0 |
-31.657 |
-16.167 |
| Only two NGOs |
Only one NGO |
10.459* |
3.5166 |
0.011 |
1.875 |
19.044 |
| Three + |
-13.453* |
3.1727 |
0 |
-21.198 |
-5.708 |
| Three + |
Only one NGO |
23.912* |
3.1727 |
0 |
16.167 |
31.657 |
| Only two NGOs |
13.453* |
3.1727 |
0 |
5.708 |
21.198 |
Based on observed means.
The error term is Mean Square(Error)=166.951.
*The mean difference is significant at the 0.05 level therefore we reject the null which assumes equal means.
Table 3: Multiple Comparisons for NGOs on reporting completeness/ Bonferroni.
| (I) Health units |
(J) Health units |
Mean Difference (I-J) |
Std. Error |
Sig. |
95% Confidence Interval |
| Lower Bound |
Upper Bound |
| Under 20 |
Between 21-40 |
9.957* |
3.3104 |
0.01 |
1.876 |
18.038 |
| Over 41 |
30.216* |
3.426 |
0 |
21.853 |
38.58 |
| Between 21-40 |
Under 20 |
-9.957* |
3.3104 |
0.01 |
-18.038 |
-1.876 |
| Over 41 |
20.259* |
3.0561 |
0 |
12.799 |
27.72 |
| Over 41 health units |
Under 20 |
-30.216* |
3.426 |
0 |
-38.58 |
-21.853 |
| Between 21-40 |
-20.259* |
3.0561 |
0 |
-27.72 |
-12.799 |
Based on observed means
The error term is Mean Square (Error)=166.951.
*The mean difference is significant at the 0.05 level therefore we reject the null which assumes equal means.
Table 4: Multiple Comparisons for health units on reporting completeness/Bonferroni
The three rows are:
i. Under 2500
ii. Between 2501-5000
iii. Over 5001
The results indicate that client visits has a significant effect on reporting completeness with F (15.144) and
p<0.05.
Number of NGOs: There was an upward trend in mean reporting completeness as the number of NGOs increased. Districts that were receiving support from only one compared to those supported by two NGOs attained 56.7% and 67.2% mean reporting completeness respectively [22]. The districts receiving support from more than three NGOs had the highest (80.6%) mean reporting completeness.
The number of NGOs also had a significant effect on reporting completeness with F(13.872) and p<0.05. Moreover the mean reporting completeness attained by ‘only one NGO’ was -23.912 lower than that of ‘three+ NGOs’ and the difference was statistically significant (p<0.05) [23-25].
Number of health units: There was a downward trend in mean reporting completeness as the number of health units increased (Fig 3). Districts with fewest (<20) health units had the highest mean reporting completeness (84.5%) [26]. We observed that an increase in a scale for health units from between 21 to 40, and further to over 41 led to steady reduction in mean reporting completeness from 74.6% to 54.3%. Notably, districts operating over 41 health units attained lowest mean reporting completeness (54.3%).
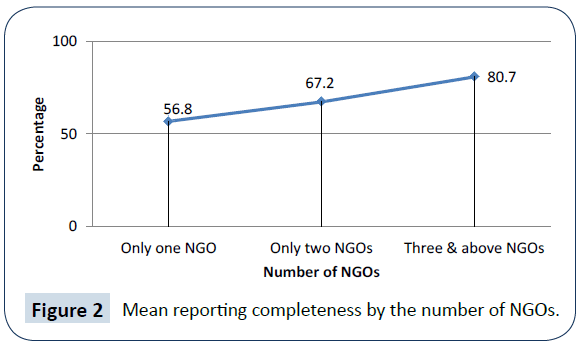
Figure 2: Mean reporting completeness by the number of NGOs.
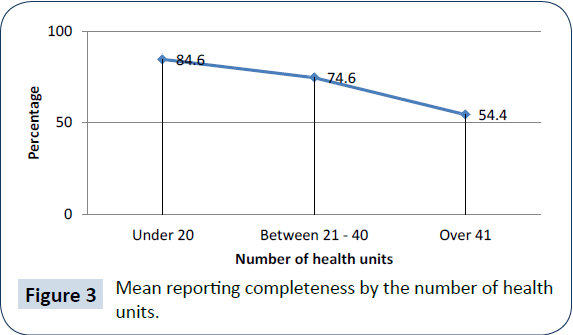
Figure 3: Mean reporting completeness by the number of health units.
The mean differences between groupings of the health units are reported in the multiple comparisons above.
The health unit’s representation:
i. Under 20
ii. Between 21-40
iii. Over 41
The mean reporting completeness for the ‘fewer than 20’ health units was 30.216 higher than the ‘over 41’ health units and the difference was statistically significant (p<0.05) [27].
Regions: Across regions, mean reporting completeness appeared to be approximately equal (Figure 4). Central-72.4%; Eastern-70.6%; Northern-68.6%; and Western-69.5%. District's regional location did not have a significant effect on reporting with F(0.514) and p=0.674.
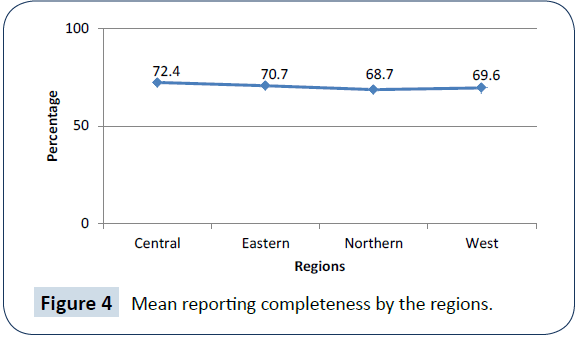
Figure 4: Mean reporting completeness by the regions.
Discussion
We found that an increase in client visits was associated with a reduction in mean reporting completeness attained in DHIS2 by districts. This finding was consistent with a related study in South Africa, which noted that performance of health information systems was poor especially among hospitals that served high volumes of patients. According to the 2011 Human Resources for Health Audit report, Uganda has a health worker staffing shortage of 42% [28,29]. This staffing situation might be much worse among districts categorized as hard-to-reach. Uganda's hospitals face severe health worker shortages with a low doctorpatient ratio of 1 to 24,725, nurse/midwife to patient ratio of 1:11,000. The shortage of health workers compounded by high volumes of patients undermine the already little capacity of districts to attain high reporting completeness of HIV/AIDS data into the government's DHIS2. Regarding NGO support to districts' HIV/AIDS programming, districts are disproportionally supported by PEPFAR-funded NGOs. We hypothesized that reporting completeness would be lower among districts receiving support from fewer NGO. Indeed we established that the number of HIV/ AIDS NGOs present in a district had positive impact of reporting completeness attained in DHIS2 and this relationship was found to be statistically significant at F(13.872) [30] and p<0.05. We found a negative impact on the number of health units operated by district and the associated reporting completeness. The statistical analysis observed that a consistent increase in the number of health units operated by districts was associated with a consistent decrease in mean reporting completeness. To estimate HIV prevalence among the general population, Uganda relies primarily on data from HIV tests of pregnant women seeking antenatal services. However, reporting completeness of medical records for antenatal services was a mere 37% between April and June 2013. Moreover, there was a drop from 24% to 34% between 2010 to 2011 in the HIV exposed babies, whose mothers tested HIV positive and were enrolled on antiretroviral drugs. Although Uganda's health sector has been making steady progress in rolling out an electronic medical records management, an overall 70.3% HIV/AIDS reporting completeness attained by districts nationally represents a major gap in the countries DHIS2 [31].
Conclusion
Although data for this study were extracted from a short reporting period (April-June 2013), our nationally representative study's findings can be leveraged to inform evidence-based policy development tailored to locally appropriate solutions for districts to fully adapt to a fairly new electronic medical records management system. Ultimately, the reporting completeness will have to be elevated to 100% in all 132 Uganda's districts. Noteworthy is that allocation of PEPFAR implementing partners (IPs) does not follow any standard criteria for apportioning NGO support among local districts. Important findings from this study e.g. the associated role, client visits; number of HIV/AIDS NGOs present in a district; and, number of health units operated by districts, should be targeted with actions plans targeting those most affected districts.
Declaration of Interests
We declare that we have no competing interests.
Acknowledgements
The Ministry of Health and the United States Agency for International Development (USAID) in Uganda whose data facilitated completion of this study. In particular, Mr. Martin Namutso from the Monitoring and Evaluation of Emergency Plan Progress (MEEPP) who offered timely clarifications to my inquiries.
18515
References
- Virga P, Bongguk J, Jesse T, Sergey V (2012) Electronic health information technology as a tool for improving quality of care and health outcomes for HIV/AIDS patients. International journal of medical informatics 81: e39–e45.
- Uganda AIDS Commissions (2012) The Global AIDS progress report. Uganda country report.
- (2013) The World Bank Uganda An assessment of the routine information systems for the monitoring and evaluation of the National HIV Prevention Strategy (NPS) 2011 – 2015. Kampala, Uganda.
- Nhampossa JL (2005) Re-thinking technology transfer as technology translation: A case study of health information systems in Mozambique. Faculty of Mathematics and Natural Sciences, University of Oslo.
- Lyytinen K (1987) Different perspectives on information systems: Problems and solutions. ACM Computing Surveys 19: 5–46.
- Orlikowski WJ, Robey D (1991) Information technology and the structuring of organizations. Journal of Information Systems Research 2: 143–169.
- Baryarama F, Bunnell R,Ransom L,Ekwaru JP, Kalule J, et al. (2004) Using HIV Voluntary Counselling and Testing Data for Monitoring the Uganda HIV Epidemic.Journal of Acquired Immune Deficiency Syndromes 37:1180.
- Auvert B, Taljaard D, Largarde E, Sobngwi-Tambekou J, Sitta R, et al. (2005) Randomized, controlled intervention trial of male circumcision for reduction of HIV infection risk: The ANRS 1265 Trial. PLOS Medicine 2: e298.
- Barker PM, Mphatswe W, Rollins N (2011) Antiretroviral drugs in the cupboard are not enough: The impact of health systems' performance on mother-to-child transmission of HIV. AIDS Journal of Acquired Immune Deficiency Syndromes 56:e45-8.
- (2012) The Joint United Nations programme on AIDS Global AIDS response progress report. Country progress report, Uganda.
- Bartholomew GS, Parcel GK, Gottlieb JB (2006) Planning health promotion programs: An intervention mapping approach. Jossey-Basspp. 143-165.
- Bechky BA (2003) Sharing meaning across occupational communities: The transformation of understanding on a production floor. Organization Science 14: 312–330.
- Bowker GC, Timmermans S, Star SL (1995) Infrastructure and organizational transformation: Classifying nurses work. Information technology and changes in organizational work pp. 344–369.
- Bodker S (1998) Understanding representation in design. Human Computer Interaction 13: 107–125.
- Burke MB, Buntin MF, Hoaglin MC,Blumenthal D (2011) The benefits of health information technology: A review of the recent literature shows predominantly positive results. Millwood pp:464–471.
- Curtis B, Krasner H, Iscoe N (1988) A field study of the software design process for largesystems. Communications of the ACM 31: 1268–1287.
- Garrety K, Badham R (2000) The politics of sociotechnical intervention: An interactionist view.Technology Analysis & Strategic Management. 12: 103-118.
- Health Metrics Network (2005)Assessment of the Health Information System in Uganda. Kampala –Uganda.
- Coovadia H, Jewkes R, Barron P, Sanders D, Diane McIntyre D (2009) The health and health system of South Africa: historical roots of current public health challenges. Lancet374: 817–34.
- Bryant JH (2000) Health priority dilemmas in developing countries. The Global Challenge of Health Care rationing. Open University Press. Philadelphia pp: 63–73.
- Kapiriria L, Susan JB (2006) Health practitioners’ and health planners’ information needs and seeking behavior for decision making in Uganda. International journal of medical informatics75: 714–72.
- Lintonen TP, Konu AI, Seedhouse KD (2008) Information technology in health promotion. Journal of Health Education Research23: 560–566.
- Lyytinen K, Robey D (1999) Learning failure in information systems development. Journal of Information Systems 9: 85–101.
- Pagano RR (2004) Understanding Statistics in the Behavioral Sciences (7th ed.) Belmont,CA: Thomson/Wadsworth.
- Pagliari AD, Anandan BK, Cresswell T, Bokun B, McKinstry R, et al. (2012) The impact of eHealth on the quality and safety of health care: a systematic overview.PLoS Med: e1000387.
- PeiferH,Fang KL,Chen J, RizzoJA (2011) Health information and technology and physicians perceptions of healthcare quality. Am J Manag Care 1: e66–e70.
- Robey D, Boudreau MC, Rose GM (2000) Information technology and organizational learning: A review and assessment of research. Accounting, Management and Information Technologies 10: 125–155.
- Schneider SS, Jones JL, Adams EJS, Ringel S,McGlynn E (2010) Electronic health record adoption and quality improvement in US hospitals. Am J Manag Care16: SP64–SP71.
- (2007) Uganda Demographic and Health Survey 2006. UBOS and Macro International Inc.
- (2011)Uganda AIDS Indicator Survey 2011. UBOS and Macro International Inc 2011.
- Walensky P, Wood R, CiaranelloAL, Paltel D, Lorenzana SB, et al. (2010) Scaling Up the 2010 World Health Organization HIV Treatment Guidelines in Resource- Limited Settings: A Model-Based Analysis. PLoS Medicine 7: e1000382.