Joelle Abi Azar1,2, Marcel Bassil1,2*, Jihad Irani3, Karine Al Badawi1, Carla Sawan4, Moussa Moussa5, Noha Hakimeh6 and Edmond Abboud7
1Biotechnology Department, Benta Pharma Industries, Lebanon
2Clinical Laboratory Sciences, Faculty of Health Sciences, University of Balamand, Lebanon
3Family Medicine Residency, Cornerstone Care Teaching Health Center, Mount Morris, Pennsylvania
4Faculty of Medicine & Medical Sciences, University of Balamand, Lebanon
5Benta Pharma Industries, Lebanon
6Laboratory Medicine and Blood Bank Department, Saint George University Hospital, Lebanon
7Laboratory Medicine, Middle East Institute of Health, Lebanon
Corresponding Author:
Marcel Bassil
Associate Director Biotechnology
Biotechnology Department
Benta Pharma Industry S.A.L.
Dbayeh, Lebanon
Tel: +961 4545000
E-mail: marcel.bassil@benta.com.lb
Received Date: Sep 24, 2018; Accepted Date: Oct 29, 2018; Published Date: Nov 1, 2018
Citation: Azar JA, Bassil M, Irani J, Badawi KA, Sawan C, et al. (2018) Factors Determining Blood and Urine Concentrations of Metformin among Patients with Type 2 Diabetes: A Cross Sectional Study. J Biomedical Sci Vol.7 No.4:14. doi:10.4172/2254-609X.100093
Copyright: © 2018 Azar JA, et al. This is an open-access article distributed under the terms of the Creative Commons Attribution License, which permits unrestricted use, distribution, and reproduction in any medium, provided the original author and source are credited.
Keywords
Diabetes; Metformin XR; Blood samples; Urine samples; Patient compliance
Introduction
Diabetes Mellitus (DM) is a lifelong condition characterized by high levels of blood glucose due to a dysfunction of the hormone insulin [1]. This hormone is produced by the pancreas and its main function is to help the body use glucose as a source of energy. Chronic elevation in the serum levels of blood glucose can cause serious and life threatening complications, including cardiovascular, renal and ophthalmological diseases [1]. The most common form is type II diabetes. Type II DM is a result of the interaction of genetic predispositions with environmental and behavioral factors such as age, smoking, lifestyle, alcoholism resulting in insulin resistance [2]. The prevalence of diabetes mellitus in Lebanon reaches 13%, 70% of which have uncontrolled hyperglycaemia [3].
High glucose levels can be controlled by many ways such as oral hypoglycaemic agents or injectable insulin. The efficacy, safety, cardiovascular and metabolic benefits, and its ability to be co-administered with other anti-diabetic drugs makes metformin the first line treatment as a glucose lowering drug for patients with type II diabetes mellitus [4,5].
Metformin is a white crystalline composite primarily absorbed in the gut and excreted in urine without any metabolic modifications. Metformin is available in its conventional immediate release (IR) form administered orally two to three times per day. The permeability within the gastrointestinal tract is thought to limit the absorption of metformin (IR). The absorption occurs primarily in the upper part of the gastrointestinal system [6].
The extended release (XR) formulation is a modified form of the drug, allowing it to be delivered over an extended period of time and all along the gastrointestinal tract [7].The bioavailability of metformin XR is around 80% [8]. Its half-life in plasma is around 1.5-4.9 hours [9].
The drug regulates the level of glucose mainly by enhancing peripheral and hepatic tissue sensitivity to insulin without changing its secretion. Metformin mainly acts on reducing the level of blood glucose by lowering intestinal absorption and hepatic glucose production. This process is based on the activation of a liver kinase B1 (LKB-1) [10].
Metformin may cause the following side effects: nausea, vomiting, stomach upset, diarrhoea, weakness, or a metallic taste in the mouth may occur [11].
Metformin is known to be eliminated by the kidneys without any metabolic modifications. Hence, when renal function is impaired metformin might accumulate in the body with the potential for exposure-dependent toxicity. The excessive accumulation of metformin leads to a shift toward anaerobic pathways [12]. Hence, the latter could lead to lactic acid accumulation, a condition known as lactic acidosis [13,14].
Since the bioavailability of metformin is around 80% [15], we can assume that part of the absorbed drug remains in the body and is neither excreted without hepatic modifications nor via metabolites. In addition, metformin is prescribed at standard doses for all diabetic patients without taking into account the characteristics of each patient, such as: gender, weight, other medications (drug-drug interaction), kidney function (measured by creatinine level and eGFR), timing of metformin intake, dosage, duration since metformin intake, HbA1c, smoking and alcohol intake. In this article, we present the results of a clinical study conducted on type 2 diabetics on chronic metformin XR use. Concentrations of metformin in blood and urine samples after oral ingestion of a fixed dose were correlated with the patient related factors.
Materials and Methods
Patients who agreed to participate were asked to provide a blood sample, a urine sample and to fill a questionnaire that includes information regarding their lifestyle, dietary habits and medical history. Metformin concentrations in the blood and urine samples collected were tested using the HPLC technique. Results were correlated with the patient related characteristics. This study included 95 patients who were asked brief screening questions to check their eligibility: age above 18, diagnosed with DM II and taking a fixed dose of Metformin XR for the last 3 months, and able to give written informed consent. Blood and urine samples were collected from each patient enrolled in the study. The laboratory of St George Hospital University Medical Centre in Beirut was chosen for diabetic patients’ recruitment. The testing was done at Benta company premises.
Traditional descriptive statistics were run to describe the studied sample. Quantitative variables like age, weight, dose of metformin ingested, number of years with diabetes, concentration of metformin in the blood and in the urine, etc. were summarized using means, medians and standard deviations. Qualitative variables like gender, smoking status, alcohol intake, timing of metformin administration and other medications were summarized using proportions and percentages. Next, a bivariate analysis was run to find associations between the main outcome “metformin concentration in blood and in urine” and the different factors like dose taken, age, weight, sex etc. Since the distribution of the analysis was abnormal and did not follow a bell curve, nonparametric tests were used. The Mann-Whitney test was used to compare means of concentration according to a selected categorical independent variable. Correlation (Spearman) was studied as well when dealing with a quantitative independent variable. The factors that are significantly associated with our outcome with a p<0.05 were entered in a multivariate linear model.
Detection technique
High performance liquid chromatography
• Chemicals and Solutions
• Working standard of metformin HCl (99.1% pure), (Sigma Aldrich)
• Methanol
• Water (HPLC Grade)
• Potassium phosphate monobasic (KH2PO4)
• Acetonitrile
• NaOH
Sodium dodecyl sulphate (SDS)
Equipment
The chromatographic system is composed of Waters HPLC system that consists of Separation Module 2695 and Dual λ Absorbance Detector 2487. The column used for separation was purchased from Sigma Aldrich with the following dimensions: 5 μm particle size, Length × Internal Diameter 25 cm × 4.6 mm. In addition, a guard Cartridge was purchased from Sigma Aldrich and was used to protect the HPLC column. The flow rate used is 0.7ml/min, at room temperature. Metformin detection occurs at a wavelength of 236 nm [16].
Preparation of the mobile phase
An acetonitrile-potassium dihydrogen phosphate buffer (34:66) is prepared with a pH 6.5, in HPLC Grade water. After pH adjustment with NaOH, 3mM of SDS is added. The prepared buffer is filtered through 0.45 μm filters and used as Mobile Phase A.
Plasma samples preparation
An equal amount of acetonitrile and plasma are mixed and then centrifuged for 3 min x3000G to chemically denature the proteins present in the plasma samples that might block the column. Approximately 95% of non-polar proteins such as albumin remain in the aqueous layer. The supernatant is collected and placed in HPLC vials. The remaining 5% of proteins are removed by the guard column. The guard column is also washed out regularly to prevent protein break-through to the main column.
Standard and stock solution preparation
The standard stock solutions of metformin is prepared according to the HPLC analytical procedure described in the article written by Gabret al. [16], with the following modification: an additional dilution of concentrate 2 ng/ml was added to the plasma calibration solutions.
A standard curve is drawn by plotting the known concentrations of the prepared standard solutions on the x -axis versus the corresponding HPLC peaks' areas on the y -axis. The latter is used to calculate the unknown concentration of metformin in the collected samples. Microsoft Office Excel 2007 is used to plot this curve in order to proceed with the data processing.
Results
The study included 50 males (52.6%) and 45 females (47.4%). The following Table 1 illustrates the numerical values of patients’ characteristics: age, weight, glucose level, and year since diagnosis of DM, HBA1C, creatinine and eGFR. It includes the mean and median values for each variable, the standard deviation and the minimum and maximum value. Most of the patients have near normal level of blood glucose (mean 139). The level of HBA1C for most patients is close to the limit yet not extreme, being 6%. Also, most of the patients have been taking metformin for no less than 5 consecutive years.
| |
Mean |
Median |
SD |
Min |
Max |
| Age |
63 |
64 |
12 |
30 |
88 |
| Weight |
80 |
80 |
15 |
47 |
112 |
| Glucose level |
139 |
117 |
109 |
79 |
1112 |
| Years since diagnosis of DM |
7.8 |
6 |
6.7 |
0 |
34 |
| HbA1c |
6.6 |
6.2 |
1.2 |
5 |
10.4 |
| Years on metformin |
4.9 |
4 |
4.3 |
1 |
20 |
| Creatinine |
0.91 |
0.91 |
0.25 |
0.42 |
1.87 |
| eGFR |
88.4 |
88 |
14 |
1.1 |
112 |
Table 1: Diabetic patients’ characteristics.
The results also show that the creatinine levels and eGFR fall within normal range and that no significant kidney problems were present among the subjects.
The following Table 2 shows some results and statistics for both plasma and urine concentrations of the 95 participants. The mean urine concentration is 2975ug/ml, whereas the mean plasma concentration is 364ng/ml. The minimum urine concentration is 161ug/ml and the maximum value is 6515ug/ml. The minimum plasma concentration is 0.38ng/ml and the maximum value is 4309ng/ml.
| |
Mean |
Median |
SD |
Min |
Max |
| Urine concentration |
2975 ug/ml |
3089 |
1571 |
161 |
6515 |
| Plasma concentration |
364 ng/ml |
82 |
738 |
0.38 |
4309 |
Table 2: Urine and plasma concentration values of the study and their statistical value.
According to the obtained results, most of the participants are non-smoker (61%) and non-alcohol abusers (82%). In addition, the majority of the patients take the metformin medication at night (89.5%) and the minority at noon (14%), whereas 42% of the patients take it in the morning.
When it comes to the “other medication or treatment” variable, the latter was divided into categories according to the most common medications reported in the study. A high percentage of the participants experience high blood pressure or high blood cholesterol or triglycerides. Also, some participants have severe diabetes and are obliged to take insulin and hypoglycaemic drugs other than metformin to further lower the sugar level (Figure 1).
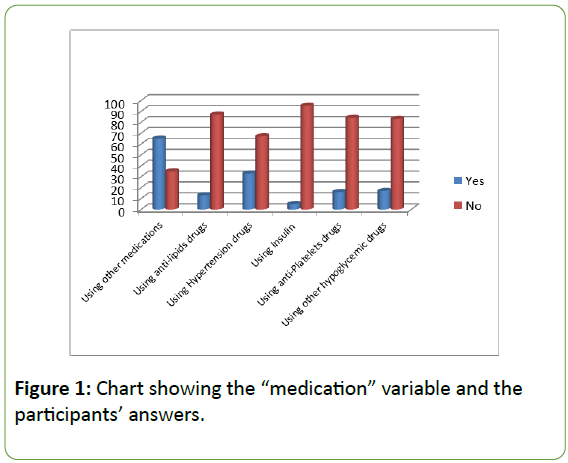
Figure 1: Chart showing the “medication” variable and the participants’ answers.
The list of drugs prescribed to the study subjects is classified as follow:
• Using lipids medication
• Using hypertension medication
• Using insulin to further lower the glucose level
• Using anti-platelet medication
• Using other hypoglycaemic drugs (Other than one containing the metformin molecule)
Most of the participants (65%) take medications other than hypoglycaemic drugs. The highest percentage was attributed to the hypertension medications (33%) and the lowest was for insulin use (5%). The other percentages are attributed to other hypoglycaemic drugs (22%), antiplatelet (21%) and anti-lipids with a percentage of 16%.
The histogram (Figure 2) below shows metformin concentrations in both plasma and urine, in addition to the mean values and standard deviations. The histogram shows a “skewed left distribution”, in other words, results are missing near the centre and the majority of the results are concentrated at one end of graph which corresponds to lower concentrations of metformin in plasma. There is no symmetrical distribution or clear association between the two parameters. The mean turned out to be 363.85 ng/ml and the standard deviation is 737.511.
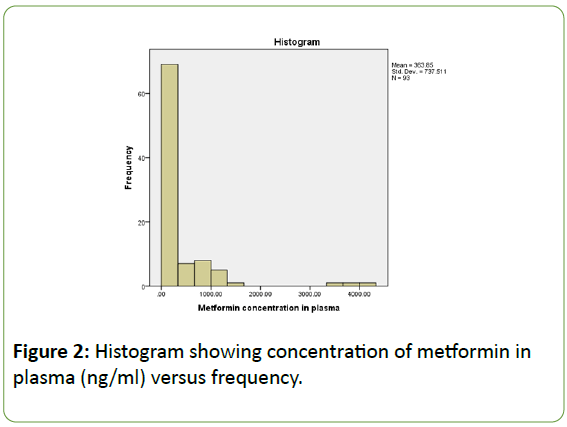
Figure 2: Histogram showing concentration of metformin in plasma (ng/ml) versus frequency.
However, the following histogram representing plasma concentration versus dose has a shaped and symmetrical representation as showed in Figure 3.
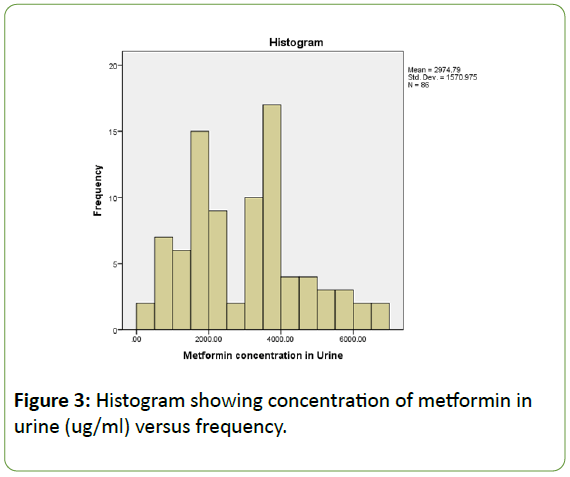
Figure 3: Histogram showing concentration of metformin in urine (ug/ml) versus frequency.
It has one clear centre at 4000 ug/ml that much of the data clusters around. In a symmetry distribution, the “tails” or extreme regions decrease as we go away from the centre. The mean metformin concentration in urine is 2974.79 ug/ml, whereas the standard deviation is 1570.975.
Moreover, Figure 4 is an additional representation of the association between daily doses of the drug vs. Metformin concentration in urine. The following histogram is a dot blot graph and clearly shows an association between daily dose of metformin and its concentration in urine. We may notice that the concentration in urine increases with dose frequency.
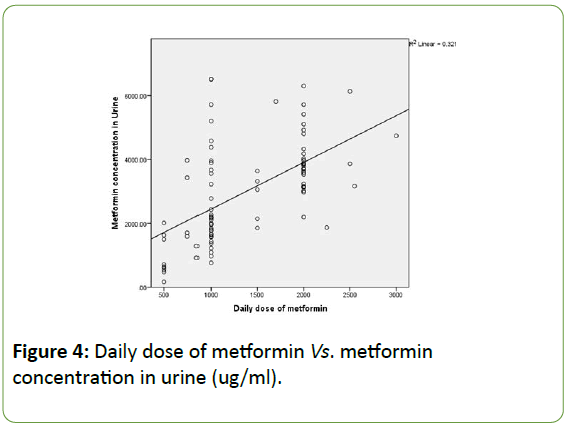
Figure 4: Daily dose of metformin Vs. metformin concentration in urine (ug/ml).
The correlation between weight and plasma concentrations is presented in the following dot plot histogram. This Figure 5 shows an association between the low values of metformin concentration in plasma with the weight variable. The majority of the results are concentrated around 300ng/ml which is the close to the mean value of plasma concentration for the total participants.
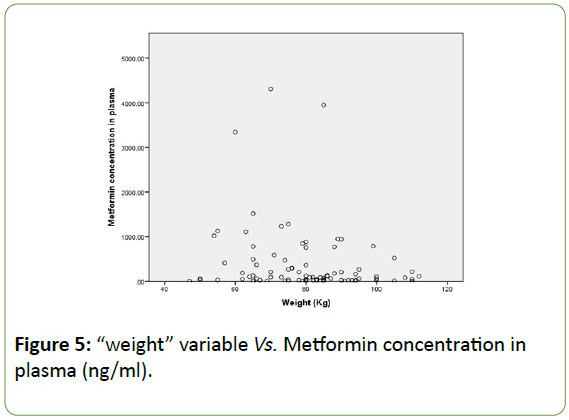
Figure 5: “weight” variable Vs. Metformin concentration in plasma (ng/ml).
Another finding is related to the “exercise frequency” variable (Figure 6). Even that no correlation was detected between metformin concentration and the physical activity of the patients, results showed that the “no exercise” option is directly related to the highest concentration of metformin in plasma, compared to the other options. However, the “daily exercise” option corresponds to the lowest metformin concentrations values in plasma, hence more elimination of the drug from the circulatory system.
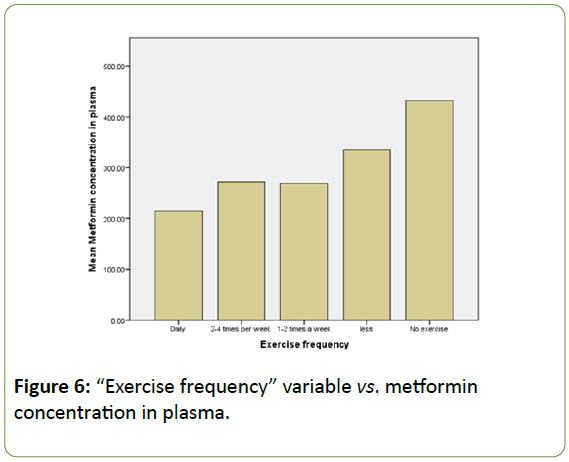
Figure 6: “Exercise frequency” variable vs. metformin concentration in plasma.
Discussion
Our results showed that the concentration of the drug is much greater in urine compared to the concentration of metformin in plasma samples. These findings shed light on the fact that metformin is almost completely eliminated from the body after around 12 hours of the pill administration. The discrepancy seen within the results might be due to many factors, such as participants taking the metformin pill after the blood test, or patients who forgot to take the pill the previous day leading to low plasma circulating levels and variably high urine levels. Also, the time of sample collection could have contributed to the previous finding. Urine and plasma samples were collected at a specific time of the day: from 7.30 till 11.30 in Saint Georges Hospital laboratories. Hence, we might assume that most of the patients took the pill more than 12 hours prior to sampling and the plasma concentrations are relatively low having a unit of ng/ml [17]. Similar findings for plasma levels were obtained from a study conducted by Christensen et al. 2011 where the levels of metformin ranged from 54 to 4133 ng/ml [18]. In addition, according to a study conducted by Chung et al. the levels of metformin in plasma from dosing to 12 hours post-dose turned out to be between 3160.4 and 8808.2 h·μg/L [19]. Furthermore, according to a study conducted by Frid et al. The results of metformin measurement showed that the values fall between 0.05 and 125 μmol/l [20].
More studies should be conducted to rule out any effect of the drugs on metformin effect or drug-drug interactions that might affect metformin’s mode of action or pharmacokinetic properties [21]. Besides, this study showed that most of the participants have complications other than diabetes and are taking treatments and medications along with metformin. This idea made us think that these complications might have an effect on metformin levels in the human body [22]. However no significant associations were detected. Also, we can notice that most of the participants do not smoke or drink alcohol which might affect the drug activity as discussed previously. This factor is also related to the patients’ age since we are dealing mostly with elderly people.
When it comes to kidney problems, most of the participants have normal kidney function and the statistical analysis results did not show any correlation between metformin concentrations in plasma or urine and kidney function indicators (Creatinine and eGFR). This outcome contradicts the finding of a study conducted by Hsu et al. which shows that eGFR values are lower in patients who discontinued metformin treatment compared to the patients who were taking metformin for a period of 100 days. Hsu et al. concluded that metformin could have an effect on patients with moderate kidney problems [23]. On the other hand, many studies suggest that metformin do not have adverse effects on diabetic patients with moderate kidney problems [24].
On the other hand, Figure 6 showed a discrepancy between active and sedentary patients when it comes to metformin concentration in plasma. The latter may be due to the increased metabolism and circulation in patients who exercise on a daily basis. Hence we can say that metformin may be eliminated at a faster rate compared to patients having a more sedentary lifestyle.
Giving to the results of the statistical analysis, metformin concentration in plasma is not associated with dose frequency. According to Figure 4, the histogram shows a clear discrepancy in association between these metformin concentration in plasma and dose frequency. However, analysis showed a strong association between metformin concentration in urine and dose frequency.
Accordingly, we can say that metformin concentrations in urine are linearly associated with the dose administered: the higher the dose of Metformin administered, the higher the concentration of the drug found in urine. Another association obtained after statistical analysis is metformin concentration in plasma vs. weight. Hence, we might say that weight is linearly associated with the concentration of metformin in blood and we should take this finding into consideration when deciding on the drug dosages. To summarize, metformin concentration is linearly correlated with 3 major variables: weight (p-value 0.044), use of anti-lipids medications (p-value 0.032) and daily dose of metformin (p-value<0.01). However, after regression analysis, the effect of use of antilipemic agents faded away.
Hence, this finding could be used as a medical reference for physicians by measuring metformin concentration in urine to follow up on their patients and check their medical compliance by making sure that they are actually taking their treatment. However, metformin concentration in plasma cannot be used for this medical purpose.
Conclusion
To conclude, this research showed two correlations: the concentration of metformin in urine vs. dose and the concentration of metformin in plasma vs. patient’s weight.
The first association may be used as a clinical marker of patients’ compliance to the treatment. However, the remaining patient related variables such as gender, other medications, kidney function, timing of metformin intake, dosage, duration since metformin intake, HBA1C, smoking and alcohol intake, do not significantly affect metformin, since no association was detected. This study is a starting point for personalized medicine when it comes to metformin treatment and dosages optimization. Also, further research should be carried out with a molecular level approach.
Author’s Contributions
All authors participated in the design and analysis of the study. JAA and MB searched the databases, and wrote the article. MB, CS, JI, MM, KAB reviewed proposal development activities and each drafts of the result article. NH contributed in the sample collection procedure. EA contributed in the sample collection by providing appropriate training and guidance for this step.
Acknowledgements
I would like to express my sincere gratitude to my advisor Dr. Marcel Bassil for his continuous support, for his patience, motivation, enthusiasm, and immense knowledge. I would like to thank also my co-advisor: Mr. Moussa Moussa, Dr. Jihad Irani and Dr. Carla Sawan for all their guidance through this process; their discussion, ideas and feedback have been absolutely invaluable. I would like to thank Dr. Edmond Abboud and Dr. Noha Hakime for their support in the study. I would like to express my gratitude to Mrs. Karine Al Badawi who provided insight and expertise that greatly assisted the research. I also would like to thank my family and friends for supporting me spiritually throughout my life.
23579
References
- Ganie MA, Kotwal S (2012) Recent advances in management of diabetes mellitus. JIMSA 25: 171-75.
- Donath MY, Shoelson SE (2011) Type 2 diabetes as an inflammatory disease. Nat Rev Immunol 11: 98-107.
- Hirst JA, Farmer AJ, Ali R, Roberts NW, Stevens RJ (2012) Quantifying the effect of metformin treatment and dose on glycaemic control. Diabetes Care 35: 446-454.
- Holman R (2007) Metformin as first choice in oral diabetes treatment: the UKPDS experience. Journ Annu Diabetol Hotel Dieu: 13-20.
- Proctor WR, Bourdet DL, Thakker DR (2008) Mechanisms underlying saturable intestinal absorption of metformin. Drug Metab Dispos 36: 1650-1658.
- Yahdiana-Harahap, Santi P, Hayun H, Krisnasari D, Mahi W, et al. (2011) Bioequivalence study of metformin HCl XR caplet formulations in healthy indonesian volunteers. J Bioequiv Availab 3: 016-019.
- Pollak M (2010) Metformin and other biguanides in oncology: advancing the research agenda. Cancer Prev Res (Phila) 3: 1060-1065.
- Nasri H, Rafieian-Kopaei M (2014) Metformin: Current knowledge. J Res Med Sci 19: 658-664.
- Garber AJ, Duncan TG, Goodman AM, Millus DJ, Rohlf JL (1997) Efficacy of metformin in type 2 diabetes: results of a double-blind, placebo-controlled, dose-response trial. Am J Med 103: 491-497.
- Faure P, Wiernsperger N, Polge C, Favier A, Halimi S (2008) Impairment of the antioxidant properties of serum albumin in patients with diabetes: protective effects of metformin. Clin Sci 114: 251-256.
- Rafieian-Kopaei M, Baradaran A (2013) Combination of metformin with other antioxidants may increase its renoprotective efficacy. J Renal Inj Prev 2: 35-36.
- Schwartz SL, Gordi T, Hou E, Cramer M, Heritier M, et al. (2008) Clinical development of metformin extended-release tablets for type 2 diabetes: an overview. Expert Opin Drug Metab Toxicol 4: 1235-1243.
- Gabr RQ, Padwal RS, Brocks DR (2010) Determination of metformin in human plasma and urine by high-performance liquid chromatography using small sample volume and conventional octadecyl silane column. J Pharm Pharm Sci 13: 486-494.
- Tucker GT, Casey C, Phillips PJ, Connor H, Ward JD, et al. (1981) Metformin kinetics in healthy subjects and in patients with diabetes mellitus. Br J Clin Pharmacol 12: 235-246.
- Christensen MM, Brasch-Andersen C, Green H, Nielsen F, Damkier P, et al. (2011) The pharmacogenetics of metformin and its impact on plasma metformin steady-state levels and glycosylated hemoglobin A1c. Pharmacogenet Genomics 21: 837-850.
- Chung H, Oh J, Yoon SH, Yu K, Cho J, et al. (2018) A non-linear pharmacokinetic-pharmacodynamic relationship of metformin in healthy volunteers: An open-label, parallel group, randomized clinical study. PLOS ONE 13: e0191258.
- Frid A, Sterner GN, Londahl M, Wiklander C, Cato A, et al. (2010) Novel assay of metformin levels in patients with type 2 diabetes and varying levels of renal function. Diabetes Care 33: 1291.
- Stage TB, Brosen K, Christensen MM (2015) A comprehensive review of drug-drug interactions with metformin. Clin Pharmacokinet 54: 811-824.
- Minematsu T, Giacomini KM (2011) Interactions of tyrosine kinase inhibitors with organic cation transporters and multidrug and toxic compound extrusion proteins. Mol Cancer Ther 10: 531-539.
- Hsu WH, Hsiao PJ, Lin PC, Chen SC, Lee MY, et al. (2017) Effect of metformin on kidney function in patients with type 2 diabetes mellitus and moderate chronic kidney disease. Oncotarget 9: 5416-5423.
- Bell S, Farran B, McGurnaghan S, McCrimmon RJ, Leese GP, et al. (2017) Risk of acute kidney injury and survival in patients treated with Metformin: an observational cohort study. BMC Nephrology 18: 163.