Keywords
Brain-stem; Cortisol; fMRI; Hypothalamus; Mental/Motor task
Introduction
Cognitive fatigue arises from prolonged exposure to the demands of a task that require continued mental efficiency [1]. Such tasks often give rise to the cortisol stress-response within the hypothalamic-pituitary-adrenal (HPA) axis.
Cortisol and fatigue
The link between fatigue and cortisol is dependent upon chronic or acute stress; with chronic fatigue syndrome being linked with cortisol level fluctuations [1].
Fatigue manipulation is usually achieved using neuropsychological tasks to generate cognitive exhaustion, or by introducing either motor (physical) or mental (psychological) stimuli to cause stressful conditions.
Cortisol regulation is the domain of the central nervous system where binding occurs with limbic system receptors, hippocampus (HC), amygdala (AG), and prefrontal cortex (PFC) [2,3] (Figure 1).
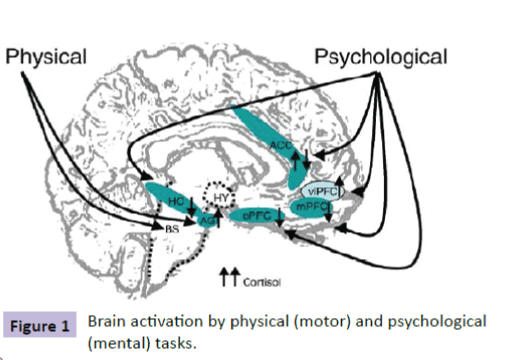
Figure 1: Brain activation by physical (motor) and psychological (mental) tasks.
Levels of cortisol secretion and the brain regions activated are dependent upon the stressor factors being of either “motor” (physical) or “mental” (psychological). Diverse neuroimaging and animal studies on brain activity changes in response to stressors suggest contribution of the brainstem in physical stress, while psychological stressors tend to engage limbic system regions such as the HC, the AG, and the PFC in regulating the HPA axis.
Dedovic and colleagues [4] found significant interaction between cortisol release and fatigue in the right hippocampus with significantly decreased activation over time. This region is responsible for short-term changes in cortisol in association with levels of fatigue.
The amygdala is important in regulating glucocorticoid secretion during the stress response [5]; and adjusts vigilance levels whether positive or negative in nature [6].
Prefrontal cortex and its specific components (orbitofrontal PFC, ventrolateral PFC and medial PFC) emerge as candidates for the processing of the stress response and cortisol regulation. Decreased activity in orbitofrontal PFC has been demonstrated with increased cortisol secretion in response to a psychological stress task [7,8].
Similarly, increased activity in medial PFC regions correlates with decreased cortisol secretion [9], because projections emanate from the ventrolateral PFC towards the HC. This mechanism could allow ventrolateral PFC to decrease activity in orbital and medial PFC areas related to stress processing since this inappropriate control level could be associated with sustained cortisol secretion.
Yawning and cortisol
Hippocrates, the famous philosopher, writing in 400 BC in his book, De Flatibus Liber (A Treatise on Wind), wrote that large quantities of air are exposed during yawning like steam escaping from hot cauldrons as temperature rises dramatically [10]. His theory was interesting since we need to protect against critical rises in brain temperature, particularly when we are fatigued [11,12]. In multiple sclerosis (MS), fatigue is a common symptom [13-15] and this may be related to yawning excessively with high rises in brain temperature [16-18].
It is known that the pituitary gland oxytocin regulates social bonding, and circadian rhythm and temperature regulation is the responsibility of the hypothalamus [19]. Together with the adrenal glands, they control the maintenance of hormones within the HPA-axis to prepare the body for exercise and to protect the body from stressors [20-22].
Thompson [12] has found a link between yawning excessively and neurological diseases; Lano-Peixoto, and colleagues [23] have also noted excessive yawning in their five patients who has neuromyelitis optica spectrum disorder (NMOSD). From MRI brain scans, their patients shoed lesions in the brain-stem and hypothalamus, with the conclusion that yawning may be a neglected (but not a rare symptom) of NMOSD. Similarly adrenal insufficiency and Parkinson’s disease is associated with excessive yawning [24]; possibly, due to an irregularity in the level of hormones within the HPA-axis.
The first evidence based announcement of the link between yawning and cortisol was made by Thompson [25] in his Thompson Cortisol Hypothesis and describes the rise in cortisol, produced by the adrenal cortex zona fasciculate yawning to control brain temperature.
The British neurologist, Sir Francis Walshe, reported to his stroke patients in 1923. He noted that those with brain-stem lesions, had the capacity to raise their paralyzed arm when yawning [26]. This has since been evidenced by a number of other researchers (Walusinski, et al., Kang & Dhand) [27,28].
It is probable that there is a critical threshold for the level of cortisol before yawning occurs and is dependent upon fatigue, level of perception, and sleep deprivation. Communicative yawning may involve several brain regions – frontal lobes, parietal lobes, insula and amygdala [29,30]. In addition to brain fMRI studies, others have implicated the mirror-neuron system [31]; and endogenous levels of cortisol have implicated in pathological gamblers where striatal sensitivity fluctuates [32].
Materials and Methods
Participants
13 healthy participants (6 male, 7 female) aged between 21- 35 years with no known history of neurological, psychiatric or sensorimotor disorders gave their prior, written, informed consent to participation in the study. Participants were assessed using the Edinbrgh inventory [33] for right-handedness, and with consent, were recruited at ‘Hôpital Universitaire Amiens and Julues Verne Université de Picardie, France.
Paradigm
Saliva samples were collected at the start and again at the end of the condition from each participant. Each sample was analyzed and destroyed after analysis. Data was held securely and coded to ensure anonymity of participants. Cortisol levels are easily and reliably measured in saliva and it is far less intrusive than intravenous collection methods. Presence of cortisol in saliva is highly correlated with blood assay and cheaper to analyze in the specialized laboratory.
Participants are randomly allocated to one of two conditions: mental task (intrinsic or extrinsic) or motor (physical) task. Inside the fMRI scanner, the participant was presented with a slide that states "The experience will begin. Do not move your head, and pay attention to all instructions." The protocol was programmed so that the transition from the first slide to the second is performed manually by pressing the keyboard space bar in synchronism with the start of fMRI.
The second slide lasted 12s with the instruction: "Read all instructions carefully and practice fast and accurate pressures without moving your head.” Apart from the first slide, subsequent slides were programmed to automatically follow for each task.
So that fatigue set in gradually and fairly throughout the paradigm, a pseudo-random sequence was implemented for the 3 levels of strength and for each task (Table 1).
| Bloc N°1 |
T3 |
|
T1 |
|
T2 |
| Low |
Medium |
High |
High |
Medium |
Low |
Low |
High |
Medium |
| |
| Bloc N°2 |
T2 |
|
T1 |
|
T3 |
| High |
Low |
Medium |
High |
Medium |
Low |
High |
Medium |
Low |
| |
| Bloc N°3 |
T3 |
|
T1 |
|
T2 |
| Medium |
High |
Low |
Low |
Medium |
High |
Medium |
Low |
High |
| |
| Bloc N°4 |
T2 |
|
T1 |
|
T3 |
| Low |
Medium |
High |
Low |
Medium |
High |
Low |
High |
Medium |
Table 1 Sequence of tasks.
The participant lay in the fMRI watching slides that appear in front of him/her. The participant was required to press the handgrip with the left hand each time the white square appears respecting the required levels of strength. The participant was instructed not to move his/her head for the duration of the acquisition and should always be focused. Before entering the fMRI, the participant was familiarized with the protocol.
The protocol included 4 repetitions of 3 blocs: T1: Motor Task; T2: Intrinsic Task without Warning signal; T3: Extrinsic Task with warning signal. In Task 1 (motor), the instruction lasted 6s and specifies the level of force to execute: "Press with HIGH STRENGTH, quietly and fixing the flashing square". Alternation between the image of a white square and the image of a black screen, followed. The duration of each of these two images was 100 ms (Table 2).
| T1 High |
Press with HIGH STRENGTH, quietly and fixing the flashing square |
 |
 |
| T1 Medium |
Press with MEDIUM STRENGTH, quietly and fixing the flashing square |
 |
|
| T1 Mild |
Press with MILD STRENGTH, quietly and fixing the flashing square |
 |
|
| Duration (ms) |
6000 |
100 |
100 |
Table 2 Tasks.
In Task 2 (intrinsic without warning signal), the task began with a statement that lasted 6s: "Press as soon as possible as soon as the square appears and release quickly." A cross and a white square, followed (Figure 2 and Table 3).
| T2 High |
High strength |
 |
 |
 |
Duration |
| 1500 |
1750 |
280 |
1000 |
3030 |
| |
1750 |
310 |
1000 |
3060 |
| |
1690 |
250 |
1000 |
2940 |
| |
1720 |
250 |
1000 |
2970 |
| |
1720 |
310 |
1000 |
3030 |
| |
1690 |
280 |
1000 |
2970 |
| |
1720 |
280 |
1000 |
3000 |
| T2 Medium |
Medium strength |
 |
 |
 |
Duration |
| 1500 |
1720 |
250 |
1000 |
2970 |
| |
1690 |
310 |
1000 |
3000 |
| |
1750 |
280 |
1000 |
3030 |
| |
1750 |
310 |
1000 |
3060 |
| |
1720 |
280 |
1000 |
3000 |
| |
1690 |
250 |
1000 |
2940 |
| |
1690 |
310 |
1000 |
3000 |
| T2 Mild |
Mild strength |
|
|
|
Duration |
| 1500 |
1720 |
250 |
1000 |
2970 |
| |
1690 |
280 |
1000 |
2970 |
| |
1750 |
250 |
1000 |
3000 |
| |
1750 |
310 |
1000 |
3060 |
| |
1690 |
250 |
1000 |
2940 |
| |
1720 |
310 |
1000 |
3030 |
| |
1750 |
280 |
1000 |
3030 |
Table 3 Order of T2 tasks.
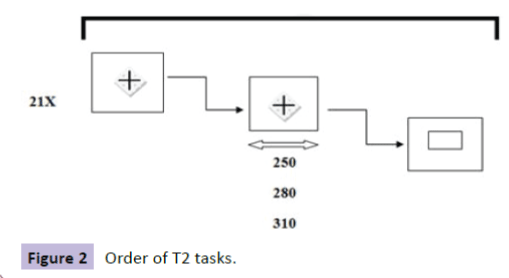
Figure 2: Order of T2 tasks.
In Task 3 (extrinsic with warning signal), the task began with an instruction that lasted 6s: "The cross will turn off, Concentrate. Press as soon as possible as soon as the square appears and release quickly." A cross, a black screen, and a white square, followed (Figure 3 and Table 4). Summary of sequences is shown in Figure 4 and Table 5.
| T3 High |
High strength |
|
|
|
|
Duration |
| 1500 |
1350 |
400 |
310 |
1000 |
3060 |
| |
1350 |
400 |
280 |
1000 |
3030 |
| |
1290 |
400 |
250 |
1000 |
2940 |
| |
1320 |
400 |
250 |
1000 |
2970 |
| |
1320 |
400 |
310 |
1000 |
3030 |
| |
1290 |
400 |
280 |
1000 |
2970 |
| |
1320 |
400 |
280 |
1000 |
3000 |
| T3 Medium |
Medium strength |
|
|
|
|
Duration |
| 1500 |
1350 |
400 |
280 |
1000 |
3030 |
| |
1290 |
400 |
310 |
1000 |
3000 |
| |
1320 |
400 |
250 |
1000 |
2970 |
| |
1350 |
400 |
310 |
1000 |
3060 |
| |
1290 |
400 |
310 |
1000 |
3000 |
| |
1290 |
400 |
250 |
1000 |
2940 |
| |
1320 |
400 |
280 |
1000 |
3000 |
| T3 Mild |
Mild strength |
|
|
|
|
Duration |
| 1500 |
1350 |
400 |
280 |
1000 |
3030 |
| |
1350 |
400 |
250 |
1000 |
3000 |
| |
1290 |
400 |
280 |
1000 |
2970 |
| |
1290 |
400 |
250 |
1000 |
2940 |
| |
1350 |
400 |
310 |
1000 |
3060 |
| |
1320 |
400 |
310 |
1000 |
3030 |
| |
1320 |
400 |
250 |
1000 |
2970 |
Table 4 Order of T3 tasks
| Total Duration of the protocol: 15min 17s 76ms |
| Boot set = 12s |
| SetsT3/T2 = 6s * 8 = 48s |
| Sets T1 = 6s * 12 = 72s |
| Images T3/T2= 1.5s * 24 = 36s (High, Medium, Low strength ) |
| Blocs T1 = 21 * 12 = 245.76s |
| Blocs T2 = 21 * 12 = 252s |
| Blocs T3 = 21 * 12 = 252s |
Table 5 Summary of timings
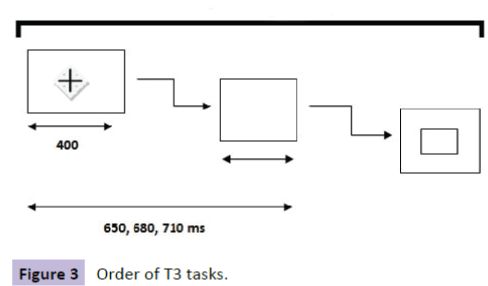
Figure 3: Order of T3 tasks.
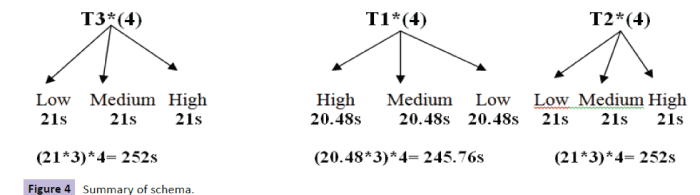
Figure 4: Summary of schema.
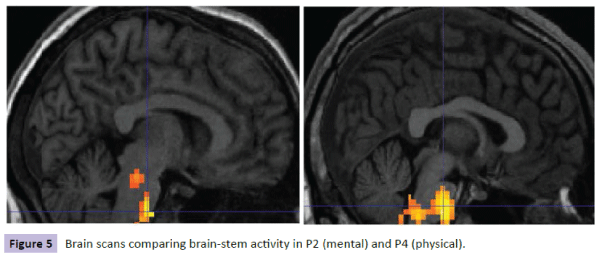
Figure 5: Brain scans comparing brain-stem Figure 5 activity in P2 (mental) and P4 (physical).
Results
Mean age of participants was 26.4 years (sd = 4.70); standard range from cortisol is (i) morning collection: 3.7 – 9.5 Nano grams (one billionth of a gram or 10-9) per milliliter of saliva; (ii) noon collection: 1.2 – 3.0 Nano grams per milliliter; (iii) evening collection: 1.9 Nano grams per milliliter.
In saliva cortisol sample 1, the means for participants in the mental condition was 7.0 (sd = 7.21), and for the physical condition was 2.6 (sd = 0.74). In sample 2, the means were 5.6 (sd = 5.56) for those in the mental condition, and 2.5 (sd = 0.83) for those in the physical condition. Hence, those in the mental condition had higher levels of resting and post-experiment saliva cortisol levels than those in the physical condition (Table 6).
| P |
M/F |
AGE |
S1 |
S2 |
PERIOD |
MentPhys |
| P1 |
M |
34 |
2.3 |
2.3 |
Morning |
P |
| P2 |
F |
30 |
2.6 |
2.3 |
Noon |
M |
| P3 |
M |
35 |
4.5 |
4.0 |
Morning |
M |
| P4 |
M |
27 |
1.9 |
1.9 |
Noon |
P |
| P5 |
F |
23 |
3.6 |
6.9 |
Noon |
M |
| P6 |
F |
21 |
2.8 |
3.1 |
Noon |
P |
| P7 |
F |
21 |
5.9 |
3.6 |
Morning |
M |
| P8 |
F |
29 |
4.0 |
1.6 |
Noon |
P |
| P9 |
M |
23 |
22.7 |
17.7 |
Morning |
M |
| P10 |
F |
27 |
2.2 |
3.8 |
Morning |
P |
| P11 |
M |
25 |
1.8 |
2.0 |
Noon |
M |
| P12 |
F |
27 |
2.5 |
2.1 |
Evening |
P |
| P13 |
M |
21 |
7.6 |
3.0 |
Morning |
M |
Key:S1, S2 = cortisol saliva sample 1, 2; MentPhys = Mental (M), Physical (P)
Table 6 Cortisol level of all participants
Using Paired Samples Test, there were significant correlations between saliva cortisol sample 1 and sample 2 (p=0.000) (Table 7) but not when comparing means (p=0.247) (Table 8). There were significant correlations between samples in the mental condition (p=0.002) (Table 9) but not for those in the physical condition (P=0.469) (Table 10). Means testing did not reveal differences between samples in either condition (Tables 11 and 12).
| Paired Samples Correlations |
| |
N |
Correlation |
Sig. |
| Pair 1 |
Sample1 & Sample2 |
13 |
0.925 |
0 |
Table 7 All participants – correlation of S1 compared with S2.
| Paired Samples Test |
| |
Paired Differences |
t |
df |
Sig. (2-tailed) |
| Mean |
Std. Deviation |
Std. Error Mean |
95% Confidence Interval of the Difference |
| Lower |
Upper |
| Pair 1 |
Sample1 –Sample2 |
0.77692 |
2.29933 |
0.63772 |
-0.61255 |
2.16639 |
1.218 |
12 |
0.247 |
Table 8 All participants – means of S1 compared with S2.
| Paired Samples Correlations |
| |
N |
Correlation |
Sig. |
| Pair 1 |
Sample1 & Sample2 |
7 |
0.929 |
0.002 |
Table 9 Mental condition – correlation of S1 compared with S2.
| Paired Samples Correlations |
| |
N |
Correlation |
Sig. |
| Pair 1 |
Sample1 & Sample2 |
6 |
-0.371 |
0.469 |
Table 10 Physical condition - correlation of S1 compared with S2.
| Paired Samples Test |
| |
Paired Differences |
t |
df |
Sig. (2-tailed) |
| Mean |
Std. Deviation |
Std. Error Mean |
95% Confidence Interval of the Difference |
| Lower |
Upper |
| Pair 1 |
|
1.31429 |
2.90484 |
1.09793 |
-1.3722 |
4.00081 |
1.197 |
6 |
0.276 |
| Sample1 – Sample2 |
Table 11 Mental condition – means of S1 compared with S2.
| Paired Samples Test |
| |
Paired Differences |
T |
df |
Sig. (2-tailed) |
| Mean |
Std. Deviation |
Std. Error Mean |
95% Confidence Interval of the Difference |
| Lower |
Upper |
| Pair 1 |
Sample1 – Sample2 |
0.15 |
1.29885 |
0.53025 |
-1.2131 |
1.51305 |
0.283 |
5 |
0.789 |
Table 12 Physical condition - means of S1 compared with S2.
Brain scans for each participant were reviewed with the following results. For participants with the lowest level of cortisol in the mental condition (P2), there was less activity and less spread of activity in the brain-stem region compared with the corresponding participant in the physical condition (P4) (Figure 5). Similar results were shown for these participants on comparing hypothalamus activity (Figure 6). However, when comparing participants with the highest levels of cortisol in both conditions, P9 (mental) had a wider spread of activity in the brain-stem region corresponding physical condition participant P10 (Figure 7).
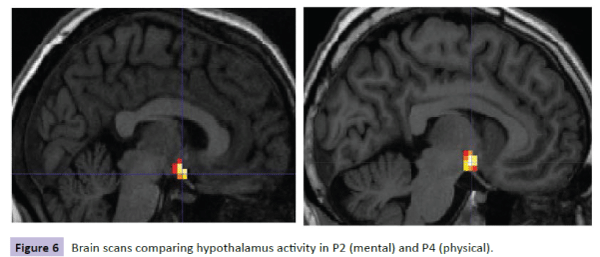
Figure 6: Brain scans comparing hypothalamus activity in P2 (mental) and P4 (physical).
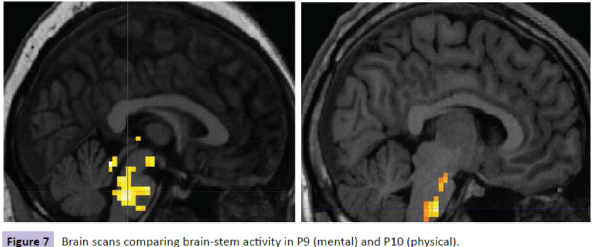
Figure 7: Brain scans comparing brain-stem activity in P9 (mental) and P10 (physical).
Comparison of participants’ brain scans between the two conditions, as an average across participants, revealed more spread of activity across the brain-stem and hypothalamus regions in the mental condition; however, this might be skewed in favor of the high cortisol levels found in the mental condition participants, particularly P9 (22.7) (Figure 8).
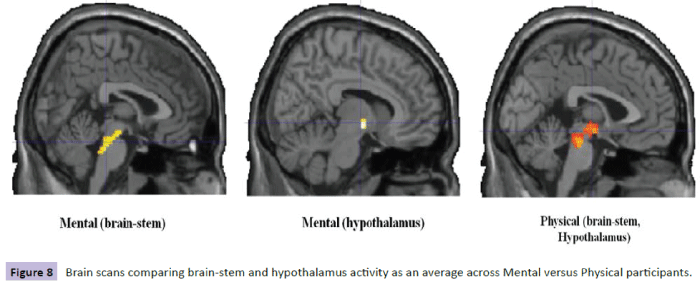
Figure 8: Brain scans comparing brain-stem and hypothalamus activity as an average Figure 8 across Mental versus Physical participants.
Discussion
Findings of this study are consistent with the action of cortisol on specific brain regions including the hypothalamus. I the physical condition, participants showed lower changes in cortisol and fewer changes than compared with the mental condition. This might be due to the effort involved in the mental task as compared with the physical task.
Participants with lower levels of cortisol and with smaller (or no) changes in level of cortisol, were found in the physical condition. In contrast, greater changes, often in reduction of levels, were found in the mental condition, signifying greater demands of the mental task as compared with the physical task. Hence, if the mental task was perceived by the participants as being stressful, this might explain the higher levels of cortisol; although the actual exertion is lower than in the physical condition and is seen by a reduction in levels after completion of the mental task.
In terms of cortical activity, the brain-stem and hypothalamus regions appear to be more active during the physical condition at low levels of cortisol but the activity is more widespread in the brain-stem region in the mental condition at higher levels of cortisol in participants.
Therefore, it would seem that participants in the mental condition have the greatest reductions in their cortisol levels during the mental task but when their levels are particularly high (e.g. P9) then there is greater spread of cortical brain-stem activity. In the physical condition, the level of cortisol activity is greater during the task in the brain-stem region and hypothalamus. However, this activity seems to be less spread when the cortisol levels were highest (e.g. P10).
These findings suggest that the mental task is more initially demanding on cortisol levels which reduce during the task; and when cortisol levels have reached a higher point (e.g. 22.7 for P9) then they activate more widely the brain-stem region as compared with the physical task which requires less demand on cortisol but more cortical brain-stem and hypothalamus activity.
The results of this study are intriguing because they might explain the role of cortisol as a hormone that protects against stressful situations. It is known that cortisol is enlisted to cope with the demands of a perceived stressful task, as in the mental condition. This is demonstrated by the high levels of cortisol found in the mental condition participants. At the highest levels of cortisol, the brain-stem region has a wider spread of activity; and in the less demanding physical condition, less cortisol is enlisted but there is a wider spread of cortical brain-stem activity.
It would seem that cortisol works in two ways: for mental tasks, the demand for cortisol is high but recruitment of brain regions is lower than for physical tasks where the demands on cortisol levels are lower, consistent with elite athletes where cortisol activity is lowered with more training and possibly, more brain regions are recruited with an increase in skills set [34-36].
Averaging brain scan results across participants revealed that overall, recruitment of brain region activity is slightly greater than in the physical condition. Since the greater level of cortisol was found in the mental condition, it is likely that this contributed to the resultant average. However, it supports further the case that great recruitment of brain regions is seen in the mental condition where cortisol levels diminish and in participants who have the greatest reduction in levels during the task.
Potential application of these findings is in the diagnosis of neurological diseases such as immune suppression syndromes where cortisol is important for good health maintenance. Diffusion Tensor Imaging (DTI) and Voxel-Based Morphometry (VBM) [37,38] is a useful tool for identifying atrophy in brain regions in neurological disease.
For example, in multiple sclerosis, grey matter atrophy occurs as a regional versus global process [39,40]. This study shows that the recruitment of brain regions changes with cortisol level and the type of task being carried out. It is possible that atrophy causes cortisol levels to change in these brain regions.
Conclusions
Clinical scientists are particularly interested in cortisol because of its role in the HPA-axis. The implications of cortisol in tasks and in association with yawning, makes it intriguing and important to neurologists, neuroscientists and practitioners because of the potential benefits of findings to neurological patients. Identifying threshold levels of cortisol and the recruitment of brain region activity may be important in determining future functioning deficits and neuronal damage.
Implications of these findings are potentially far reaching. For example, if known parameters of cortisol levels can be established across varying conditions, then they can become indicative of poor performance. Perhaps more interesting is the possibility that these findings might point towards a new biomarker of neurological disease where cortisol is particularly salient, such as in multiple sclerosis or Cushing’s disease.
Acknowledgements
We are grateful to all participants involved in this study and for the continued use of facilities at the University Hospitals.
9199
References
- Silverman MN, Heim CM, Nater UM, Marques AH, Sternberg EM (2010) Neuroendocrine and immune contributors to fatigue. PubMed Res 2: 338-346.
- Feldman S, Weidenfeld J (1995) Neural mechanisms involved in the corticosteroid feedback effects on the hypothalam0-pituitary-adrenocortical axis. Prog. Neurobiol 45: 129-141.
- Herman JP, Ostrander MM, Mueller NK, Figueiredo H (2005) Limbic system mechanisms of stress regulation: hypothalamo-pituitary-adrenocortical axis. Prog. Neuropsychopharm. Biol Psych 29: 1201-1213.
- Dedovic K, Duchesne A, Andrews J, Engert V, Pruessner JC (2009) The brain and the stress axis: the neural correlates of cortisol regulation in response to stress. NeuroImage 47: 864-871.
- Jankord R, Herman JP (2008) Limbic regulation of hypothalamo-pituitary- adrenocortical function during acute and chronic stress. Ann New York AcadSci 1148: 64-73.
- Davis M, Whalen PJ (2001) The amygdala: vigilance and emotion. Mol Psych 6: 13-34.
- Pruessner JC, Baldwin MW, Dedovic K, Renwick R, Mahani NK, et al. (2005) Self-esteem, locus of control, hippocampal volume, and cortisol regulation in young and old adulthood. Neuroimage 28: 815-826.
- Wang J, Rao H, Wetmore GS, Furlan PM, Korczykowski M, et al. (2005) Perfusion functional MRI reveals cerebral blood flow pattern under psychological stress. ProcNatlAcadSci 102: 17804-17809.
- Kern S, Oakes TR, Stone CK, McAuliff EM, Kirschbaum C, et al. (2008) Glucose metabolic changes in the prefrontal cortex are associated with HPA axis response to a psychosocial stressor. Psychoneuroendocrin 33: 517-529.
- Vigier MJ (1620) (translated by) Les aphorismesd’Hippocrate. J-A Huguetan, Lyon, France.
- Gallup AC, Gallup Jr GG (2007) Yawning as a brain cooling mechanism: Nasal breathing and forehead cooling diminish the incidence of contagious yawning. EvolPsychol 5: 92-101.
- Thompson SBN (2010) The dawn of the yawn: is yawning a warning? Linking neurological disorders. Med Hyp 75: 630-633.
- Chalder T, Berelowitz G, Pawlikowska T, Watts L, Wessely S, et al. (1993) Development of a fatigue scale. J. Psychosom Res 37: 147-153.
- Branas P, Jordan R, Fry-Smith A, Burls A, Hyde C (2000) Treatments for fatigue in multiple sclerosis: a rapid and systematic review. Health Technol Assess 4: 27.
- Fleming WE, Pollak CP (2005) Sleep disorders in multiple sclerosis. SemNeurol 25: 64-68.
- Massen JJM, Dusch K, Eldakar OT, Gallup AC (2014) A thermal window for yawning in humans: yawning as a brain cooling mechanism. PhysiolBehav 130: 145-148.
- Thompson SBN, Simonsen M (2015) Yawning as a new potential diagnostic marker for neurological diseases. J NeurolNeursci 6: 1-6.
- Gallup AC, Church AM (2015) The effects of oxytocin on contagious yawning. NeurosciLett 607: 13-16.
- Thompson SBN (2015) Pathways to yawning: making sense of the Thompson Cortisol Hypothesis. Med Res Arch 3: 1-7
- Thompson SBN, Richer S (2015) How yawning and cortisol regulates the attentional network. J. Neurosci Rehab 2: 1-9.
- Ulrich-Lai YM, Herman JP (2009) Neural regulation of endocrine and autonomic stress response. Nat Rev Neurosci 10:397-409.
- Lana-Peixoto M, Callegaro D, Talim N, Talim LE, Pereira SAG (2014) Pathologic yawning in neuromyelitisoptica spectrum disorders. M S Rel Dis 3: 527-532.
- Schillings WJ (2008) Physiology and tests of adrenal cortisol function. Glob Lib Wom Med.
- Thompson SBN (2014) Yawning, fatigue, and cortisol: expanding the Thompson Cortisol Hypothesis. Med Hyp 83: 494-496.
- Provine R (2012) Curious behavior: yawning, laughing, hiccupping and beyond. Belknap, New York 31-32.
- Kang P, Dhand A (2015) Teaching video neuroimages: movement of a paralyzed arm with yawning. Am AcadNeurol e118.
- Walusinski O, Neau JP, Bogousslavsky J (2010) Hand up! Yawn and raise your arm. Int J Stroke 5: 21-27.
- Norscia I, Palagi E (2011) Yawn contagion and empathy in Homo sapiens. PLoS One 6: e28472.
- Platek SM, Critton SR, Myers TE, Gallup GG (2003) Contagious yawning: the role of self-awareness and mental state attribution. Cog Brain Res 17: 223-227.
- Krestel H, Weisstanner C, Hess C, Bassetti C, Nirkko A, et al. (2013) Insular and caudate lesions release abnormal yawning in stroke patients. Brain StructFunct.
- Yansong L, Sescousse G, Dreher JC (2014) Endogenous cortisol levels are associated with an imbalanced striatal sensitivity to monetary versus non-monetary cues in pathological gamblers. Front BehNeurosci 8: 1-8.
- Oldfield R (1971) The assessment and analysis of handedness: the Edinburgh inventory. Neuropsychol 9: 97-113.
- Gomes RV, Coutts AJ, Viveiros L, Aoki MS (2011) Physiological demands of match-play in elite tennis: a case study. Europ J Sport Sci 11: 105-109.
- Locke S, Osborne M, O’Rourke P (2011) Persistent fatigue in young athletes: measuring the clinical recovery and identifying variables affecting clinical recovery. Scandin J Med Sci Sports 21: 90-97.
- McLellan CP, Lovell DI, Gass GC (2011) Markers of postmatch fatigue in professional rugby league players. J Strength Condit Res 2: 1030-1039.
- Kutzelnigg A, Lucchinetti CF, Stadelmann C, Brück W, Rauschka H, et al. (2005) Cortical demyelination and diffuse white matter injury in multiple sclerosis. Brain 128: 2705-2712.
- Prinster A, Quarantelli M, Orefice G, Lanzillo R, Brunetti A, et al. (2006) Grey matter loss in relapsing–remitting multiple sclerosis: A voxel-based morphometry study. NeuroImage 29: 859-867.
- D’Souza SD, Bonetti B, Balasingam V, Cashman NR, Barker PA, et al. (1996) Multiple sclerosis: fassignalling in oligodendrocyte cell death. J Exp Med 184: 2361-2370.
- Lansley J, Mataix-Cols D, Grau M, Radua J, Sastre-Garriga J (2013) Localized grey matter atrophy in multiple sclerosis: a meta-analysis of voxel-based morphometry studies and associations with functional disability. NeurosciBiobehav Rev 37: 819-830.