Keywords
Lamivudine, Cellulose polymers, Multiple emulsions, Osmogen, Controlled release, SEM, Stability studies.
Introduction
Controlled release systems are capable of delivering substances slowly and continuously for up to several years. Micro particulate drug delivery posses many advantages such as high bioavailability, rapid kinetic of absorption as well as avoidance of hepatic first pass effect and improvement of patient compliance[1].
A Microsphere utilizing Cellulose Acetate, Ethyl Cellulose, Solvents, Sodium chloride and PVA for controlled delivery of highly water soluble drug, Lamivudine was used as a model drug because of it short plasma half life. The main objective of this study was to provide long-term therapy of AIDS with maintain systemic drug levels consistently above its target antiretroviral concentration.
Lamivudine is an active antiretroviral drug belonging to non-nucleosides reverse transcriptase inhibitor. Lamivudine treatment has gained immense popularity in the AIDS treatment in the present era2. Dosage and duration of Lamivudine therapy should be individualized according to requirement and response of the patient. The daily recommended dose is 150 mg b.i.d 3. Lamivudine is rapidly absorbed after oral administration with an absolute bioavailability of 86% ± 16%, peak serum concentration of Lamivudine (Cmax) of 1.5 ± 0.5 mcg/mL and mean elimination half-life (t½) of 5 to 7 hours, thus necessitating frequent administration to maintain constant therapeutic drug levels.
The oral administration of Lamivudine exhibits side effects in GIT as well as in CNS. Thrombocytopenia, parasthesias, anorexia, nausea, abdominal cramps, depressive disorders, cough and skin rashes etc have also been reported as possible adverse reactions4. Controlled release (CR) preparations helps to achieve maximum therapeutic effect with simultaneous minimization of adverse effects.
Therefore, the objective of the present work is to provide a long acting pharmaceutical composition containing Lamivudine in a modified release matrix formulation, to maintain the blood levels of the active ingredient for a prolonged period of time.
2.Materials and Methods:
2.1 Materials
Lamivudine was received as a gift sample from Madras Pharmaceuticals Pvt. Ltd., Chennai. Ethyl cellulose was obtained from LOBA chemicals, Kolkata, Cellulose acetate from Zydus Cadila, Ahemadabad. All other chemicals and solvents used were of analytical grade and procured from an authorized dealer, USP XXI paddle type dissolution apparatus, FT-IR (Shimadzu IR spectrophotometer, Model 840, Japan) and UV-Visible spectrophotometer (UV-1700, Shimadzu, Japan) were the instruments employed in the current study.
2.2 Method of Preparation[5]
Lamivudine microspheres were prepared by modified solvent evaporation methods using w/o/w technique. As shown in table 1, 100mg of Lamivudine were dissolved in 3 ml of distilled water to make the inner water phase and the solution was gradually poured in X gm of polymer in X ml of organic solvent (oil phase) to make a w/o emulsion. The emulsion obtained was poured into 200 ml solution of 0.5% PVA in water to make a w/o/w emulsion and continuously stirred using magnetic stirrer for 3 hrs at 600 rpm until the organic solvent evaporated leaving microspheres. Osmotic agent sodium chloride is added after 30 minutes of stirring in order to prevent osmosis. The microspheres collected by filtration and dried for 24 h at room temperature.
| Formulation code |
Drug (mg) |
Ethyl cellulose (mg) |
Methylene Chloride (ml) |
Cellulose Acetate (mg) |
Methanol & Methylene chloride(1:1) (ml) |
Drug : Polymer ratio |
Sodium chloride (gm) |
Polyvinyl alcohol (%) |
| F I |
100 |
30 |
3 |
- |
- |
1:0.3 |
1 |
0.5 |
| F II |
100 |
50 |
5 |
- |
- |
1:0.5 |
1 |
0.5 |
| F III |
100 |
70 |
7 |
- |
- |
1:0.7 |
1 |
0.5 |
| F IV |
100 |
90 |
9 |
- |
- |
1:0.9 |
1 |
0.5 |
| F V |
100 |
100 |
10 |
- |
- |
1:1.0 |
1 |
0.5 |
| F VI |
100 |
- |
- |
30 |
3 |
1:0.3 |
1 |
0.5 |
| F VII |
100 |
- |
- |
50 |
5 |
1:0.5 |
1 |
0.5 |
| F VIII |
100 |
- |
- |
70 |
7 |
1:0.7 |
1 |
0.5 |
| F IX |
100 |
- |
- |
90 |
9 |
1:0.9 |
1 |
0.5 |
| F X |
100 |
- |
- |
100 |
10 |
1:1.0 |
1 |
0.5 |
Table 1: The Different Formulation of Lamivudine Microspheres and their Composition Data
3.Charactrisation Of Microspheres
3.1 Particle size measurement[6]
The size of the prepared microspheres was measured by the optical microscopy method using a calibrated stage micrometer. Particle size was calculated by using equation
Xg = 10 x [(ni x log Xi) / N] ……..(2)
Where
Xg is geometric mean diameter,
ni is number of particle in range,
Xi is the mid point of range and
N is the total number of particles.
All the experimental units were analyzed in triplicate form (n=3) and data’s were given in Table 2 and Fig.1.
| Formulation code |
Mean Particle Size (µm) X ± S.D |
Yield (%) |
Encapsulation Efficiency X ± S.D |
| F I |
29.18 ± 0.027 |
25.13 ± 0.017 |
31.33 ± 0.12 |
| F II |
23.51 ± 0.014 |
42.62 ± 0.014 |
57.61± 0.23 |
| F III |
33.93 ± 0.22 |
74.32 ± 0.011 |
79.03 ± 0.14 |
| F IV |
41.36 ± 0.016 |
97.56 ± 0.023 |
98.61 ± 0.22 |
| F V |
37.22 ± 0.021 |
92.23 ± 0.019 |
93.23 ± 0.14 |
| F VI |
28.69 ± 0.015 |
23.11 ± 0.021 |
29.05 ± 0.31 |
| F VII |
34.51 ± 0.019 |
35.27 ± 0.031 |
50.14 ± 0.15 |
| F VIII |
23.78 ± 0.031 |
68.71 ± 0.015 |
82.03 ± 0.19 |
| F IX |
38.85 ± 0.015 |
91.13 ± 0.012 |
90.05 ± 0.17 |
| F X |
35.51 ± 0.011 |
85.13 ± 0.032 |
84.14 ± 0.26 |
Table 2: The Characteristic data’s of different Lamivudine microsphere formulations.
3.2 Determination of drug content[6]
Drug content of microspheres was determined by UV-Vis spectrophophotometer (Shimadzu UV 1700). The weighed amounts (100 mg) of drug-loaded polymer microspheres were powdered and suspended in 100 ml methanol: water (1:99 v/v) solvent system. The resultant dispersion was kept for 20 min for complete mixing with continuous agitation and filtered through a 0.45 μm membrane filter. The drug content was determined spectrophotometrically (UV-Visible-1700, Shimadzu, Japan spectrophotometer) at 270 nm.
3.3 Drug entrapment efficiency (DEE) and Percentage Yield [6]
Drug loaded microspheres were evaluated for percentage yield and the drug entrapment efficiency (DEE). The percentage yield was calculated by the equation
* Percentage yield =Weight of microsphere recovered / Weight (drug + polymer) X 100 …….. (1)
Drug entrapment efficiency was calculated by the equation
* DEE = (Pc / Tc) X 100 …………….. (2)
Where - Pc is practical content, Tc is the theoretical content
All the formulations were analyzed in triplicate form (n=3) and data’s were given in Table 2 and Fig.1.
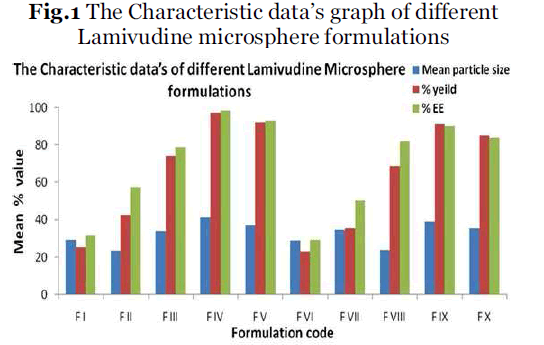
Fig.1 The Characteristic data’s graph of different
3.4 Fourier Transforms Infrared Radiation measurement (FT-IR) [7]
The FT-IR spectra acquired were taken from dried samples for incompatible study. An FT-IR (Thermo Nicolet 670) spectrometer was used for the analysis in the frequency range between 4000 and 400 cm-1, and 4 cm-1 resolution. The results are the means of 16 determinations as shown in Fig 2. A quantity equivalent to 2 mg of pure drug and drug loaded microcapsules were used for FT – IR analysis.
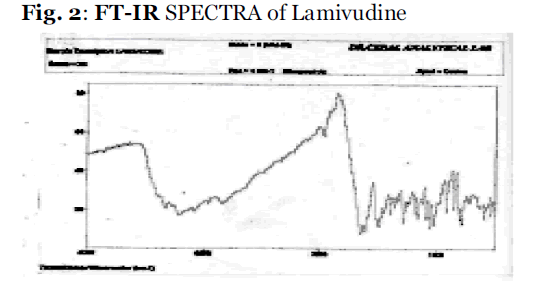
Fig.2: FT-IR SPECTRA of Lamivudine.
3.5 Scanning electron microscopy (SEM) [8]
Morphological characterization of the microcapsules was carried out by using scanning electron microscopy (JEOL JSM -5200) under higher and lower resolution. The dried samples were coated with gold palladium of 200A° thickness under argon atmosphere of gold coating prior to microscopy evaluation. The results of best formulation FIV on different magnification was shown in Fig 3 series.
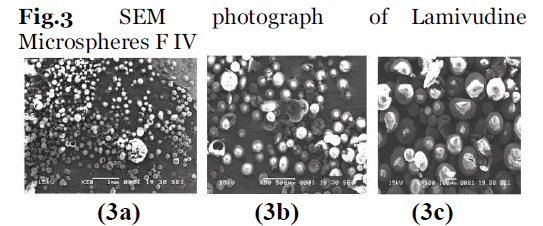
Fig.3: SEM photograph of Lamivudine Microspheres F IV.
3.6 In Vitro Drug Release Studies [9]
In vitro dissolution studies were performed using USP type I dissolution apparatus (LABINDIA, DISSO-2000, Mumbai, India) at 50 rpm. The microspheres were weighed and filled in the empty capsule shells and placed in the basket. The dissolution medium (900ml) consisted of 0.1M hydrochloric acid for the first 2 hours and then changed to phosphate buffer pH 7.4 from 3rd to 12th hour; Temperature was maintained at 37°C ± 5°C. An aliquot (5 mL) was withdrawn at specific time intervals and replenished with an equivalent volume of dissolution fluid.Drug content was determined by UV - visible spectrophotometer (Schimadzu, UV-1700 E 23) at 270 nm. The release studies were conducted in triplicate and the results are showed in Table 3 &Fig 4.
| Time (Hours) |
Cumulative Drug Release |
| F I |
F II |
F III |
F IV |
F V |
F VI |
F VII |
F VIII |
F IX |
F X |
| 1 |
10.16 |
9.81 |
8.43 |
7.73 |
6.83 |
14.62 |
12.74 |
10.19 |
8.11 |
6.57 |
| 2 |
18.90 |
15.42 |
13.51 |
17.93 |
15.42 |
29.54 |
21.05 |
19.65 |
14.31 |
9.11 |
| 3 |
37.71 |
26.52 |
21.34 |
26.45 |
21.11 |
41.43 |
38.27 |
33.15 |
21.15 |
17.95 |
| 4 |
58.63 |
41.75 |
39.82 |
33.91 |
28.95 |
63.24 |
59.21 |
54.31 |
28.94 |
23.34 |
| 5 |
76.19 |
59.84 |
51.95 |
40.32 |
36.43 |
81.92 |
67.75 |
59.24 |
36.68 |
29.61 |
| 6 |
88.33 |
71.56 |
63.84 |
47.27 |
40.13 |
100.00 |
79.61 |
73.77 |
41.15 |
34.12 |
| 7 |
100.00 |
89.63 |
79.62 |
55.48 |
51.95 |
- |
86.64 |
70.25 |
50.17 |
41.53 |
| 8 |
- |
100.00 |
87.26 |
63.74 |
53.18 |
- |
100.00 |
81.02 |
53.16 |
47.85 |
| 9 |
- |
- |
100.00 |
71.26 |
59.11 |
- |
- |
100.00 |
62.33 |
56.25 |
| 10 |
- |
- |
- |
77.71 |
66.24 |
- |
- |
- |
70.97 |
63.53 |
| 11 |
- |
- |
- |
86.98 |
79.53 |
- |
- |
- |
81.67 |
72.15 |
| 12 |
- |
- |
- |
98.12 |
90.63 |
- |
- |
- |
92.17 |
86.11 |
Table 3: Dissolution Behavior Of Different Lamivudine Microspheres Formulation.
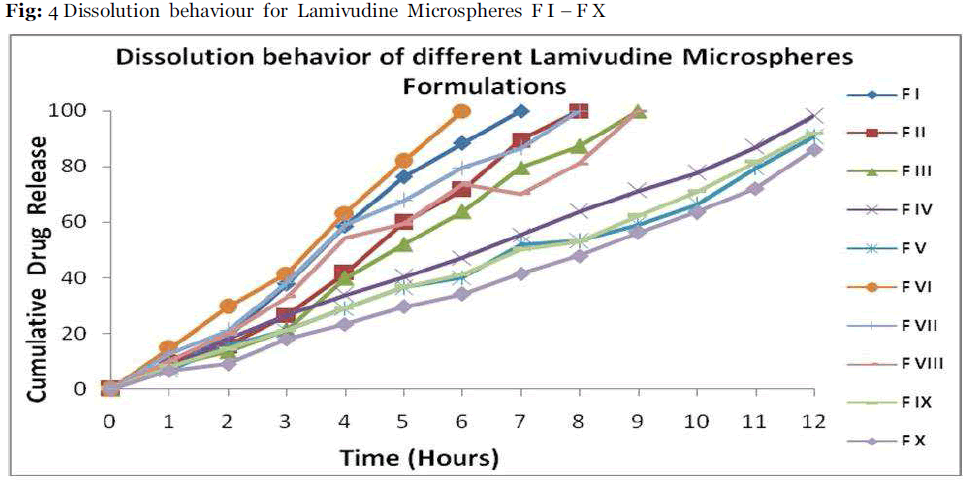
Fig.4: Dissolution behaviour for Lamivudine Microspheres F I – F X.
3.7 In vitro drug release kinetics [10]
In order to study the exact mechanism of drug release from the microspheres, drug release data was analyzed according to Zero order , First order, Higuchi square root, Hixson-Crowell equation as shown in Table 4 &5 and Fig.5. The criteria for selecting the most appropriate model were chosen on the basis of goodness of fit test.
| Kinetic Model |
Regression Coefficient ( R ) |
| F IV |
F V |
F IX |
| Higuchi order |
0.99860 |
0.99929 |
0.91624 |
| Zero order |
0.99861 |
0.99922 |
0.91623 |
| First order |
0.99850 |
0.99920 |
0.91620 |
Table 4: Kinetics of in vitro release of best formulations.
| CUM % RELEASE Q |
TIME T |
√T |
LOG % RELEASE |
LOG T |
LOG % REMAIN |
RELEASE RATE (CUM
% RELEASE/T) |
1/CUM % RELEASE |
PEPPAS LOG Q/100 |
HIXSON CROWELL MODEL |
MODIFIED CUBE ROOT EQUATION |
| 0.8 |
1 |
1 |
0.096910013 |
0 |
1.996511672 |
0.8 |
1.25 |
-2.09691 |
0.9283178 |
0.861773876 |
| 1.71 |
2 |
1.414213562 |
0.23299611 |
0.301029996 |
1.992509335 |
0.855 |
0.584795 |
1.7670039 |
1.1958188 |
1.429982558 |
| 2.44 |
3 |
1.732050808 |
0.387389826 |
0.477121255 |
1.9892711792 |
0.813333333 |
0.409836 |
1.6126102 |
1.3462631 |
1.812424333 |
| 3.23 |
4 |
2 |
0.509202522 |
0.602059991 |
1.985740741 |
0.8075 |
0.309598 |
1.4907975 |
1.4782033 |
2.185085063 |
| 3.76 |
5 |
2.236067977 |
0.575187845 |
0.698970004 |
1.983355614 |
0.752 |
0.269957 |
1.4248122 |
1.554996 |
2.418012621 |
| 4.55 |
6 |
2.449489743 |
0.658011397 |
0.77815125 |
1.979775933 |
0.758333333 |
0.21978 |
1.3419886 |
1.6570558 |
2.745833912 |
| 5.39 |
7 |
2.645751311 |
0.731588765 |
0.84509804 |
1.975937042 |
0.77 |
0.185529 |
1.2684112 |
1.753327 |
3.074155584 |
| 6.02 |
8 |
2.828427125 |
0.779596491 |
0.903089987 |
1.973035441 |
0.7525 |
0.166113 |
1.2204035 |
1.8191374 |
3.309260795 |
| 6.70 |
9 |
3 |
0.826074803 |
0.954242509 |
1.969881644 |
0.744444444 |
0.149254 |
1.1739252 |
1.8852036 |
3.3339273 |
| 7.73 |
10 |
3.16227766 |
0.888179494 |
1 |
1.965060521 |
0.773 |
0.129366 |
1.1118205 |
1.977242 |
3.909486003 |
| 8.42 |
11 |
3.31662479 |
0.925312091 |
1.041392685 |
1.961800639 |
0.765454545 |
0.118765 |
1.0746879 |
2.0344048 |
4.138802737 |
| 8.96 |
12 |
3.464101615 |
0.95230801 |
1.079181246 |
1.959232249 |
0.746666667 |
0.111607 |
-1.047692 |
2.0769976 |
4.3139192 |
Table 5:Hixson,Crowell, Modified Cube Root,Peppas Equation values for FIV.
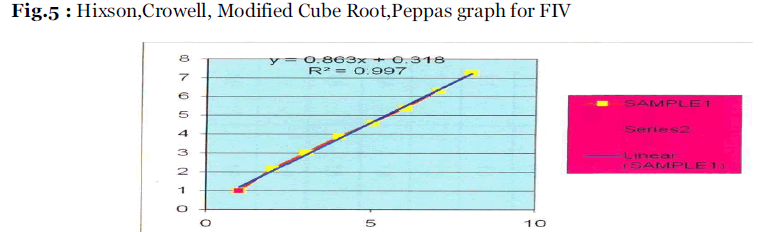
Fig.5: Hixson,Crowell, Modified Cube Root,Peppas graph for FIV.
The microcapsules prepared in the present study were filled in the hard gelatin capsules and stored in HDPE containers at 40°C/75% RH for 3 months as per ICH guidelines. The samples were then characterized for % drug content. The results are summarized in the Table 6.
| Duration (Months) |
Drug content (%) |
Cumulative drug release |
| F IV |
F V |
F IX |
F IV |
F V |
F IX |
| 0 |
53.19 |
50.54 |
52.00 |
98.12 |
90.63 |
92.17 |
| 1 |
52,08 |
49.32 |
50.78 |
97.95 |
90.11 |
91.84 |
| 2 |
51.92 |
48.76 |
49.64 |
96.69 |
89.85 |
90.43 |
| 3 |
51,33 |
48.20 |
49.04 |
95.97 |
89.13 |
9.98 |
Table 6:Accelerated stability data of best formulations at 40°C/75% RH.
4. Results
Maximum release of Lamivudine from the optimized formulations was achieved in 12 hrs or longer, Fig.4. The release mechanism of the Lamivudine formulations was determined by comparing their respective correlation coefficients given in Table 4. The release kinetics study revealed that the prepared microspheres were best fitted to the zero order, Higuchi model, Hixson Crowell model and Modified cube root equation for the optimized formulation Drug release from formulations F-IV and F-V followed the Higuchi model, the release was best fitted to the zero order model.
FTIR studies indicate four bands present in the Lamivudine spectrum, namely; N-H, O-H, C=O, C=N linkages respectively. The same bands were also found in the spectra of the formulations, showing that no drug-polymer interaction occurred (see Fig.2).
Scanning electron microscopy (SEM) results (Fig.3) show that the microspheres were spherical and that the microspheres prepared with ethyl cellulose had a formed smooth surface. High entrapment efficiency was observed in the microcapsules prepared with ethyl cellulose and cellulose acetate. The results of accelerated stability study on the microspheres (Table 6) revealed a good correlation between the original and the aged samples.
3. 5. Discussion
The encapsulation, drug loading and desired release pattern (Higuchi-order, Hixson Crowell, Modified Cube Root Equation and Peppas Equation) was achieved when increasing the concentration of polymer (1:0.9 and 1:10 for Ethyl cellulose, table 3). Further increasing the polymer concentration to 1:1 indicates the lowering of encapsulation and release pattern. This could be due to enhanced viscosity of the oil phase that results lowering of diffusion of the drug. It was observed that the release behavior for these two formulations was statistical significant. (P < 0.001).
Polymer-drug ratio influences the particle size as well as drug release pattern of microcapsules. The yield was high and encapsulation efficiency was good for all the preparation, but was highest for F-IV formulations. The formulations either followed zero order release or the Higuchi release model. Thus drug release was diffusion controlled manner where the drugs release mainly depends on the type of polymer and its viscosity parameters.
Sodium chloride was added with 1 % w/v into the external-continuous phase which improves the encapsulation efficiency and enhances the smooth surface and dense matrix structure for all the formulations. When sodium chloride concentration is increased to 2 %, did not further result in an increase in the encapsulation efficiency due to osmolality difference between the external and internal phase.
The results indicate that F-IV, formulations showed the slowest release rate while FTIR indicated that there was no drug polymer interaction. The results of accelerated stability study showed the stable nature of the drug, Good entrapment efficiency was observed. SEM demonstrated the spherical nature of the microcapsules and the presence of drug particles on their surface.
6. Conclusion
It can be concluded that microspheres of Lamivudine formulation F - IV prepared by Ethyl cellulose polymer in the ratio of 1:0.9 shows desirable stability, prolonged drug relelase following zero order kinetics and was successful by using novel osmogen and multiple emulsion solvent evaporation technique. Thus it would be capable of reducing administration frequency as well as dose dependent side efffects associated by conventional tablet form. Hence F IV was chosen as best formulation for this research studies.
7. Acknowledgement
The authors greatly thanks to Madras Pharmaceuticals Pvt., Chennai, India, for providing gift sample of Lamivudine, Dr Ceal Analytical Lab - Chennai and CLRI- Central Leather Research Institute - Chennai for performing the characterization studies of formulations and C.L.Baid Metha College of Pharmacy, Thoraipakkam - Chennai to carry out this research work very successful.
Conflict of Interest: NIL
Source of Support: NONE
5656
References
- Y.W.Chien, Concept and system design for rate controlled drug delivery, Novel drug delivery systems. Drug and pharmaceutical sciences, Marcel Dekker, NY, 1992.
- Chien YW, Wearley LL. AIDS and chemotherapy. Drugs Today.1989; 25:19-25.
- J.H. Kao, N.H. Wu, P.J.Chen, M.Y. Lai and D.S. Chen. Hepatitis B genotype and the response to interferon therapy. J Hepatol, 33: 998-1002, 2000.
- Caroline M. Perry and Diana Faulds. Lamivudine- A review of its antiviral activity, pharmacokinetic properties and therapeutic efficacy in the management of HIV infection. Drugs, 53: 7- 680, 1997.
- Dhanaraju MD, Bhaskar K and Vamsadhara C (2003). A multiple emulsion method to entrap hydrophilic compound into ethylcellulose microspheres. Indian drugs 40(2):99-103.
- Amitava G, Udaya Kumar N, Partha R, Development, evaluation and method selection for the preparation of lamivudine microspheres, The Int J Pharmacy, Pharmacy on-line, www.priory.com, First published June 2007.
- Bhumkar D.R, Maheshwari M, Patil V.B and Pokharkar. V.B. Studies on effect of variables by response surface methodology for naproxen microspheres. Indian Drugs 2003; 40: 455-461.
- Gohel M.C, Parik R.K, Amin A.F and Surati A.K. Preparation and formulation optimization of sugar crosslinking gelatin microspheres of diclofenac sodium. Indian J Pharm Sci 2005; 67: 575-581.
- Prakash K, Raju PN, Shanta KK andLakshmi MN(2007).Prepration and characterization of lamivudine microcapsules using various cellolose polymers. Tropical Journal of Pharmaceutical Research.6 (4):841-847.
- Soppinath KS, Kulkarni AR, Aminabhavi TM. Encapsulation of antihypertensive drug in cellulose based matrix microspheres, characterization and release kinetics of microspheres and tabletted microspheres .J. Microencapsul.2001; 18(3):397- 409.


