Tarak J. Mehta1, Satyanarayan Singh Rajput2, Mukesh R. Patel3, Kanu R.Patel3 Natvarlal M. Patel3, Mohan Mothilal4
1Research Scholar JJT University, Jhunjhunu, Rajasthan, India
2 Manager, CQA, Ranbaxy Laboratories Limited, New Delhi
3Shri B. M. Shah College of Pharmaceutical Education and Research, Modasa, Gujarat, India
4SRM College of Pharmacy, Kattankulathur, Chennai,Tamilnadu,India
- Corresponding Author:
- Mr. Tarak J. Mehta
Research Scholar, JJT University
Jhunjhunu,
Rajasthan
Mobile- +919925074029
E-mail: tarakjmehta@yahoo.com
Date of Submission: 17-06-2011 Date of Acceptance: 22-07-2011
Citation:Tarak J. Mehta, Satyanarayan Singh Rajput, Mukesh R. Patel, Kanu R.Patel Natvarlal M. Patel, Mohan Mothilal, ““Innovation On Optimization Of 5-Fluoruracil Sr Tablets For Colon Cancer Treatment”,
Int. J. Drug Dev. & Res., July-Sep 2011, 3(3): 312-319
Copyright:© 2010 IJDDR, Tarak J. Mehta et al. This is an open access paper distributed under the copyright agreement with Serials Publication, which permits unrestricted use, distribution, and reproduction in any medium, provided the original work is properly cited.
Keywords
5-fluoruracil, colon, cytotoxicity, bio availability
Introduction
Oral controlled - release formulations for the small intestine and colon have received considerable attention in the past 25 years for a variety of reasons including pharmaceutical superiority and clinical benefits derived from the drug - release pattern that are not achieved with traditional immediate (or) sustained - release products[1].By definition, colonic delivery refers to targeted delivery of drugs into the lower GI tract, which occurs primarily in the large intestine (i.e. colon). The site-specific delivery of drugs to lower parts of the GI tract is advantageous for localized treatment of several colonic diseases, mainly inflammatory bowel disease (Crohn’s disease and ulcerative colitis), irritable bowel syndrome, and colon cancer. Other potential applications of colonic delivery include chronotherapy, prophylaxis of colon cancer and treatment of nicotine addiction[2.3]. It has also gained increased importance not just for the delivery of drugs for the treatment of local diseases4, but also potential site for the systemic delivery of therapeutic proteins and peptides which are being delivered by injections. These delivery systems when taken orally, allow drugs to release the drug from the delivery system once the delivery system arrives into the colon.
These delayed mechanisms are designed to improve the efficacy of the drug by concentrating the drug molecules where they are need most, and also minimize the potential side effects and drug instability issues associated with premature release of drug in the upper parts of the GIT, namely stomach and small intestine45-fluorouracil (5-FU) is one of the most widely used agent in the first line chemotherapy of colorectal canceri. Although 5-FU is a widely used antineoplastic agent, the cytotoxicity is not limited to tumor cells. Hematopoietic cells and normal epithelial cells of GI tract are susceptible to 5- FU induced cytotoxicity, which produces sever leucopenia and intestinal toxicity leading to lethal translocation of intestinal microflora. The clinical use of 5-FU is limited by its GI toxicity (stomatitis) and myelotoxicityii, and oral bioavailability was found to be only 28% in humans. On other hand, severe systemic toxic effects and shorter half life make this drug particularly suitable to be delivered by local delivery system providing continuously sustained releaseiii. Targeted delivery of 5-FU not only reduces systemic side effects, but also would provide an effective and safe therapy for colon cancer with reduced dose and duration of therapy.
Experimental Work :
Optimization of polymer in Core tablet:
The ratio of polymer HPC M: HPC H (X1) and total weight of polymer (X2) in the core tablet were selected as independent variables. Percentage drug release at 4 h (Q4), 6 h (Q6) and 12 h (Q12) were selected as dependent variables. The total weight of polymer (X2) was kept at the level of 10, 20 and 30 mg respectively in the factorial batches tablets and ratio of HPC M: HPC H (X1) was evaluated at 1: 0, 1: 1 and 0: 1. Table 1 shows the applied full factorial design for core tablet.
| Batch code |
Coded
level |
Actual value |
| X1 |
X2 |
X1
(Ratio) |
X2 (mg) Polymer weight |
F1
F2
F3
F4
F5
F6
F7
F8
F9 |
-1
-1
-1
0
0
0
+1
+1
+1 |
-1
0
+1
-1
0
+1
-1
0
+1 |
100:00
100:00
100:00
50:50
50:50
50:50
00:100
00:100
00:100 |
10
20
30
10
20
30
10
20
30 |
X1 is the ratio of polymer HPC-M: HPC-H and X2 is total weight of polymer in the core tablet. All batches
contained 50mg 5- fluoruracil |
Table 1:Full Factorial Design.
Preparation of core tablets
The core tablets containing 5-fluoruracil (50 mg), Starch 1500 and two different grades, HPC-M , HPC-H were prepared by direct compression using 8 mm flat punch. The total weight of core tablet was kept 150 mg. In order to optimize grade and amount of Polymers in core tablet, the composition of coating material was kept constant for all batches in first factorial design. Composition of coating material is given in Table 4.4. The composition of core tablet for all batches is given in Table 2.
| Ingredient |
Quantity (mg)/ Tablet |
HPC-M
MCC (Avicel -102)
Lactose (Tablettose 80) |
80
60
60 |
| Total weight of coating material for tablet is 200 mg |
Table 2: Composition of coating material
| Batch code |
Ingredients (mg) |
| 5- fluorura cil |
HPC- M |
HPC- H |
Starch 1500 |
| F1 |
50 |
10 |
- |
110 |
| F2 |
50 |
20 |
- |
100 |
| F3 |
50 |
30 |
- |
90 |
| F4 |
50 |
5 |
5 |
110 |
| F5 |
50 |
10 |
10 |
100 |
| F6 |
50 |
15 |
15 |
90 |
| F7 |
50 |
- |
10 |
110 |
| F8 |
50 |
- |
20 |
100 |
| F9 |
50 |
- |
30 |
90 |
Table 3 Composition of core tablets
Compression coating of core tablets
The core tablets were coated by compression coating using 10 mm standard flat punch in the Rimek rotary press. Half of the coating material was placed in the die cavity over which the 8 mm core tablet was placed precisely in the centre of the cavity. Other half of the coating material was layered uniformly over the tablet. The tablets were compressed to obtain hardness of 6-7 Kg/cm3. The weight of all tablets was kept 350 mg.
Statistical analysis
The statistical analysis of the factorial design batches were performed by multiple regression analysis using Microsoft Excel®. The results of multiple regression analysis for factorial design batches are depicted in Table 4.8. To evaluate contribution of each factor with different levels on responses, two way analysis of variance (ANOVA) was performed using Sigma Stat software (Sigma Stat 2.03, SPSS, USA). The results of ANOVA for factorial design batches are depicted in Table 4.10. To demonstrate graphically the influence of each factor on responses, the response surface plots were generated using Sigma Plot software (Sigma Plot Software 8.0, SPSS, USA). The response surface plots for factorial are depicted as Figure 4.13. The value of P<0.05 was considered to be significant.
| Batch code |
Assay (%) (n = 20) |
Average weight (mg) (n =20) |
Friability (%) |
| F1 |
102.62 |
355 (2.5) |
0.42 |
| F2 |
101.46 |
348 (1.6) |
0.43 |
| F3 |
101.23 |
358 (1.4) |
0.23 |
| F4 |
99.84 |
360(2.8) |
0.36 |
| F5 |
99.75 |
357 (1.4) |
0.28 |
| F6 |
98.62 |
362 (3.7) |
0.41 |
| F7 |
101.88 |
349 (1.8) |
0.27 |
| F8 |
101.66 |
358 (1.6) |
0.36 |
| F9 |
102.79 |
354 (2.7) |
0.36 |
Table 4: Results of evaluation of tablets for factorial design batches

Figure 1: Dissolution profiles of tablets for first factorial design
| Time (hr) |
Batch code |
| F1 |
F2 |
F3 |
F4 |
F5 |
F6 |
F7 |
F8 |
F9 |
| 0 |
0.00 |
0.00 |
0.00 |
0.00 |
0.00 |
0.00 |
0.00 |
0.00 |
0.00 |
| 1 |
0.00 |
0.00 |
0.19 |
0.00 |
0.00 |
0.00 |
0.00 |
0.00 |
0.00 |
| 2 |
12.46 |
3.12 |
1.96 |
9.24 |
2.37 |
0.00 |
6.48 |
0.00 |
0.00 |
| 3 |
25.43 |
10.26 |
6.15 |
15.36 |
6.48 |
0.55 |
10.61 |
4.26 |
0.98 |
| 4 |
37.54 |
27.46 |
7.69 |
29.46 |
20.48 |
1.72 |
25.49 |
15.46 |
1.91 |
| 5 |
45.49 |
34.72 |
10.04 |
38.47 |
37.89 |
3.21 |
40.26 |
30.78 |
3.40 |
| 6 |
59.84 |
42.63 |
14.93 |
50.78 |
45.18 |
6.24 |
55.86 |
42.53 |
5.09 |
| 7 |
67.48 |
51.61 |
17.48 |
59.19 |
60.75 |
9.74 |
69.12 |
57.12 |
7.96 |
| 8 |
77.86 |
68.79 |
24.15 |
68.49 |
68.49 |
14.20 |
80.49 |
61.48 |
9.70 |
| 9 |
85.48 |
75.48 |
28.27 |
77.26 |
75.18 |
16.98 |
94.63 |
69.94 |
12.01 |
| 10 |
95.12 |
84.34 |
35.37 |
85.46 |
89.60 |
20.96 |
103.75 |
80.07 |
16.37 |
| 11 |
102.46 |
91.64 |
39.18 |
94.26 |
91.48 |
24.80 |
- |
87.20 |
20.77 |
| 12 |
- |
99.86 |
44.56 |
101.48 |
99.48 |
28.56 |
- |
92.43 |
24.42 |
| 13 |
- |
- |
46.13 |
- |
- |
31.74 |
- |
102.84 |
27.74 |
| 14 |
- |
- |
50.84 |
- |
- |
35.08 |
- |
- |
30.49 |
| 15 |
- |
- |
54.37 |
- |
- |
37.78 |
- |
- |
34.12 |
| 16 |
- |
- |
59.78 |
- |
- |
42.27 |
- |
- |
37.60 |
| 17 |
- |
- |
64.68 |
- |
- |
46.82 |
- |
- |
39.16 |
| 18 |
- |
- |
74.53 |
- |
- |
50.37 |
- |
- |
43.61 |
| 23 |
- |
- |
94.61 |
- |
- |
75.02 |
- |
- |
63.05 |
| 24 |
- |
- |
98.83 |
- |
- |
81.29 |
- |
- |
66.87 |
| Standard deviation values of all batches are within the limit of +5. |
Table 5: Cumulative percentage drug release from tablets for factorial design batches (n = 3)
For evaluation and comparison of dissolution profiles, the dissolution profiles were analyzed using dissimilarity factor f1 and similarity factor ƒ2. Dissimilarity factor f1 and similarity factor f2were determined using the equation 2 and 3 as given belowiv,v.

Where,
n is the number of time points,
wt is an optional weight factor,
Rt is the reference assay at time point t and
| Parameters |
Coefficient of regression parameters |
| b0 |
b1 |
b2 |
b11 |
b22 |
b12 |
r2 |
P |
| Q4 |
19.77 |
-4.97 |
-13.52 |
2.03* |
-3.83 |
1.57* |
0.9982 |
0.0007 |
| Q6 |
41.61 |
-2.32 |
-23.37 |
2.74* |
-11.32 |
-1.46* |
0.9934 |
0.005 |
| Q12 |
96.31 |
-4.38 |
-35.02 |
1.40 |
-29.71 |
-5.35 |
0.9984 |
0.0006 |
| Q23 |
99.10 |
-4.54* |
-12.50 |
2.43* |
-10.66 |
08.21* |
0.9663 |
0.0543 |
| k |
0.025 |
-0.012* |
-0.040 |
0.008 |
0.011* |
0.015* |
0.9856 |
0.0159 |
| n |
1.392 |
0.101* |
0.532 |
-0.156* |
0.191* |
-0.004* |
0.9850 |
0.0169 |
| * Indicate the value is insignificant at P = 0.05. |
Table 6 : Multiple regression analysis for dependent variables.
Batch
code |
Percentage drug release |
Release rate
constant (k) |
Diffusio
Exponent |
n
(n) |
| Q4 |
Q6 |
Q12 |
Q23 |
| |
| F1 |
37.54 |
59.84 |
102.46 |
102.46 |
0.121 |
0.791 |
| F2 |
27.46 |
42.63 |
99.86 |
99.86 |
0.036 |
1.235 |
| F3 |
7.69 |
14.93 |
44.56 |
94.61 |
0.005 |
1.760 |
| F4 |
29.46 |
50.78 |
101.48 |
101.48 |
0.074 |
0.961 |
| F5 |
20.48 |
45.18 |
99.48 |
99.48 |
0.026 |
1.360 |
| F6 |
1.72 |
6.24 |
28.56 |
75.02 |
0.001 |
2.239 |
| F7 |
25.49 |
55.86 |
103.75 |
103.75 |
0.057 |
1.089 |
| F8 |
15.46 |
42.53 |
92.43 |
102.84 |
0.032 |
1.268 |
| F9 |
1.91 |
5.09 |
24.42 |
63.05 |
0.1098 |
2.038 |
Table 7: Results of dependent variables for factorial design batches.
Tt is the test assay at time point t. The f2value between 50 and 100 suggests that dissolution profiles are similar. The f2 value of 100 suggests that the test and reference profiles are identical and as the value becomes smaller, the dissimilarity between release profiles increases. The f1 describes the relative error between two dissolution profiles. The percent error is zero when the test and reference profiles are identical and increases proportionally with the dissimilarity between the two profiles.
| Diffusion Exponent (n) |
| Source of variation |
DF |
SS |
MS |
F |
P |
| Ratio of polymer |
2 |
0.111 |
0.055 |
3.830 |
0.118 |
| polymer weight |
2 |
1.776 |
0.888 |
61.411 |
<0.001 |
| Residual |
4 |
0.057 |
0.014 |
|
|
| Total |
8 |
1.945 |
0.245 |
|
|
| Release rate constant (k) |
| Source of variation |
DF |
SS |
MS |
F |
P |
| Ratio of polymer |
2 |
0.0009 |
0.0005 |
1.565 |
0.315 |
| polymer weight |
2 |
0.0103 |
0.0052 |
16.062 |
0.012 |
| Residual |
4 |
0.0012 |
0.0003 |
|
|
| Total |
8 |
0.012 |
0.001 |
|
|
| Q4 |
| Source of variation |
DF |
SS |
MS |
F |
P |
| Ratio of polymer polymer weight |
2
2 |
156.614
1127.45 |
78.30
563.72 |
21.645
155.82 |
0.007
<0.001 |
| Residual |
4 |
14.47 |
3.618 |
|
|
| Total |
8 |
1298.54 |
162.31 |
|
|
| Q6 |
| Source of variation |
DF |
SS |
MS |
F |
P |
| Ratio of polymer polymer weight |
2
2 |
47.38
3533.37 |
23.691
1766.68 |
1.684
125.608 |
0.295
<0.001 |
| Residual |
4 |
56.26 |
14.06 |
|
|
| Total |
8 |
3637.02 |
454.62 |
|
|
| Q12 |
| Source of variation |
DF |
SS |
MS |
F |
P |
| Ratio of polymer polymer weight |
2
2 |
119.06
9126.86 |
59.53
4563.43 |
1.645
126.063 |
0.301
<0.001 |
| Residual |
4 |
144.79 |
36.200 |
|
|
| Total |
8 |
9390.72 |
1173.841 |
|
|
| Q23 |
| Source of variation |
DF |
SS |
MS |
F |
P |
| Ratio of polymer |
2 |
135.98 |
67.99 |
0.714
6.116 |
0.543
0.061 |
| polymer weight |
2 |
1165.23 |
582.61 |
| Residual |
4 |
381.07 |
95.269 |
| Total |
8 |
1682.29 |
210.28 |
| DF is degree of freedom, SS is sum of square, MS is mean sum of square and F is Fischer’s ratio. |
Table 8: Results of two way ANOVA for measured response.
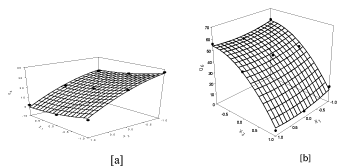
Figure 2: Surface response plot to depict the ratio of polymer (X1) and polymer weight (X2) on [a] Q4 [b] Q6 [c] Q12[d] Q23.
Discussion and conclusion
The use of polymeric matrix devices to control the release of variety of therapeutic agents has become increasingly important in development of the modified release dosage forms. The device may be a swellable, hydrophilic monolithic systems, an erosion controlled monolithic system or a non erodible system. The initial burst release of 5- FLUORURACIL from such matrix tablet surface can be controlled by compression coating technology. Appropriate combination of hydrophilic polymer in upper and lower layer of tablet can govern the release of 5-FLUORURACIL as well as lag time to deliver it in effective concentration to the colon with reduced toxicity. The lag time can be controlled by appropriate combination of polymer and excipients in coating layer. The release mechanism of 5- FLUORURACIL from the compression coated tablets was controlled by the rate of water uptake into the core tablet, which in turn was dependent upon the channeling agent used, the type and concentration of polymer. The hydration and swelling of these polymers results in the formation of gel which control the release of 5-FLUORURACIL from tablet. The hydrophilic lactose forms channels within the coating layer and thus increase the drug release, whereas MCC swell in initial period and atlast erodes along with polymer.
The type of polymer, the type of channeling agent and swellable inert excipients in core as well as compression coat was statistically optimized using factorial design. The tablets of the promising batches were found to be stable for three months under accelerated stability studies. The optimized batches from both factorial design were compared using similarity and dissimilarity factor. The batches F3 (First factorial design) and S4 (Second factorial design) were found to be similar displayed the zero order release kinetics after lag time of 6 hr.
Conflict of Interest: NIL
Source of Support: NONE
5660
References
- Jemal A and Murray T., Cancer statistics, CA Cancer J Clin., 53, 2003, 5-26
- Fraile R and Baker L., Pharmacokinetics of 5- fluorouracil administered orally, by rapid intravenous and by slow infusion, Cancer Res., 40, 1980, 2223-28.
- Koole L and Kruft A., Sustained local drug delivery from a radiopaque implanted reservoir, Net Biotech., 16, 1998, 172-176.
- Steed K and Hopper G., The use of pharmacoscintigraphy to focus the development strategy for novel 5-ASA colon targeting system (“TIME CLOCK” system), J Cont Rel., 49, 1997, 115-22.
- Klein S and Stein J., Site specific drug delivery of anti-inflammatory drugs in the gastrointestinal tract: an in-vitro release model, J Pharm Pharmacol., 57, 2005, 709-19.
- Jeong Y and Ohno T., Evaluation of an intestinal pressure controlled colon delivery capsules prepared by dipping method, J Cont Rel., 71, 2001, 175-82.
- Xi M and Zhang S, Syudy on characteristics of pectin-ketotifen for colon targeting in rats, Int J Pharm., 298, 2005, 91-97.
- Fadda H and Basit A., Dissolution of pH responsive formulations in media resembling intestinal fluids: bicarbonate versus phosphate buffers, J Drug Deliv Sci Technol., 15, 2005, 273-79.
- Jack A and Naresh T., Colonic drug delivery chalanges and opportunities-an overview, Eu. Gestroentrol Rev., 2006, 1-5.
- Basit A, Advances in colonic drug delivery,Drugs, 65, 2005, 1991-2007.
- US Pharmacopoeia 28, United State Pharmacopoeial Convention, Rockville, M.D., USA, Asian edition, 2005, 2509.
- US Pharmacopoeia 28, United State Pharmacopoeial Convention, Rockville, M.D., USA, Asian edition, 2005, 2745.
- Gabrielsson J and Lundstedt T., Multivariate methods in pharmaceutical applications, J Chemometrics, 16, 2002, 141-160.
- Ford J and Edgar P., Importance of drug type, tablet shape and added diluents on drug release kinetics from hydroxypropyl methyl cellulose matrix tablets, Int J Pharm., 40, 1987, 223-234.
- Takahara J and Nagai T., Multiobjective simultaneous optimization technique based on an artificial neural network in sustained release formulations, J Cont Rel., 49, 1997, 11-20.
- Kramar A and Vrecer F., Statistical optimization of diclofenac sustained release pellets coated with polymethacrylic films, Int J pharm., 256, 2003, 43-52 .
- Lunstedt T and Bergman R., Experimental design and optimization, Chem Intell Lab Sys., 42, 1998, 3-40.


