Keywords
IL-6, high-sensitivity C-reactive protein in atherosclerosis, type2 diabetes.
Introduction
It has been reported that measurement of inflammatory markers such as high-sensitivity Creactive protein (HSCRP) is an important method for identifying individuals at risk for cardiovascular events (1).
Insulin resistance: is the condition in which normal amounts of insulin are inadequate to produce a normal insulin response from fat, muscle and liver cells.. Insulin resistance in fat cells results in hydrolysis of stored triglycerides, which elevates free fatty acids in the blood plasma. Insulin resistance in muscle reduces glucose uptake, whereas insulin resistance in liver reduces glucose storage, with both effects serving to elevate blood glucose. High plasma levels of insulin and glucose due to insulin resistance often lead to metabolic syndrome and type 2 diabetes. High levels of insulin cause several problems: One of them is high blood pressure . Insulin regarded as anabolic hormone(2).
Insulin resistance is linked to established risk factors for atherosclerosis such as hypertension, hyperlipidemia, and obesity, which subsequently accelerate the development and progression of atherosclerosis (3) .
Although plasma CRP is reported to be associated with insulin resistance in type 2 diabetic patients (4), the significance of HSCRP in diabetic atherosclerosis has not been adequately investigated.
The role of insulin resistance or hyperinsulinemia as a cause of hypertension remains unproven {Kincaid- Smith}. Some epidemiologic studies have not been able to demonstrate a correlation between plasma insulin levels and the systemic Bp {Muller, DC}. In addition, patients with an insulinoma do not become hypertensive and their Bp does not fall after successful surgery (5).
The acute phase response (or reaction) is a major physiological phenomenon that accompanies inflammation and is associated with increased activity of pro inflammatory cytokines(6) . It occurs following trauma, burns, infections, inflammation and other related conditions (7). Protein markers of inflammation have been studied as noninvasive indicators of underlying atherosclerosis in apparently healthy individuals. The most extensively studied biochemical marker of inflammation in cardiovascular disease in serum is C-reactive protein CRP, for which standerized high –sensitivity assays (hs –CRP) are widely available(8). CRP is an acute phase protein that is produced predominantly by hepatocytes under the influence of cytokines such as interleukin IL-6 and tumor necrosis factor –alpha (9). Despite a lack of specificity for cause of the inflammation, data from more than 30 epidemiologic studies have shown a significant association between elevated serum or plasma concentrations of CRP and the prevalence of underlying atherosclerotic disease, the risk of recurrent cardiovascular events among patients with established disease, and the incidence of first cardiovascular events among individuals at risk for atherosclerosis . In addition, a number of drugs used in the treatment of cardiovascular disease reduce serum CRP. It is therefore possible that reduced inflammation contributes to the beneficial effects of these medications. The inflammatory markers CRP, fibrinogen, and serum myeloid originate in the liver, and their production is stimulated by systemic cytokines such as inerleukine -6 and tumor necrosis factor alpha. These cytokines are produced at several extra hepatic sites including the heart, vessel walls, macrophages, and adipose tissue (10).
The release of cytokines leads to both the stimulation and inhibition of protein synthesis. These so-called acute phase proteins have served as important biochemical markers of inflammation. Interleukin-6 (IL-6) is a multifunction cytokine that regulates immune response, acute phase reactions and hematopoesis and may play a central role in host defense mechanisms, and it’s one of several pro inflammation cytokines that have been associated with insulin resistance (11)
The elevated levels of HSCRP are associated with insulin resistance in type 2 diabetic patients. To investigate serum concentration of pro inflammatory IL-6 in T2DM. The aim of the study is a comparison between metabolic profiles in Iraqi type 2 diabetic patients with low HSCRP levels and those with elevated HSCRP levels; independent predictors of the HSCRP in these populations were evaluated. To estimation the pro inflammation cytokines that have been associated with insulin resistance such as IL-6 in type 2 diabetic patients.
Material and methods
One hundred twenty consecutive Iraqi patients with type 2 diabetes mellitus who were selected from patients attended to out patient in medical city in Baghdad.
Among these subjects, we enrolled 100 patients who did not have organic heart disease as determined by physical examination and routine laboratory tests, including serum electrolytes, serum creatinine, blood urea, fasting blood glucose (FbG), fasting immunoreactive insulin (FIRI), IL-6 , chest X-ray, electrocardiography (ECG), echocardiography, treadmill exercise test.
All patients underwent a clinical examination to exclude the presence of secondary hypertension. Essential hypertension was defined as diastolic blood pressure ≥80 mmHg, systolic blood pressure ≥130 mmHg, or self-reported use of antihypertensive medication (12).All patients were diagnosed by Doppler ultrasound of carotid artery.
Blood was taken at 8-00am from the antecubital vein with the patient in the recumbent position after an overnight fast. All patients underwent routine laboratory tests including assays for serum electrolytes, serum total cholesterol, serum triglycerides, serum high-density lipoprotein, FbG, and F-IRI. Insulin resistance was evaluated by the homeostasis model assessment (HOMA) index: (fasting plasma insulin (μU/ml) x FPG (mmol/l))/22.5 (12)
High-sensitivity assays for CRP were performed according to the previously described method. By this assay, 46 patients were assigned to have high HSCRP (0.3–1.0 mg/dl; termed elevated HSCRP group) (13). Also recruited 54 age-matched patients who had low level of HSCRP (<0.3 mg/dl; low HSCRP group), who were selected from the original 100 enrolled patients. Patients who showed higher levels of CRP (i.e., >1.0 mg/dl) were excluded from the study(14) . The clinical characteristics of patients in the low and high HSCRP groups are summarized in Table 1. In total, 31 of the 46 patients in the elevated of HSCRP group and 35 of the 55 patients in the low level of HSCRP group met the criteria for essential hypertension and all of these patients were being treated with calcium channel antagonists, angiotensin-converting enzyme (ACE) inhibitors, and/ or angiotensin II receptor blockers with diuretics. None of the patients were being treated with insulin.
| |
LOW level of high sensitivity CRP group |
elevated high sensitivity CRP group |
p- value |
| Age |
56±6 |
57±5 |
NS |
| Gender(men/women) |
29/21 |
25/24 |
NS |
| HSCRP levels (mgldl) |
0.1±0.09 |
0.6±0.2 |
0.0001 |
| Duration of diabetes (years) |
7.5±3.2 |
8.1±4.9 |
NS |
| Smoking habits (%) |
33 |
36 |
NS |
| Hypertension(%) |
64 |
67 |
Ns |
| Dislipidemia(%) |
35 |
37 |
ns |
| IL-6( pg/ml) |
23.95±4.27 |
33.7±9.2 |
0.05 |
| Fasting blood glucose (mg/dl) |
137±18 |
150±27 |
.001 |
| Fasting immunoreactive insulin (mU/ml) |
6.3±1.7 |
9.2±2.4 |
0.001 |
| Homeostasis model assessment index |
2.1±0.7 |
3.3±0.9 |
0.001 |
| Hemoglobin A1C (%) |
7.5±1.1 |
7.7±0.9 |
NS |
| Uric acid (mg/dl) |
5.7±1.6 |
6.5±1.3 |
0.01 |
| Creatinine(mg/dl |
0.7±0.2 |
0.8±0.2 |
NS |
Table 1: Clinical characteristics of studied patients:
Interleukin-6 was measured by enzyme immuno assay method using a kit supplied by immunotech-France (15).
Dyslipidemia was defined as fasting triglycerides levels 150 mg/dl or a high-density lipoproteincholesterol (HDL-c) concentration <45 mg/dl for women and <35 mg/dl for men (12). Fifteen of the 46 patients in the high HSCRP group and 17 of the 55 patients in the low HSCRP group met the criteria for dyslipidemia. Patients treated with insulin were also excluded. Female patients who were pregnant or treated with any postmenopausal hormonal replacement or contraceptives were also excluded.
The anthropometric and body composition characteristics of the patients were evaluated using the following parameters: height, body weight, BMI, waist circumference, hip circumference, and waist-to-hip ratio. BMI was calculated as weight/(height2) (kg/m2). The waist circumference was measured midway between the lower rib margin and the iliac crest and the hip circumference was measured at the widest circumference over the trochanter in standing subjects after normal expiration.
Statistical analysis
Data are presented as mean±S.D. Differences between two groups were analyzed by the unpaired Student’s t-test, A P value of <0.05 was considered statistically significant. Simple (Spearman’s rank) correlation coefficients between HSCRP and various parameters were calculated. Stepwise multiple regression analysis was then used to evaluate the association between the levels of HSCRP and other factors, such as the waist circumference, triglyceride levels, HDL-c levels, uric acid levels, HOMA index values.
Results:
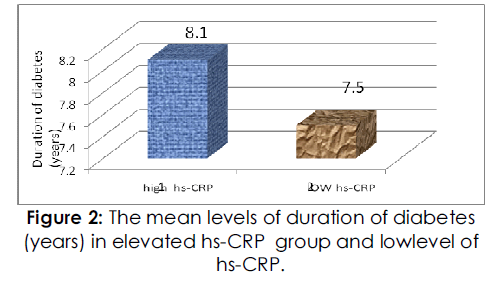
As shown in Table 1, the mean ages of the high and low HSCRP groups were similar, and there were no significant differences between the groups with respect to gender, duration of diabetes as shows in fig 2, smoking habits,the BMI values, waist circumferences, and the waist-to-hip ratios were larger in the high HSCRP group than in the low HSCRP group (P=0.0265, P=0.0001, and P=0.0409 respectively).
Figure 1 shows the mean level of elevated HSCRP(mg/dl) group and low level of HSCRP (mg/dl) group with significantly difference between the patients p<0.0001

Figure 1: The mean values of high sensitivity CRP (mg/dl) in elevated hs-CRP group and low level ofhs-CRP group.

Figure 2: The mean levels of duration of diabetes (years) in elevated hs-CRP group and lowlevel of hs-CRP.
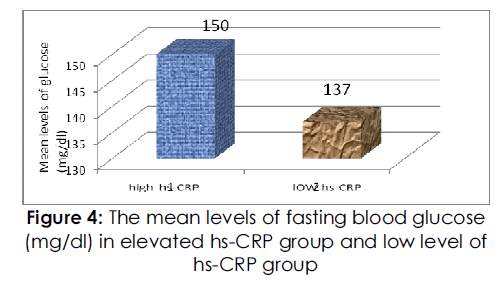
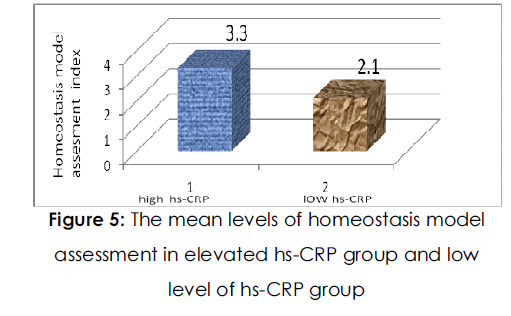
The resting heart rate and systolic and diastolic blood pressures were not significantly different between the two groups. Regarding glucose metabolism, Fig. (4) ,fig( 5) shows the level of Fasting blood glucose and insulin concentrations and HOMA index values were higher in the HSCRP group than in the low HSCRP group (P=0.0015, P<0.0001 and P<0.0001 respectively). However, there was no significant difference in hemoglobin A1c between the two groups. With regard to lipid metabolism, the concentration of serum triglyceride was higher and the concentration of serum HDL-cholesterol was lower in the high HSCRP group than in the low HSCRP group (P=0.0002 and P<0.0001 respectively), whereas serum total cholesterol levels were not significantly different between the groups.

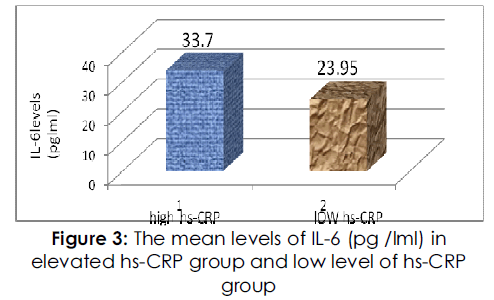
Figure 3: The mean levels of IL-6 (pg /lml) in elevated hs-CRP group and low level of hs-CRP group.

Figure 4: The mean levels of fasting blood glucose (mg/dl) in elevated hs-CRP group and low level of hs-CRP group.

Figure 5:The mean levels of homeostasis model assessment in elevated hs-CRP group and low level of hs-CRP group.
IL-6 showed a significantly higher serum level in high HSCRP patients than low HSCRP, p<0.05. as shows in fig (3).
The concentration of uric acid was higher in the high HSCRP group than in the low HSCRP group (P=0.0107). Parameters measuring renal function, the serum creatinine concentration was not significantly different between the groups.
Table 2↓ depicts the correlation between the HSCRP level and age, BMI, and other variables in both the high-and the low HSCRP group. HSCRP levels were positively correlated with the BMI values, waist circumference, waist-to-hip ratio, triglyceride levels, FPG, fasting plasma insulin concentration, uric acid levels, HOMA index values, IL-6 and were negatively correlated with HDL-c levels.
| Parameters |
Univariante analysis |
value |
| Age |
0.067 |
0.504 |
| Duration of diabetes (years) |
0.082 |
0.41 |
| BMI (Kg/m2) |
0.24 |
0.013 |
| Waist circumference |
0.276 |
0.005 |
| Hip circumference |
0.022 |
0.82 |
| Waist /hip ratio |
0.202 |
0.04 |
| IL-6( pg/ml) |
0.8 |
0.05 |
| Systolic blood pressure |
0.16 |
0.109 |
| Diastolic blood pressure |
0.13 |
0.19 |
| Heart rate |
0.16 |
0.107 |
| Total-cholesterol |
0.09 |
0.33 |
| Triglyceride |
0.21 |
0.03 |
High density lipoprotein
cholesterol |
0.32 |
0.0008 |
| Fasting blood glucose (mg/dl) |
0.26 |
0.008 |
Fasting immunoreactive insulin
(mU/ml) |
0.51 |
0.0001 |
Homeostasis model assessment
index |
0.56 |
0.0001 |
| Hemoglobin A1C (%) |
0.122 |
0.22 |
| Uric acid (mg/dl) |
0.22 |
0.02 |
| Creatinine(mg/dl) |
0.09 |
0.35 |
Table 2: Correlations between high –sensitivity Creactive protein and various parameters.
Discussion
In the present study, type 2 diabetic patients with HSCRP shows multiple metabolic parameters, fasting blood concentrations of glucose and insulin and the HOMA index were higher in patients with elevated HSCRP than in those with low HSCRP. In addition, multiple regression analysis revealed that the levels of HSCRP in the patients could be independently predicted by the HOMA index values in Iraqi patients with type 2 diabetes. Obesity and insulin resistance have been quite well recognized as fundamental and leading causes of major health issues such as diabetes, dysperlipidemia, hypertension, and cardiovascular diseases central obesity, particularly central adiposity is considered to play a major role in causing insulin resistance and NIDDM(non insulin dependent diabetes). This study discusses visceral obesity, the potential mechanisms by which it would be related to insulin resistance, focus on the one of adipocytokines expressed and secreted by the adipose tissue which is IL-6(16) .
Recent studies have demonstrated a close relationship between elevated CRP and insulin resistance (18). Yudkin et al. (17) reported that low CRP in healthy subjects is related to insulin resistance when assessed by BMI, HOMA index, blood pressure, HDL-cholesterol, and triglyceride, and that increased proinflammatory cytokines, interleukin-6 and tumor necrosis factor- (TNF- ), play an important role in the low level of chronic inflammatory state. Festa et al. (18) also reported that the level of CRP correlated with BMI, insulin sensitivity (assessed by i.v. glucose tolerance test), and fasting plasma levels of insulin and proinsulin. They suggested that CRP is not only a predictor of cardiovascular events but also an independent predictor of insulin sensitivity. In the present study, consistently, the level of HSCRP correlated with BMI, HDL-cholesterol, fasting plasma insulin concentration, and HOMA index. Being different from those two prior studies [18,19)this study enrolled type 2 diabetic patients who did not receive insulin treatment.
High BMI is associated with elevated central of obesity. It is now recognized that excess abdominal distribution of fat is more closely associated with the development of metabolic abnormalities. It can therefore, be speculated that the unfavorable changes observed with high BMI may in fact be attributed to the detrimental influence of abdominal adiposity on the metabolic processes (20). While the cause of this association is not fully established, the possible mechanism is hypothesized to be mediated by the intra-abdominal fat depot. A preponderance of enlarged fat cells in this type of adipose tissue increases the risk of glucose intolerance, hyperinsulinemia and hypertriglyceridemia. These hypertrophied adipocytes are more sensetive to lipolytic hormones than smaller fat cells leading to increased delivery of free fatty acids into the portal circulation(20).
On the other hand ,the fasting serum insulin and BMI were positive correlated with high –sensetivity C-reactive protein as shown in table (2),Since the most important characteristic of type 2diabetes patients was obesity (high BMI) and insulin resistances ,and the positive correlation in insulin sensitive index and high –sensitivity C-reactive protein as shown in table (2).
A leading hypothesis in this regard is that intraabdominal adipocytes are more lipolytically active. This would increase (non esterified fatty acid) NEFA levels and flux, which might inhibit insulin clearance and promote insulin resistance .another possible mechanism is that NEFA compete with glucose uptake in muscle and fat cells, resulting in increased NEFA oxidation and impaired insulin mediated glucose utilization (glucose oxidation and glycogen deposition) in skeletal muscle and in acceleration of gluconeogenesis in liver. An alternative hypothesis is that, since adipocytes are now known to secrete many factors that are capable of exerting systemic effects, the array of factors secreted by intra abdominal adipocytes may be particularly harmful to systemic insulin sensitivity(16).
The precise mechanisms underlying insulin resistance are unknown and both peripheral impaired uptake of glucose by skeletal muscle or adipose tissue, and hepatic insulin resistance are probably involved. Several theories have been postulated for peripheral insulin resistance, but the majority involves defects in insulin binding or insulin receptor substrate proteins in muscle or fat cells(21). In general, once insulin has bound to it receptor, autophosphorylation of tyrosine residues occurs which triggers an intracellular signaling cascade that involves several molecules, the most important being insulin receptor substrate-1 (IRS-1) and insulin receptor substrate-2 (IRS-2).The autophosphorylation of tyrosine may be inhibited by a variety of products of oxidant stress, inflammation and lipotoxicity leading to insulin resistance. For example, excess triglyceride in insulin-resistant muscle might lead to elevated diacylglycerol concentrations. Diacylglycerol, in turn, activates protein kinase C,which can inhibit tyrosine kinase activity of the insulin receptor, as well as tyrosine phosphorylation of insulin receptor substrate-1 leading to reduced insulin action.(22)
The pro inflammatory cytokine production is in diabetes and in case of metabolism have the potential to influence macrophage cytokine release inducing up regulation of pro inflammatory Cytokines Circulating IL-6, TNF-& and CRP have been determined as markers of inflammatory response[ 23) .
IL-6 is a cytokine which is one of a class of immune system regulators it plays a critical role, along with other cytokines in acute phase inflammatory response to cellular injury (24). The pro inflammatory cytokines IL-6 and TNF-& are common to both TH subsets in human TNF -& and IL-6 mediated damage to micro- and macrovasicular tissue altered insulin secretion through direct or through stimulation of free fatty acid production , and altered glucose homeostasis are suggested .IL-6 and TNF-& are adipocyte -secreted factors (25).
The pro inflammatory cytokine production is in diabetes and in case of metabolism have the potential to influence macrophage cytokine release inducing up regulation of pro inflammatory Cytokines .Circulating IL-6, TNF-& and CRP have been determined as markers of inflammatory response . IL-6 might play a significant role in IDDM etiopathogenesis(26)
IL-6 levels were found to be increased significantly in any group of the study (P<0.05) .In the present study is in agreement with 27) that diabetic patients have elevated blood levels of IL-6 , which is known to increase the inflammation and development of vascular disease and atherosclerosis.
Potential mechanisms relating the degree of obesity and circulating CRP level have not clearly elucidated. It has been suggested that CRP level reflect the amount and the activity of pro inflammatory cytokines such as tumor necrosis factor –α, IL-1 and IL-6 , which are implicated in the process of atherosclerotic plaque formation and acute coronary syndrome(28)
In this regard, IL-6 which is induced by both TNF –α and IL-1, has been proposed to play a central role in the relation ship between CRP and cardiovascular disease (29). IL-6 is secreted in several sited including activated macrophages and lymphocytes but also in adipose tissues. The contribution of adipose tissue in IL-6 secretion has been proposed to be the link between plasma CRP and adiposity, as CRP synthesis in liver is largely under the control of IL-6,it is possible that this mechanism explains the higher CRP levels in obese patient.
Conclusion:
There is elevated levels of high hs-CRP in Iraqi patients with atherosclerosis type 2 diabetes than the low hs-CRP group. The duration of the diabetic disease was found to have no effect on levels of hs-CRP in Iraqi patients.
There is elevated levels of IL-6 in elevated hs-CRP in Iraqi patients with atherosclerosis type 2diabetes than the low level of hs-CRP group could be the milestone in considering IL-6 as an inflammatory marker in diagnosis. The elevated the levels of IL-6 which is known to the inflammation and development of vascular disease and atherosclerosis. C-reactive protein CRP is strongly associated with BMI. The contribution of adipose tissue in IL-6 secretion has been proposed to be the link between plasma CRP and adiposity as CRP synthesis in liver is largely under the control of IL-6. There is Close relationship between elevated CRP and insulin resistance in type 2 diabetes.
5753
References
- Silva D, Pais de Lacerda A. High-sensitivity Creactivenprotein as a biomarker of risk in coronarynartery disease. Rev Port Cardiol.2012; 31:733-745.
- BigazziR, BuoncristianiE and Campese,V.M.nIncreased cardiovascular events in hypertensivenpatients with insulin resistance: A 13-year follow-up .nNutrition, Metabolism and Cardiovascular Diseas:n2008 ;18: 314-319 .
- Jandeleit-Dahm, K. A. M. Gray, S. P. Insulin andncardiovascular disease: biomarker or association.nDiabetologia . 2012; 55: 3145-3151.
- Anan F, Takahashi N, Nakagawa M, Ooie T, SaikawanT & Yoshimatsu H. High-sensitivity C-reactive proteinnis associated with insulin resistance andncardiovascular autonomic dysfunction in type 2ndiabetic patients. Metabolism 2005; 552–558.
- Meshkani, R. Adeli, K.Hepatic insulin resistance,nmetabolic syndrome and cardiovascular disease-nClinical Biochemistry.2009; Volume: 42: 13-14: 1331-n1346.
- Gabay C, Kushner I: Acute-phase proteins andnother systemic responses to inflammation. N Engl JnMed 1999; 340:448-54.
- Marshall WJ: The kidneys. In: Clinical chemistry,nfourth edition. Philadelphia, Mosby, 2000:57-77.
- Redker, PM. Clinical application of C-Reactivenprotein for cardiovascular disease detection andnprevention. Circulation 2003: 107: 363.
- Alizadeh Dehnavi, R. de Roos, A. Rabelink, T.J. andnvan Pelt, J. Elevated CRP levels are associated withnincreased carotid atherosclerosis independent ofnvisceral obesity Atherosclerosis. 2008; Volume 200:n417-423.
- Herder C, Schöttker B, Rothenbacher D, Roden M,nKolb H, Müller H. Interleukin-6 in the prediction ofnprimary cardiovascular events in diabetes patients:nresults from the ESTHER study. Atherosclerosis. 2011;n216(1):244-7.
- Wannamethee SG, Whincup PH, Rumley A, LowenGD. Inter-relationships of interleukin-6,ncardiovascular risk factors and the metabolicnsyndrome among older men. J Thromb Haemost.n2007;5(8):1637-43.
- Liao D, Sloan RP, Cascio WE, Folsom AR, Liese AD,nEvans GW, Cai J & Sharrette AR. Multiple metabolicnsyndrome is associated with lower heart ratenvariability. The Atherosclerosis Risk in CommunitiesnStudy. Diabetes care 1998 21 2116–2122.[Abstract]
- Matthews DR, Hosker JP, Rudenski AS, Naylor BA,nTreacher DF & Turner RC. Homeostasis modelnassessment: insulin resistance and ß-cell functionnfrom fasting plasma glucose and insulinnconcentrations in man. Diabetologia 1985 28 412–n419.[CrossRef][Web of Science][Medline]
- Pearson TA, Mensah GA, Alexander RW, AndersonnJL, Cannon RO, III, Centers for Disease Control andnPrevention & American Heart Association. Markersnof inflammation and cardiovascular disease:napplication to clinical and public health practice: anstatement for healthcare professionals from thenCenters for Disease Control and Prevention and the American Heart Association. Circulation 2003 :107n;499–511.[Free Full Text] .
- Braily H.1994Braily H. Montero Julian F. A, Zuber C.:nTotal interlueken -6 in plasma measured bynimmunoassay .Clin Chem 1994: 40:116.
- Kalupahana, N.S. Moustaid-Moussa, N. andnClaycombe, K.J. Immunity as a link between obesitynand insulin resistance Molecular Aspects ofnMedicine. 2012; 33:26-34.
- Steppan , CM , Bailey ST, Bhat SM et al, The hormonenresistin links obesity to diabetes . Nature. 2004:n409:307-312.
- Goldberg RB. Cytokine and cytokine-likeninflammation markers, endothelial dysfunction, andnimbalanced coagulation in development ofndiabetes and its complications. J Clin EndocrinolnMetab.2009:49(9); 1317.
- Festa A, D’Agostino R, Jr, Howard G, Mykkanen L,nTracy RP & Haffner SM. Chronic subclinicalninflammation as part of the insulin resistancensyndrome: the Insulin Resistance AtherosclerosisnStudy (IRAS). Circulation 2000 102 42–n47.[Abstract/Free Full Text]
- Karter Aj,Maayer –Davis EjmSelby JV, etal . Insulinnsensitivity and abdominal obesity in African –nAmerican, Hispanic and non - Hispanic white mennand women. The insulin resistance andnatherosclerosis study. Diabetes, 1996, 45: 1547-55.
- Itani Si, Ruderman Nb, Schmieder et al., Lipid insulinnresistance in human muscle is associated withnchanges in diacylglycerol, protein kinase C.nDiabetes. 2002, 51(7):2005-2011.
- Laybutt D R, Chisholm D J, Kraegen EW. Specificnadaptations in muscle and adipose tissue innresponse to chronic systemic glucose over supply innrats.Am. J Phy-Soil. 1997; 273: E1-E9.
- Davi G, Chiarelli F, Santilli F, et al.: Enhanced lipidnperoxidation and platelet activation in the earlynphase of type 1 diabetes mellitus: role of interleukin-n6 and disease duration. Circulation 2003;n107(25):3199–3203.
- Yasar Dogan, Saadet Akarsu, Bilal Ustundag,2 ErdalnYilmaz,1 andMetin Kaya Gurgoze: SerumIL-1M, IL-2,nand IL-6 in Insulin-Dependent Diabetic Children:nMediators of Inflammation 2006:P 1-6.
- Erbagci AB, Tarakcioglu M, Coskun Y, Sivasli E,nSibelNamiduru E:. Mediators of inflammation innchildren with type I diabetes mellitus: cytokines inntype I diabetic children. Clinical Biochemistr.n2001;34(8):645–650.
- Wedrychowicz A, Dziatkowiak H, SztefkonK,Wedrychowicz A. Interleukin-6 (IL-6) and IGF-IGFBPnsystem in children and adolescents with type 1ndiabetes mellitus. Experimental and ClinicalnEndocrinology & Diabetes. 2004; 112(8):435–439.
- Jain SK, Kannan K, Lim G, Matthews-Greer J, McVienR &Bocchini JA Jr. Elevated blood interleukin-6 levelsnin hyperketonemic type 1 diabetic patients andnsecretion by acetoacetatetreated cultured U937nmonocytes. Diabetes Care. 2003; 26(7): 2139–2143.
- Andre, T, Amy, N, Cythien .K : Weight loss reduces Creactivenprotein levels in obese posmenopausalnwomen. Circulation J of Amerrican HeartnAssociation 2002; 105: 564-569.


