Syeda Sadia Najam1, Fazli Rabbi Awan1*, Mehboob Islam1, Mohsin Khurshid1, Abdul Rehman Khan1, Tehmina Siddique1, Maryam Zain1 and Ahmed Bilal2
1Diabetes and Cardio-Metabolic Disorders Lab, Health Biotechnology Division, National Institute for Biotechnology and Genetic Engineering (NIBGE), Faisalabad, Pakistan
2PMC/Allied Hospital, Faisalabad, Pakistan
Corresponding Author:
Fazli Rabbi Awan
Diabetes and Cardio-Metabolic Disorders Lab
Health Biotechnology Division, National Institute for Biotechnology and Genetic Engineering (NIBGE)
P.O. Box 577, Jhang Road, Faisalabad, Pakistan
Tel: +92419201316
E-mail: awan.fr@gmail.com
Received date: September 01, 2016; Accepted date: October 21, 2016; Published date: October 28, 2016
Citation: Najam SS, Awan FR, Islam M, et al. Leptin Correlation with Obesity, Diabetes and Gender in a Population from Faisalabad, Pakistan. Arch Med. 2016, 8:5 doi: 10.21767/1989-5216.1000169
Copyright: © 2016 Najam SS, et al. This is an open-access article distributed under the terms of the Creative Commons Attribution License, which permits unrestricted use, distribution, and reproduction in any medium, provided the original author and source are credited.
Keywords
Leptin; Type 2 diabetes; Obesity; Gender; Faisalabad; Pakistan
Introduction
Leptin is a protein hormone derived from adipose tissue and encoded by LEP gene with a chromosomal location at 7q32.1 having 167 amino acids [1,2]. The expression of leptin in adipocytes and its plasma concentration are both positively correlated with adiposity [3]. It is the main regulator of the balance between food intake and energy expenditure through communication with central nervous system [4,5]. Leptin levels drop in fasting or starvation state while increase following refeeding. Leptin levels are directly correlated with fat mass and are elevated in obese patients, who are leptin resistant [6]. Due to defect in either secretion of leptin or abnormal leptin there is leptin deficiency which is a hallmark of certain rare cases of obesity. Leptin deficiency or resistance can result in profound obesity and diabetes. Leptin-deficient mice and humans are severely obese and have several metabolic and endocrine alterations, such as hyperglycemia, insulin resistance, hypertriglyceridemia, and central hypothyroidism [7]. If the defect is on leptin receptors in the brain or in the downstream signaling pathways, which are the target sites for leptin action; it would not exert its effects and will be unable to regulate food intake and energy homeostasis. In this situation, brain is irresponsive for the intake of food and energy, thus elicits a response to the body for more food intake, which can cause weight gain and obesity. Since obesity is a major risk factor for type 2 diabetes mellitus (T2D), the increase in adipose tissue may lead to diabetes. Obesity or increase in fat mass also alters the level of adipokines like leptin, adiponectin etc. which are released by the adipose tissue, thus it is suggested that such altered level of adipokines are involved in the pathogenesis of obesity associated diabetes. Leptin level increases in obesity and its correlation with body mass index (BMI) and glucose levels has already been reported in different populations [8-11]. As we already had reported blood levels of adiponectin in a small population from Faisalabad, Pakistan [12] there is no such data for leptin levels for this population. So, our aim for this study was to correlate the levels of leptin with obesity, diabetes and gender status in this population and it will be the first report from Faisalabad, Pakistan.
Materials and Methods
Study subjects
Study design is already reported for another hormone adiponectin in our previous study [12]. Brief description is given here. A set of 80 subjects was selected from more than 500 subjects depending who fulfilled the study criteria. The objective of this small case-control study was to investigate the serum concentrations of leptin and its correlation with certain biochemical parameters. These subjects were subdivided in four groups on the basis of diabetes status and obesity. Study design and subject groups are illustrated in Figure 1. The age of participants was ≥ 40 yrs and the samples were collected from both non-diabetic (n=40) and confirmed type 2 diabetics (n=40) according to World Health Organization [13] criteria from April to December 2012. All the subjects were in fasting state at the time of sampling.
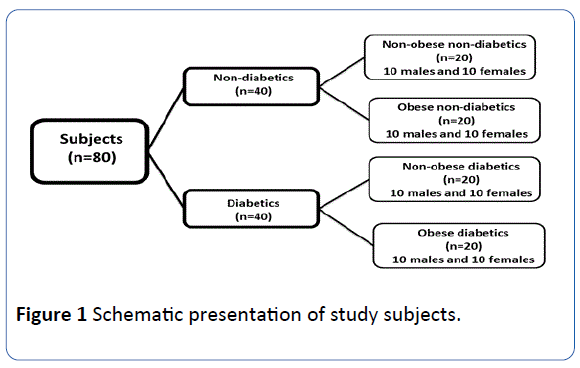
Figure 1: Schematic presentation of study subjects.
Anthropometric measurements (body weight, height) were taken for the calculation of body mass index (BMI in kg/m2). Weight and height were measured while participants were wearing light clothes and no shoes. Study subjects were divided in two categories i.e. obese and non-obese on the basis of BMI values. BMI value for non-obese were less than 24.9 kg/m2 while for the obese, it was more than 30 kg/m2 as per American Diabetes Association criteria.
Data collection
Sampling camps were arranged for collection of blood samples from study subjects. A consent letter was signed by each subject prior to take sample. Basic and clinical information was filled in our study questionnaire forms for each subject. Body weight and height was taken at the time of sampling. Blood sample was drawn from each subject in the fasting state of at least 10 h. Blood was taken in gel-coated vacutainers, then centrifuged to separate serum and was stored at -20°C till further analysis.
Leptin level measurement
Leptin was measured by sandwich based ELISA kit (BioVendor, Germany). The ELISA plates were read on ELISA plate reader from Diamate.
Serum biochemical analysis
Serum biochemical parameters like fasting glucose level, cholesterol, and triglycerides were estimated with a semiautomated clinical chemistry analyzer Microlab 300.
Statistical analysis
SPSS 18.0 software was used to analyze data. All data was represented as mean ± SD or median (interquartile ranges). For comparison of means, t-test was used to find any statistical significance. Spearman’s correlation analysis was used to see the association of leptin levels with certain anthropometric and biochemical parameters. Statistical significance was taken if p value was less than 0.05.
Results
Subjects characteristics
A total of 80 subjects were included in this study and grouped on the basis of obesity, diabetes and gender status (Figure 1). The baseline characteristics for these groups are shown in Table 1.
| Biochemical/Clinical Parameters |
Type 2 Diabetes status |
Obesity status |
|
Gender status |
|
| Non-diabetics (n=40) |
Diabetics (n=40) |
P-value |
Non-obese (n=40) |
Obese (n=40) |
P-value |
Males (n=40) |
Females (n=40) |
P-value |
| BMI (kg/m2) |
27.5 ± 5.0 |
27.9 ± 5.1 |
0.71 |
23.9 ± 3.7 |
31.5 ± 4.0 |
<0.0001 |
26.5 ± 4.1 |
28.8 ± 5.6 |
0.04 |
| FG (mmol/l) |
4.9 (4.6-5.6) |
10.5 (8.0-13.8) |
<0.0001 |
5.9 (4.8-11.2) |
6.4 (4.9-8.3) |
0.59 |
8.9 (6.4-12.1) |
6.3 (12.4-4.9) |
0.25 |
| TC (mmol/l) |
4.4 (4.0-5.6) |
4.8 (4.2-5.5) |
0.44 |
4.6 (3.9-5.3) |
4.8 (4.2-5.9) |
0.31 |
4.3 (3.9-5.7) |
4.7 (4.2-5.6) |
0.69 |
| TG (mmol/l) |
1.2 (0.9-2.0) |
1.7 (1.3-2.5) |
0.005 |
1.6 (0.9-2.2) |
1.4 (1.1-2.4) |
0.97 |
1.6 (1.1-2.4) |
1.4 (1.9-1.0) |
0.52 |
| Leptin (ng/mL) |
6.3 (4.1-8.5) |
5.4 (7.7-4.3) |
0.35 |
4.7 (3.5-6.4) |
7.7 (5.2-9.2) |
<0.001 |
4.4 (3.3-5.5) |
8.3 (6.1-9.2) |
<0.0001 |
Data are given as the mean ± SD for BMI or as the median (interquartile range) for FG, TC, TG and leptin. The P-values were calculated using student’s t-test for continuous variables. BMI: body mass index; FG: fasting glucose; TC: total cholesterol; TG: triglycerides.
Table 1 Baseline characteristics of study subjects on the basis of diabetes, obesity and gender.
Comparison of study groups on the basis of diabetes, obesity and gender
Initial comparison was made on the basis of diabetes, obesity and gender (Table 1). Firstly, study subjects (n=80) were divided on the basis of diabetes irrespective of obesity and gender status (n=40 non-diabetic and n=40 type 2 diabetics) and analyzed for anthropometric, biochemical parameters and leptin levels. Secondly, the same parameters were analyzed after dividing the subjects on the basis of obesity without diabetes and gender status (n=40 non-obese and n=40 obese). Finally, the comparison was done on basis of gender (n=40 males and n=40 females).
Non-diabetic vs. Diabetics: The average age of non-diabetic and diabetics (mean years ± SD) was 48 ± 7 and 53 ± 6 respectively. Glucose levels and triglycerides levels showed significant differences when non-diabetic were compared with type 2 diabetics (Table 1): Glucose=55.4%↑, Triglycerides=33%↑ in the diabetics. However, leptin did not show any significant difference.
Non-obese vs. Obese subjects: The average age of non-obese and obese (mean years ± SD) was 52 ± 6 and 48 ± 7 respectively. Obese and non-obese subjects were significantly different in terms of BMI and leptin levels (Table 1): BMI=31.6%↑, Leptin=37%↑ in the obese. Correlation analysis (Table 2) showed a strong association between BMI and leptin levels (r=0.42, p=0.0001).
Males vs. Females: The average age of males and females (mean years ± SD) was 51 ± 6 and 51 ± 7 respectively. This comparison showed significant difference in terms of BMI and leptin levels when males were compared to females (Table 1): BMI=8.6%↑, Leptin=64.4%↑. Correlation analysis (Table 2) showed a strong association between BMI and gender (r=0.24, p=0.02).
Comparison on the basis of diabetes and obesity
Effect of diabetes on obesity: Non-diabetics (non-obese vs. obese subjects) were compared and significant differences were observed for BMI, cholesterol and leptin levels. Total cholesterol=18%↑, BMI=24%↑ and Leptin=26%↑ in nondiabetic obese group. When diabetics (non-obese vs. obese subjects) were compared, the significant difference was observed for BMI and leptin levels. BMI=24%↑, Leptin=52%↑ in diabetic obese group (Table 1).
Effect of obesity on diabetes: Non-obese (non-diabetics vs. diabetics) showed significant difference in glucose levels, cholesterol levels and triglycerides. No significant difference for leptin levels was observed. When obese (non-diabetics vs. diabetics) were compared only glucose levels showed significant difference (Table 1).
Gender based comparison on the basis of diabetes and obesity
Leptin and gender dimorphism: non-diabetics (non-obese and obese): Comparison between non-obese, non-diabetic (males vs. females) showed significant gender dimorphism for leptin levels as leptin levels were high up to 97% in female subjects. This shows leptin levels are higher in healthy females relative to healthy males. However, when obese but nondiabetic (males vs. females) were compared, the leptin levels were 63% high in females as compared to males (Table 1). This reflects that the obese females without diabetes leptin levels were lower as compare to non-obese females but still showed gender dimorphism.
Leptin and gender dimorphism: diabetics (non-obese and obese): In comparison of non-obese diabetic (males vs. females) leptin levels showed 42% higher levels in females while in comparison of obese diabetic (males vs. female) comparison, the leptin levels in females were 58% higher (Table 1).
Discussion
This is the first report of leptin and its correlation with diabetes and obesity from Faisalabad, Punjab, Pakistan. Leptin is a hormone secreted by adipose tissue and has an established role in maintaining balance between food intake and energy expenditure through its communication with central nervous system. In case of deficiency of leptin or leptin resistance in the body, the normal physiological functions of body get disturbed. Main outcome of leptin deficiency or resistance is obesity which further leads to many complications involving insulin resistance and type 2 diabetes mellitus. The present study was conducted with an aim to identify serum leptin levels in a representative population from Faisalabad, Punjab, Pakistan and to correlate these levels with certain anthropometric and biochemical parameters i.e. body mass index (BMI), serum glucose level, and serum lipid profile (cholesterol and triglyceride).
Leptin and BMI correlation is studied extensively in several populations with a major result of positive correlation between these two parameters [10,14,15]. Although there are few reports on leptin levels published from Pakistan but not for the Faisalabad region and present report is the first to show the leptin levels from subjects of this particular region. One of these reports indicated lower levels of serum leptin in obese subjects with type 2 diabetes [16] which is contradictory to our results in which leptin levels are high in obese subjects irrespective of the diabetes status. The reason for low levels of leptin may be a result of insulin deficiency (insulin is a major stimulator of leptin hence lower leptin lower insulin can be inferred) or altered fat distribution (diabetics have low subcutaneous fat and more visceral fat due to which the secretion of leptin changes as leptin is secreted more by subcutaneous fat thus affecting the overall serum leptin level). Gender based analysis in this report showed higher levels of leptin in female [16].
Another report from Pakistan showed strong association between leptin levels and body mass index. Increased levels of serum leptin in obese subjects without type 2 diabetes mellitus were reported. A progressive increase in serum leptin concentration was observed with an increase in BMI. These results are in agreement with our results. Hence leptin concentration is directly proportional to total adiposity so this result can be considered as an expected result. Females showed higher levels of leptin in this study as well [17].
A case-control study reported significantly higher serum leptin levels in obese diabetic and non-diabetic subjects as compared with non-obese diabetic patients and non-diabetic subjects. Leptin levels were positively correlated with serum insulin and C-peptide levels. Serum leptin increased with increase in body mass index. Leptin levels are increased in obesity and may play a role in development of insulin resistance and type 2 diabetes mellitus [18].
Leptin levels in different ethnic groups and neighboring populations are also studied in various reports. Serum leptin levels were evaluated in a group of non-obese type 2 diabetic patients from Mumbai, Western India. Results showed serum leptin levels were positively correlated to body mass index [10].
A report from Turkey showed positive correlation between leptin and BMI, lower leptin levels in obese women with diabetes than without diabetes and additionally it is even lower in the poorly controlled diabetes subgroup [11].
In a gender specific meta-analysis study from China higher leptin levels were found to be associated with elevated risk of type 2 diabetes in men but not in women 9 but in our population no association between leptin and diabetes was observed. As obesity, insulin resistance, and aging are closely associated and adipokines seem to have a crucial role in their pathophysiology. A study from Portugal reported close link between leptin levels with obesity and length of diabetes [19].
Association among obesity, leptin and insulin resistance in type 2 diabetes mellitus was studied in an Indian population in which leptin and insulin resistance showed no correlation. Study concluded that, obesity mainly of central or abdominal type might be responsible for the insulin resistance in type 2 diabetes mellitus whereas leptin, a potential marker for obesity was probably not involved. This perhaps points towards the multifactorial causation of insulin resistance in type 2 diabetes mellitus [8].
A study in China showed no independent association between leptin and either diabetes or impaired fasting glucose (IFG) hence, leptin does not independently predict the risk of diabetes and IFG in older Chinese adults [15].
Yet, another study aimed to determinate both the oxidative stress and the concentration of leptin in obese, overweight and normal weight type 2 diabetes mellitus patients to seek possible association between oxidative stress and leptin levels. Positive correlation between oxidative stress status parameters and leptin in obese patients was observed which suggests that increased oxidative stress and increased leptin levels, both consequences of obesity, may play a role in type 2 diabetes mellitus development [20].
The present study has few limitations. Firstly, it is a onetime sampling study which does not show any effect of any medication or any effect with the time changes in individuals. Secondly, the sample size is small to predict any valid conclusion for a large set of population. Thirdly, we did not measure the fat distribution of our study subjects which can be correlated with the levels of leptin. Finally, we do not have data for diabetes duration which can be used to see the association between leptin, obesity and diabetes duration if any.
Conclusion
Our results from a representative group from Punjabi population of Faisalabad, Pakistan are consistent with the results in other neighboring populations. The level of serum leptin increased up to 37% with obesity. No association between glucose and leptin levels were observed. Significant gender dimorphism for leptin levels was found in our study population as 64.4% increase in female subjects was observed. These results need to be replicated in large set of Pakistani population both in diabetics and subjects with impaired glucose tolerance.
Acknowledgements
Authors are grateful to all subjects for their participation in this study and also thank the Higher Education Commission, Pakistan for funding this study.
17404
References
- Baratta M (2002) Leptin-from a signal of adiposity to a hormonal mediator in peripheral tissues. Med Sci Monit 8: RA282-RA292.
- Zhang Y, Proenca R, Maffei M, Barone M, Leopold Let al. (1994) Positional cloning of the mouse obese gene and its human homologue. Nature 372: 425-432.
- Woods SC, D'Alessio DA (2008) Central control of body weight and appetite. J Clin Endocrinol Metab 93: S37-S50.
- Benoit SC, Clegg DJ, Seeley RJ, Woods SC (2004) Insulin and leptin as adiposity signals. Recent Prog Horm Res 59: 267-285.
- Farooqi IS, O'Rahilly S (2009) Leptin: a pivotal regulator of human energy homeostasis. Am J Clin Nutr 89: 980S-984S.
- El-Haschimi K, Lehnert H (2003) Leptin resistance-or why leptin fails to work in obesity. Exp Clin Endocrinol Diabetes 111: 2-7.
- Flier JS (1998) Clinical review 94: What's in a name? In search of leptin's physiologic role. J Clin Endocrinol Metab 83: 1407-1413.
- Das P, Bhattacharjee D, Bandyopadhyay SK, Bhattacharya G, Singh R (2013) Association of obesity and leptin with insulin resistance in type diabetes mellitus in Indian population. Indian J Physiol Pharmacol 57: 45-50.
- Chen GC, Qin LQ, Ye JK (2014) Leptin levels and risk of type diabetes: gender-specific meta-analysis. Obes Rev 15: 134-142.
- Marita AR, Sarkar JA, Rane S (2005) Type diabetes in non-obese Indian subjects is associated with reduced leptin levels: study from Mumbai, Western India. Mol Cell Biochem 275: 143-151.
- Buyukbese MA, Cetinkaya A, Kocabas R, Guven A, Tarakcioglu M (2004) Leptin levels in obese women with and without type diabetes mellitus. Mediators Inflamm 13: 321-325.
- Najam FRASS, Baig SM (2014) Serum adiponectin levels in diabetes, obesity and gender in Punjabi subjects from Faisalabad, Pakistan. Journal of Pak Med Ass 64: 1186-1187.
- WHO (2006) Definition and diagnosis of diabetes mellitus and intermediate hyperglycaemia: Report of a WHO/IDF consultation.
- Gu X, Chen Z, El Bayoumy I (2014) Serum leptin levels in obese women with and without type diabetes mellitus. Minerva Endocrinol 39: 223-229.
- Wang Z, Zhuo Q, Fu P, Piao J, Tian Y, et al. (2010) Are the associations of plasma leptin and adiponectin with type diabetes independent of obesity in older Chinese adults? Diabetes Metab Res Rev 26: 109-114.
- Kazmi A, Tariq KM, Hashim R (2012) Association of leptin with type diabetes in non-obese subjects. J Ayub Med Coll Abbottabad 24: 186-189.
- Paul RF, Hassan M, Nazar HS, Gillani S, Afzal N, et al. (2011) Effect of body mass index on serum leptin levels. J Ayub Med Coll Abbottabad 23: 40-43.
- Haque Z, Rahman MA (2003) Serum leptin levels in female patients with NIDDM. J Coll Physicians Surg Pak 13: 130-134.
- Coimbra S, Brandao Proenca J, Santos-Silva A, Neuparth MJ (2014) Adiponectin, leptin, and chemerin in elderly patients with type diabetes mellitus: a close linkage with obesity and length of the disease. Biomed Res Int 2014: 701915.
- Stefanovic A, Kotur-Stevuljevic J, Spasic S, Bogavac-Stanojevic N,Bujisic N (2008) The influence of obesity on the oxidative stress status and the concentration of leptin in type diabetes mellitus patients. Diabetes Res Clin Pract 79: 156-163.