Introduction
The pancreas is a large gland in animals and men, next to the liver, among the digestive glands connected to the intestines. It consists of exocrine and endocrine portions and takes the shape of a compound acinous gland. The exocrine portion is composed of ductal epithelial cells, centro-acinar cells, acinar cells and connective tissue cells, while the endocrine portion, designated as the islet of Langerhans, is composed of 3 types of endocrine cells, A, B, C cells and connective tissue cells.
We have studied the macromolecular synthesis of the ag- ing mouse pancreas at various ages by means of light and electron microscopic radioautography. We first studied the DNA synthesis of mouse pancreas by LM and EM RAG us- ing 3H-thymidine [1,2,3]. Light and electron microscopic radioautograms (LM and EM RAG) of the pancreas revealed that the nuclei of pancreatic acinar cells, centro-acinar cells, ductal epithelial cells, and endocrine cells were labeled with 3H-thymidine demonstrating DNA synthesis. The numbers of labeled cells were counted and the labeling indices of these cells in 10 groups of litter mate mice, fetal day 19, postnatal day 1, 3, 7, 14, and month 1, 6, 12 (year 1) and 24 (2 years) were analyzed. The labeling indices of these cells reached the maxima at day 1 after birth and decreased gradually from prenatal embryo to postnatal day 1, 7, 14, month 1, 6, month 12, and month 24 or 2 years. The maximum of the labeling indices in the acinar cells proceeded to the ductal and centro- acinar cells, suggesting that the acinar cells completed their development earlier than the ductal and centro-acinar cells [1,2,3].
On the other hand, LM and EM RAG of pancreas of mouse injected with 3H-uridine into the aging mice from embryo to postnatal year 2, demonstrated its incorporation into exocrine and then in endocrine cells, and more in pancreatic acinar cells than in ductal or centro-acinar cells [1,2,3]. Among the acinar cells, the number of silver grains increased after birth to day 7 and day 14, and then decreased to month 1, 2, 6, 12, and 24 with aging. Quantification of silver grains in the nucleoli, chromatin, and cell body were carried out by X-ray microanalysis [4,5,6], which verified the results obtained by visual grain counting. In EM RAG obtained from the pancreas of fetal day 19 embryos, newborn day 1 and newborn day 14 mice labeled with 3H-uridine, demonstrating RNA synthesis, the number of silver grains in the nucleoli, nuclear chromatin and cytoplasm increased [6,7]. In order to quantify physi- cally the silver contents of grains observed over the nucleoli, nuclei and cytoplasm, X-ray spectra were recorded by energy dispersive X-ray microanalysis (JEM-4000EX TN5400), dem- onstrating Ag-Ka peaks at higher energies.
On the other hand, in contrast to the DNA and RNA syntheses in nuclei and nucleoli in various cells of aging mice, we also found the silver grains due to DNA and RNA syntheses in mitochondria of various isolated cells such as the livers and kidneys in vitro showing intramitochondrial DNA and RNA syntheses [8]. We later found that the activities of DNA and RNA syntheses in mitochondria of various cells changed due to aging of individual animals [8,9,10,11].
Thus, we have recently concentrated to clarify the intrami- tochondrial DNA and RNA as well as protein syntheses in various cells of aging mice [12], especially in the liver and the adrenal gland which contained many mitochondria [13]. This paper deals with the intramitochondrial macromolecular syn- theses in pancreatic acinar cells of aging ddY mice at various ages in many aging groups during development and aging from prenatal embryos to postnatal 2 years at senescence.
Methods
Animals
The pancreatic tissues observed in our studies were obtained from 30 groups of aging normal ddY strain mice, each con- sisting of 3 litter mates of both sexes, total 90, from prenatal embryo day 19 to newborn postnatal day 1, 3, 7, 14, adult at month 1, 2, 6, 12 (year 1) to month 24 (year 2). All the animals were housed under conventional conditions and bred with normal diet (mouse chow Clea EC2, Clea Co., Tokyo, Japan) with access to water ad libitum in our laboratory. They were administered with one of the macromolecular precursors, such as 3H-thymidine a DNA precursor, 3H-uridine, an RNA precursor, or 3H-leucine, a protein precursor, respectively.
Electron Microscopic Radioautography
All the animals were housed under conventional conditions and injected intraperitoneally with one of the precursors, such as 3H-thymidine or 3H-uridine or 3H-leucine (Amersham, England, specific activity 877 GBq/mM) in saline, at 9 a.m., one hour before sacrifices. The dosage of injections was 370 KBq/gm body weight. The animals were perfused at 10 a.m., one hour after the injection, via the left ventricles of the hearts with 0.1 M cacodylate-buffered 2.5% glutaral- dehyde under Nembutal (Abbott Laboratories, Chicago, ILL, USA) anesthesia. Then the pancreatic tissues were taken out, fixed and processed for electron microscopic radioautogra- phy. All the procedures used in this study concerning the animal experiments were in accordance with the guidelines of the animal research committee of Shinshu University School of Medicine as well as the principles of laboratory animal care in NIH publication No. 86-23 (revised 1985). The right end of the pancreatic gland was taken out from each animal, excised and 3 small pieces of the pancreatic tissues (size 1mm x 1mm x 1mm) were immersed in the same fixative at 4?C for 1 hr., followed by postfixation in 1% osmium tetroxide in the same buffer at 4?C for 1 hr., dehydrated in graded series of ethanol and acetone, and embedded in epoxy resin Epok 812 (Oken, Tokyo, Japan).
For electron microscopic radioautography, semithin sections at 0.2μm thickness, thicker than conventional ultrathin sections in order to shorten the exposure time, were cut in sequence on a Porter-Blum MT-2B ultramicrotome (Dupont- Sorvall, Newtown, MA, USA) using glass knives. The sec- tions were collected on collodion coated copper grid meshes (VECO, Eerbeek, Netherlands), coated with Konica NR-H2 radioautographic emulsion (Konica, Tokyo, Japan) by a wire- loop method [5,6,7]. They were stored in dark boxes con- taining silica gel (desiccant) at 4?C for exposure. After the exposure for 10 months, the specimens were processed for development in freshly prepared gold latensification solution for 30 sec at 16?C and then in fresh phenidon developer for 1 min at 16?C in a water bath, rinsed in distilled water and dried in an oven at 37?C overnight, stained with lead citrate solution for 3 min, coated with carbon for electron microscopy. The electron microscopic (EM) radioautograms were examined in a JEOL JEM-4000EX electron microscope (JEOL, Tokyo, Japan) at accelerating voltages of 400 KV for observing thick specimens.
For quantitative analysis of electron micrographs, twenty EM radioautograms showing cross sections of pancreatic acinar cells from each group, based on the electron microscopic photographs taken after observation on at least 100 pan- creatic acinar cells from respective animals were analyzed to calculate the total number of mitochondria in each cell, and the number of labeled mitochondria covered with silver grains by visual grain counting.
On the other hand, the number of silver grains in the same area size as a mitochondrion outside cells was also calculated in respective specimens as background fog, which resulted in less than 1 silver grain (0.02/mitochondrial area), i.e., almost zero. Therefore, the grain count in each specimen was not corrected with background fog. From all the data thus obtained the averages and standard deviations in respective aging groups were computed with a personal computer (Macintosh type 8100/100, Apple Computer, Tokyo, Japan). The data were stochastically analyzed using variance and Student’s t-test. The differences were considered to be significant at P value <0.01.
Results
DNA Synthesis in the Pancreas
The pancreatic tissues obtained from ddY strain mice at vari- ous ages from embryo day 19 to postnatal month 24, con- sisted of 2 portions, the exocrine portion (Figs. 1, 2) and the endocrine portion designated as the islets of Langerhans (Fig. 3). The exocrine portion is consisted of several cell types, the pancreatic acinar cells (Fig. 1), the centroacinar cells (Fig. 2), ductal cells and fibroblasts, as observed by electron micros- copy. The acinar cells are main components of the exocrine portions which contained well developed endoplasmic reticu- lum, zymogen granules, and many mitochondria in the cyto- plasm. Because the number of mitochondria in the pancreatic acinar cells was relatively much more than the other cells, only the pancreatic acinar cells were analyzed in this study. The DNA synthetic activity was analyzed by the incorporations of DNA precursor, i.e., 3H-thymidine, which was observed in the nuclei and mitochondria as observed by electron microscopic radioautography (Fig. 1-3).
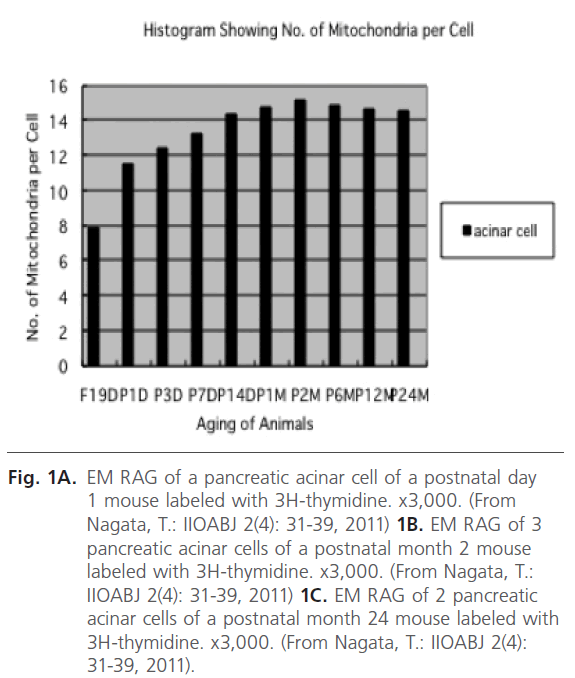
Fig. 1A. EM RAG of a pancreatic acinar cell of a postnatal day 1 mouse labeled with 3H-thymidine. x3,000. (From Nagata, T.: IIOABJ 2(4): 31-39, 2011) 1B. EM RAG of 3 pancreatic acinar cells of a postnatal month 2 mouse labeled with 3H-thymidine. x3,000. (From Nagata, T.: IIOABJ 2(4): 31-39, 2011) 1C. EM RAG of 2 pancreatic acinar cells of a postnatal month 24 mouse labeled with 3H-thymidine. x3,000. (From Nagata, T.: IIOABJ 2(4): 31-39, 2011).
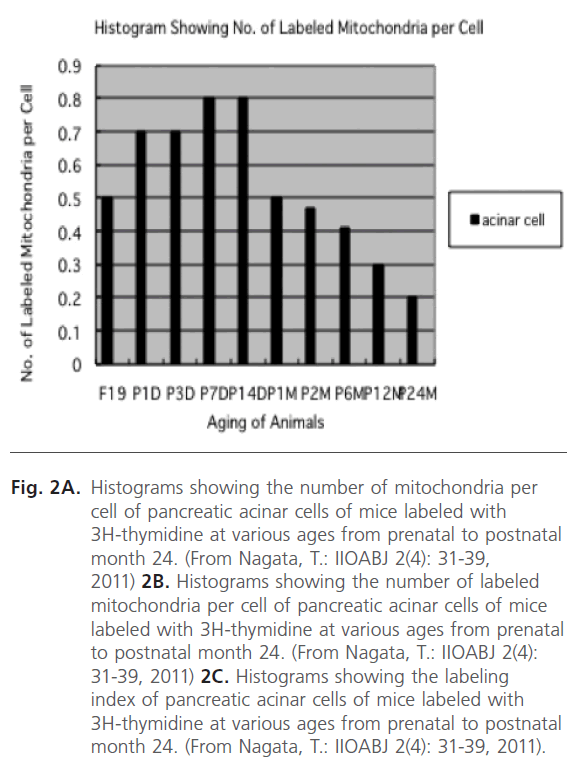
Fig. 2A. Histograms showing the number of mitochondria per cell of pancreatic acinar cells of mice labeled with 3H-thymidine at various ages from prenatal to postnatal month 24. (From Nagata, T.: IIOABJ 2(4): 31-39, 2011) 2B. Histograms showing the number of labeled mitochondria per cell of pancreatic acinar cells of mice labeled with 3H-thymidine at various ages from prenatal to postnatal month 24. (From Nagata, T.: IIOABJ 2(4): 31-39, 2011) 2C. Histograms showing the labeling index of pancreatic acinar cells of mice labeled with 3H-thymidine at various ages from prenatal to postnatal month 24. (From Nagata, T.: IIOABJ 2(4): 31-39, 2011).
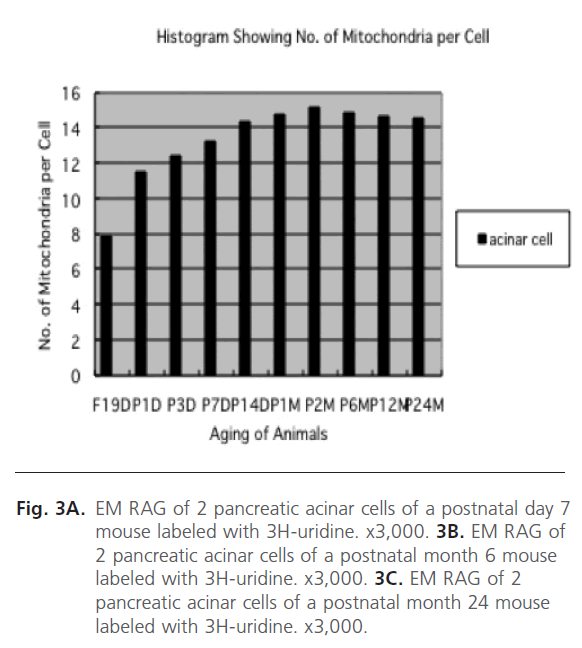
Fig. 3A. EM RAG of 2 pancreatic acinar cells of a postnatal day 7 mouse labeled with 3H-uridine. x3,000. 3B. EM RAG of 2 pancreatic acinar cells of a postnatal month 6 mouse labeled with 3H-uridine. x3,000. 3C. EM RAG of 2 pancreatic acinar cells of a postnatal month 24 mouse labeled with 3H-uridine. x3,000.
Observing electron microscopic radioautograms labeled with 3H-thymidine, the silver grains were found over the nuclei as well as over the mitochondria of some pancreatic acinar cells (Figs. 1-3), demonstrating DNA synthesis at respective aging stages from perinatal stages at embryonic day 19, to postnatal day 1 and day 3 and 7, and day 14 (Fig. 1-3), to adult stage at month 1, month 2 and 6, and to senescent stage at month 12 and 24. The localizations of silver grains over the mitochondria were mainly on the mitochondrial ma- trices similarly to other cells such as in the livers [13] or the adrenal glands [14].
Number of Mitochondria per Cell
Preliminary quantitative analysis on the number of mitochondria in 10 pancreatic acinar cells whose nuclei were labeled with silver grains and other 10 cells whose nuclei were not la- beled in each aging group revealed that there was no signifi- cant difference between the number of mitochondria and the labeling indices (P<0.01). Thus, the number of mitochondria and the labeling indices were calculated regardless whether their nuclei were labeled or not. The results obtained from the number of mitochondria in pancreatic acinar cells of re- spective animals in 10 aging groups at perinatal and newborn stages, from prenatal embryo day 19 to postnatal day 1 (Fig. 1A.), 3, 7, 14 (Fig. 1B), and adult and senescent stages at month 1 (Fig. 1C), 2, 6, 12, and 24, seemed to show an gradual increase from the prenatal day 19 to postnatal month 24. The numbers of zymogen granules increased due to the aging from prenatal embryo to postnatal day 1, 3, 7, 14 and to month 1, 2, reaching the maximum and did not increase to month 6, 12 and 24. Counting the number of mitochondria per cell at respective aging stages, it increased from prenatal embryo around 8.0/cell in average, to postnatal day 1 (11.5/ cell), to day 3 and 7 (12.3/cell), to day 14 (14.2/cell), to month 1 (14.8/cell), to month 2 (15.2/cell), then slightly decreased to month 6 (14.9/cell), to month 12 (14.5/cell) and finally to month 24 (14.4/cell) as shown in Fig. 2A. All the data from embryonic day 19 to postnatal month 24, were stochastically analyzed using variance and Student’s t-test. The increases of mitochondrial numbers in the pancreatic acinar cells from embryonic day 19 to adult stage at postnatal month 2 were considered to be significant at P value <0.01. However, the slight decrease at the senescent stage from month 6 to 24 were considered to be not significant at P value <0.01.
Mitochondrial DNA Synthesis in the Pancreas
The results of visual counting on the number of mitochondria labeled with silver grains obtained from 10 pancreatic acinar cells of each animal labeled with 3H-thymidine demonstrat- ing DNA synthesis in 10 aging groups at perinatal stages from prenatal embryo day 19 (0.5/cell), to postnatal day 1, 3, 7 and 14, to adult stages at month 1, 3, and 6, 12 and 24, increased gradually to day 1 (0.7/cell), to day 3 (0.7/cell) to day 7 (0.8/cell) and day 14 (0.8/cell), reaching the maximum, then decreased gradually to month 1 (0.5/cell), to month 2 (0.45/ cell), month 6 (0.4/cell), to month 12 (0.3/cell) and month 24 (0.2/cell) as shown in Fig. 2B. These data were stochastically analyzed using variance and Student’s t-test. The increases of the numbers of labeled mitochondria from embryo day 19 to postnatal day 14, as well as the decreases from day 14 to month 24 were significant (P <0.01).
The Labeling Index of Mitochondrial DNA Synthesis
Finally, the labeling indices of mitochondrial DNA synthesis in pancreatic acinar cells at respective aging stages were cal- culated from the number of labeled mitochondria (Fig. 2B) dividing by the number of total mitochondria per cell (Fig. 2A), which were plotted in Fig. 2C.
The results showed that the labeling indices decreased from prenatal day 19 (6.2%) to postnatal newborn day 1 (6.1 %), to postnatal day 3 (5.7%), then increased to day 7 (6.1%), and again decreased to day 14 (5.7 %), to adult stages at month 1 (3.4%), month 2 (3.1 %), month 6 (2.8%), month 12 (2.1%) and 24 (1.4%) as shown in Fig. 2C. From the results, the decreases of the mitochondrial labeling indices in pancreatic cells from prenatal day 19 to postnatal day 1 and 3 and again from postnatal day 7 to day 14, to postnatal month 1, 2, 6, 12 and 24 were stochastically significant (P <0.01).
RNA Synthesis in the Pancreas
The RNA synthetic activity was analyzed by the incorporations of RNA precursor, i.e., 3H-uridine, which was observed in the nuclei and cytoplasm including mitochondria as observed by electron microscopic radioautography.
Observing electron microscopic radioautograms labeled with 3H-uridine, the silver grains were found over the nuclei as well as over the mitochondria of some pancreatic acinar cells (Figs. 3A,B,C), demonstrating RNA synthesis at respective aging stages from perinatal stages at embryonic day 19, to postnatal day 1 and day 3 and 7 (Fig. 3A), and day 14, to adult stage at month 1, month 2 and 6 (Fig. 3B), and to senescent stage at month 12 and 24 (Fig. 3C). The localiza- tions of silver grains over the mitochondria were mainly on the mitochondrial matrices similarly to other cells such as in the livers [13] or the adrenal glands [14].
Number of Mitochondria per Cell
Preliminary quantitative analysis on the number of mitochondria in 10 pancreatic acinar cells whose nuclei were labeled with silver grains and other 10 cells whose nuclei were not la- beled in each aging group revealed that there was no signifi- cant difference between the number of mitochondria and the labeling indices (P<0.01). Thus, the number of mitochondria and the labeling indices were calculated regardless whether their nuclei were labeled or not. The results obtained from the number of mitochondria in pancreatic acinar cells of re- spective animals in 10 aging groups at perinatal and newborn stages, from prenatal embryo day 19 to postnatal day 1, 3, 7, 14, and adult and senescent stages at month 1, 2, 6, 12, and 24, seemed to show an gradual increase from the prenatal day 19 to postnatal month 24 (Fig. 3C). The numbers of zymogen granules increased due to the aging from prenatal embryo to postnatal day 1, 3, 7, 14 and to month 1, 2, reaching the maximum and did not increase to month 6, 12 and 24. Counting the number of mitochondria per cell at respec- tive aging stages, it increased from prenatal embryo around 8.7/cell in average, to postnatal day 1 (11.2/cell), to day 3 (12.1/cell), to day 7 (13.2/cell), to day 14 (14.5/cell), to month 1 (14.8/cell), to month 2 (15.2/cell), then slightly decreased to month 6 (14.9/cell), to month 12 (14.7/cell) and finally to month 24 (14.6/cell) as shown in Fig. 4A. All the data from embryonic day 19 to postnatal month 24, were stochastically analyzed using variance and Student’s t-test. The increases of mitochondrial numbers in the pancreatic acinar cells from embryonic day 19 to adult stage at postnatal month 2 were considered to be significant at P value <0.01. However, the slight decrease at the senescent stage from month 6 to 24 were considered to be not significant at P value <0.01.
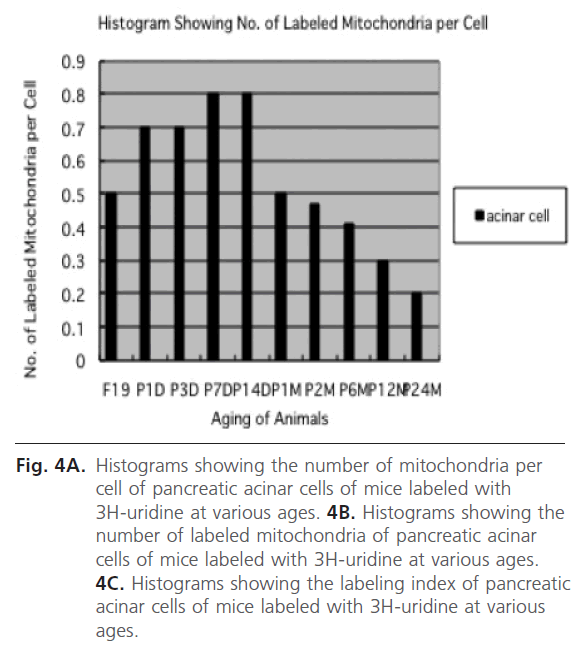
Fig. 4A. Histograms showing the number of mitochondria per cell of pancreatic acinar cells of mice labeled with 3H-uridine at various ages. 4B. Histograms showing the number of labeled mitochondria of pancreatic acinar cells of mice labeled with 3H-uridine at various ages. 4C. Histograms showing the labeling index of pancreatic acinar cells of mice labeled with 3H-uridine at various ages.
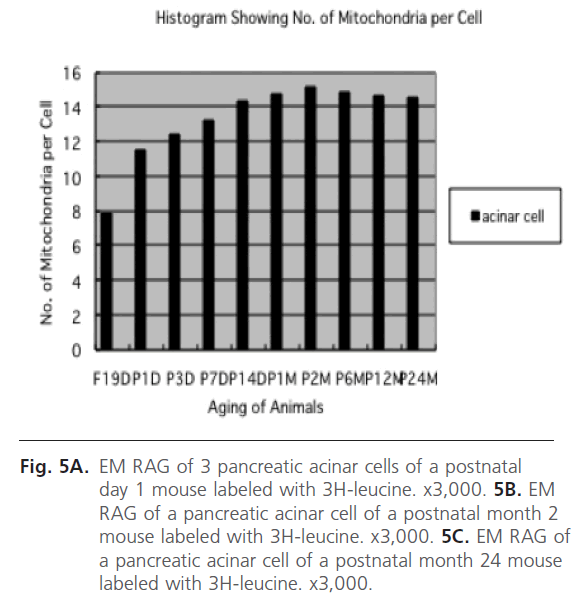
Fig. 5A. EM RAG of 3 pancreatic acinar cells of a postnatal day 1 mouse labeled with 3H-leucine. x3,000. 5B. EM RAG of a pancreatic acinar cell of a postnatal month 2 mouse labeled with 3H-leucine. x3,000. 5C. EM RAG of a pancreatic acinar cell of a postnatal month 24 mouse labeled with 3H-leucine. x3,000.
Mitochondrial RNA Synthesis
The results of visual counting on the number of mitochondria labeled with silver grains obtained from 10 pancreatic acinar cells of each animal labeled with 3H-uridine demonstrating RNA synthesis in 10 aging groups at perinatal stages, from prenatal embryo day 19 (3.2/cell), postnatal day 1, 3, 7 and 14, to adult stages at month 1, 3, and 6, 12 and 24, increased gradually to day 1 (4.1/cell), to day 3 (4.5/cell) to day 7 (5.2/ cell) and day 14 (5.9/cell), to month 1 (6.1/cell), to month 2 (6.3/cell), reaching the maximum, then decreased gradually to month 6 (6.2/cell), to month 12 (5.9/cell) and month 24 (5.8/cell) as shown in Fig. 4B. These data were stochastically analyzed using variance and Student’s t-test. The increases of the numbers of labeled mitochondria from embryo day 19 to postnatal month 2 were stochastically significant (P <0.01). However, the decreases from month 2 to month 24 were not significant.
The Labeling Index of Mitochondrial RNA Synthesis
Finally, the labeling indices of mitochondrial RNA synthesis in pancreatic acinar cells at respective aging stages were cal- culated from the number of labeled mitochondria (Fig. 8B) dividing by the number of total mitochondria per cell (Fig. 4A), which were plotted in Fig. 4C.
The results showed that the labeling indices gradually in- creased from prenatal day 19 (36.7%) and postnatal newborn day 1 (36.6%), to postnatal day 3 (37.2%), to day 7 (39.4%), to day 14 (40.7 %), to adult stages at month 1 (41.2%), to month 2 (41.4 %), month 6 (41.6%), reaching the maximum, and then decreased to month 12 (40.1%) and 24 (39.7%) as shown in Fig. 4C. From the results, the increases of the mitochondrial labeling indices in pancreatic cells from embryo day 19 and newborn postnatal day 1 to postnatal day 7 to month 6, as well as the decreases from month 6 to month 12 and 24 were stochastically significant (P <0.01).
Protein Synthesis in the Pancreas
The protein synthetic activity was analyzed by the incorporations of protein precursor, i.e., amino acid 3H-leucine which was observed in the nuclei and cytoplasm such as mitochondria, endoplasmic reticulum, Golgi apparatus, or zymogen granules as observed by electron microscopic radioautography.
Electron microscopic radioautograms labeled with 3H-leucine showed that the silver grains were found over the nuclei as well as over the cytoplasm including mitochondria, endo- plasmic reticulum, Golgi apparatus, or secretory granules of almost all the pancreatic acinar cells (Figs. 5A,B,C), demonstrating protein synthesis at respective aging stages from perinatal stages at embryonic day 19, to postnatal day 1 (Fig. 5A) and day 3 and 7, and day 14, to adult stage at month 1, month 2 (Fig. 5B), 6, and to senescent stage at month 12 and 24 (Fig. 5C). The localizations of silver grains over the mitochondria were mainly on the mitochondrial matrices similarly to other cells such as in the livers [13] or the adrenal glands [14].
Number of Mitochondria per Cell
Preliminary quantitative analysis on the number of mitochondria in 10 pancreatic acinar cells whose nuclei were labeled with silver grains and other 10 cells whose nuclei were not labeled in each aging group revealed that there was no sig- nificant difference between the number of mitochondria and the labeling indices (P<0.01). Thus, the number of mito- chondria and the labeling indices were calculated regardless whether their nuclei were labeled or not. The results obtained from the number of mitochondria in pancreatic acinar cells of respective animals in 10 aging groups at perinatal and newborn stages, from prenatal embryo day 19 to postnatal day 1, 3, 7, 14, and adult and senescent stages at month 1, 2, 6, 12, and 24, seemed to show an gradual increase from the prenatal day 19 to postnatal month 24. The numbers of zymogen granules increased due to the aging from prena- tal embryo to postnatal day 1, 3, 7, 14 and to month 1, 2, reaching the maximum and did not increase to month 6, 12 and 24. Counting the number of mitochondria per cell at respective aging stages, it increased from prenatal embryo day 19 (around 8.5), to postnatal day 1, 3, 7, 14 (14.1/cell), month 1, 2 (15.2/cell), 6, 12 and 24 (14.6/cell) as shown in Fig. 6A. All the data from embryonic day 19 to postnatal month 24, were stochastically analyzed using variance and Student’s t-test. The increases of mitochondrial numbers in the pancreatic acinar cells from embryonic day 19 to adult stage at postnatal month 2 were considered to be significant at P value <0.01.
Mitochondrial Protein Synthesis
The results of visual counting on the number of mitochondria labeled with silver grains obtained from 10 pancreatic acinar cells of each animal labeled with 3H-leucine demonstrat- ing protein synthesis in 10 aging groups at perinatal stages, from prenatal embryo day 19 (4.6/cell), increased gradually to postnatal day 1 (5.5/cell), day 3 (6.6/cell) day 7 (7.4/cell) and day 14 (8.8/cell), to month 1 (9.6/cell), month 2 (11.4/ cell), reaching the maximum, then decreased gradually to month 6 (10.5/cell), month 12 (10.1/cell) and month 24 (9.7/ cell) as shown in Fig. 6B. These data were stochastically analyzed using variance and Student’s t-test. The increases of the numbers of labeled mitochondria from embryo day 19 to postnatal month 2, were stochastically significant (P <0.01). However, the decreases from month 2 to month 24 were not significant.
The Labeling Index of Mitochondrial Protein Synthesis
Finally, the labeling indices of mitochondrial protein synthesis in pancreatic acinar cells at respective aging stages were cal- culated from the number of labeled mitochondria (Fig. 6B) dividing by the number of total mitochondria per cell (Fig. 6A), which were plotted in Fig. 6C.
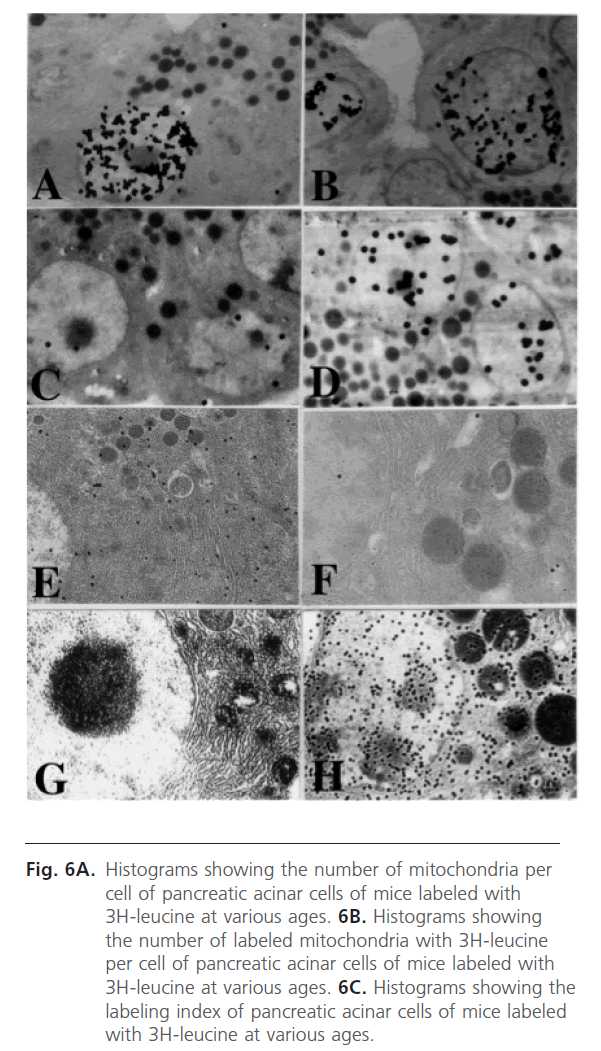
Fig. 6A. Histograms showing the number of mitochondria per cell of pancreatic acinar cells of mice labeled with 3H-leucine at various ages. 6B. Histograms showing the number of labeled mitochondria with 3H-leucine per cell of pancreatic acinar cells of mice labeled with 3H-leucine at various ages. 6C. Histograms showing the labeling index of pancreatic acinar cells of mice labeled with 3H-leucine at various ages.
The results showed that the labeling indices gradually in- creased from prenatal day 19 (54.1%) and postnatal newborn day 1 (52.9%), to postnatal day 3 (54.5%), to day 7 (57.4%), to day 14 (61.5 %), to adult stages at month 1 (65.3%), to month 2 (75.1 %), reaching the maximum, then decreased to month 6 (70.5%), to month 12 (68.2%) and 24 (66.1%) as shown in Fig. 6C. From the results, the increases of the mitochondrial labeling indices in pancreatic cells from embryo day 19 and newborn postnatal day 1 to postnatal day 7 to month 2, as well as the decreases from month 2 to month 12 and 24 were stochastically significant (P <0.01).
Discussion
From the results obtained in the present study on the pan- creatic acinar cells of ddY aging mice at various ages in 30 groups from perinatal stages at embryo day 19, to newborn day 1, 3, 7, 14, and young adult at postnatal month 1, 2, 6 as well as the senescent adult at postnatal month 12 and 24 in our laboratory, it was shown that intramitochondrial macro- molecular syntheses, including nucleic acids, both DNA, RNA, as well as proteins, were observed in the pancreatic acinar cells of all the aging stages from prenatal embryos to post- natal newborn, young juvenile and adult senescent stages and the number of mitochondria per cell showed increases due to aging, while the number of labeled mitochondria per cell and the labeling indices showed increases and decreases due to aging. These results demonstrated that intramitochon- drial macromolecular synthesis in the pancreatic acinar cells revealed variations due to aging of individual animals depending upon the cellular activities at respective aging stages.
With regards to the macromolecular synthesis in various cells in various organs of experimental animals observed by light and electron microscopic radioautography, it is well known that the silver grains due to radiolabeled 3H-thymidine dem- onstrate DNA synthesis [1,4,6,10,12-18]. The previous re- sults obtained from the studies on the hepatocytes of aging mice by light and electron microscopic radioautography revealed that silver grains indicating DNA synthesis incorporat- ing 3H-thymidine were observed over the nuclei of some hepatocytes at perinatal stages from postnatal day 1 to day 14 and decreased due to aging [15-18]. Then, we lately ob- served the intramitochondrial DNA synthesis in the various organs such as the livers [12,13,19-22] adreno-cortical cells [14,23-26] and adreno-medullary cells [14,27,28], at vari- ous ages from fetal day 19 to postnatal newborn day 1, 3, 7, juvenile day 14 and to adult stage at month 1, 2, 6, 12 and 24. In the present study, further data obtained from the pan- creatic acinar cells from prenatal to adult senescent animals at postnatal month 12 and 24 [91] were added.
From these studies, the numbers of silver grains showing nuclear RNA synthesis resulting from the incorporations of 3H-uridine into mitochondria indicating mitochondrial RNA synthesis demonstrated the silver grain localization over the mitochondria independently from the nuclei whether the nu- clei were labeled with silver grains or not in the pancreatic aci- nar cells from prenatal embryo day 19 to postnatal month 24 during the development and aging. The numbers of labeled mitochondria showing RNA synthesis as well as the labeling indices increased from perinatal embryonic day to postnatal newborn and juvenile stages at day 14, to adult postnatal month 1, 2, 6, reaching the maxima, and then decreased to the senescent stages at month 12 and 24.
With regards to DNA in mitochondria in animal cells or plas- tids in plant cells, many studies have been reported in vari- ous cells of various plants and animals since 1960s [29-34]. Most of these authors observed DNA fibrils in mitochondria which were histochemically extracted by DN’ase. Electron microscopic observation of the DNA molecules isolated from the mitochondria revealed that they were circular in shape, with a circumference of 5-6 μm [35]. It was calculated that such a single molecule had a molecular weight of about 107 daltons [36]. Mitochondria of various cells also contained a DNA polymerase, which was supposed to function in the replication of the mitochondrial DNA [37]. On the other hand, the incorporations of 3H-thymidine into mitochondria dem- onstrating DNA synthesis were observed by means of elec- tron microscopic radioautography in lower organism such as slime mold [38,39], tetrahymena [40] or chicken fibroblasts in tissue culture under abnormal conditions [41]. However, these authors used old-fashioned developers consisting of methol and hydroquinone (MQ-developer), which produced coarse spiral silver grains resulting in inaccurate localization over cell organelles when observed by electron microscopy. All of these authors showed photographs of electron radio- autographs with large spiral-formed silver grains (2-3 μm in diameter) localizing not only over the mitochondria but also outside the mitochondria. In order to obtain smaller silver grains, we first used elon-ascorbic acid developer after gold latensification [7,15], which produced comma-shaped smaller silver grains (0.4-0.8 μm in diameter). Then later we used phenidon developer after gold latensification, producing dot- like smaller silver grains (0.2-0.4 μm in diameter) localizing only inside the mitochondria showing ultrahigh resolution of radioautograms [1,12,13,42,43]. These papers were the first which demonstrated intramitochondrial DNA synthesis incorporating 3H-thymidine with accurate intramitochondrial localization in avian and mammalian cells. With regards to the resolution of electron microscopic radioautography, on the other hand, many authors discussed the sizes of silver grains under various conditions and calculated various values of resolutions [8,10,44-46]. Those authors who used the M-Q developers maintained the resolution to be 100-160 nm [44,45], while those authors who used the elon-ascorbic acid developer [8,10,46] calculated it to be 25-50 nm. When we used phenidon developer at 16?C for 1 min after gold latensi- fication, we could produce very fine dot-shaped silver grains and obtained the resolution around 25 nm [1,12,13,42,43,46]. For the analysis of electron radioautographs, Salpeter et al. [40] proposed to use the half-distance and very complicat- ed calculations through which respective coarse spiral-shaped silver grains were judged to be attributable to the radioac- tive source in a certain territory within a resolution boundary circle. However, since we used phenidon developer after gold latensification to produce very fine dot-shaped silver grains, we judged only the silver grains which were located in the mitochondria which were dot-shaped very fine ones to be attributable to the mitochondria without any problem as was formerly discussed [8,10,12,13,42,43].
Then we also demonstrated intramitochondrial DNA synthe- sis incorporating 3H-thymidine in some other established cell lines originated from human being such as HeLa cells [8,10] or mitochondrial fractions prepared from in vivo mammalian cells such as rats and mice [9,11]. It was later commonly found in various cells and tissues not only in vitro obtained from various organs in vivo such as the cultured human HeLa cells [47], cultured rat sarcoma cells [48], mouse liver and pan- creas cells in vitro [48,50,51], but also in vivo cells obtained from various organs such as the salivary gland [52], the liver [53-64], the pancreas [65], the trachea [66], the lung [67], the kidney [68], the testis [69,70], the uterus [71,72], the adrenal gland [73-75], the brain [76], and the retina [77-81] of mice, rats and chickens. Thus, it is clear that all the cells in various organs of various animals synthesize DNA not only in their nuclei but also in their mitochondria.
The relationship between the intramitochondrial DNA synthe- sis and cell cycle was formerly studied in synchronized cells and it was clarified that the intramitochondrial DNA synthesis was performed without nuclear involvement [8]. However, the relationship between the DNA synthesis and the aging of individual animals and men has not yet been fully clarified except a few papers published by Korr and associates on mouse brain [82-85]. They reported both nuclear DNA repair, measured as nuclear unscheduled DNA synthesis, and cyto- plasmic DNA synthesis labeled with 3H-thymidine in several types of cells in the brains such as pyramidal cells, Purkinje cells, granular cells, glial cells, endothelial cells, ependymal cells, epithelial cells as observed by light microscopic radioau- tography using paraffin sections. They observed silver grains over cytoplasm of these cells by light microscopy and main- tained that it was reasonable to interpret these labeling as 3H-DNA outside the nuclei, which theoretically belonged to mitochondrial DNA without observing the mitochondria by electron microscopy. From the results, they concluded that distinct types of neuronal cells showed a decline of both un- scheduled DNA and mitochondrial DNA syntheses with age in contrast that other cell types, glial and endothelial cells, did not show such age-related changes without counting the number of mitochondria in respective cells nor counting the labeling indices at respective aging stages. Thus, their results from the statistics obtained from the cytoplasmic grain count- ing seem to be not accurate without observing mitochondria directly. To the contrary, we had studied DNA synthesis in the livers of aging mice [53-64] and clearly demonstrated that the number of mitochondria in each hepatocytes, es- pecially mononucleate hepatocytes, increased with the ages of animals from the perinatal stages to adult and senescent stages, while the number of labeled mitochondria and the labeling indices increased from the perinatal stages, reaching a maximum at postnatal day 14, then decreased.
Our previous studies [59,60] also clarified that the DNA syn- thesis and cell proliferation by mitosis were the most active in the nuclei of mononucleate hepatocytes at the perinatal stages in contrast that binucleate cells were less active at the perinatal stage but the number of binucleate hepato- cytes increased at senescent stages and the results suggest the possibility that the mitochondria in mononucleate hepa- tocytes synthesized their DNA by themselves which peaked at postnatal day 14 in accordance with the proliferation of mononucleate hepatocytes while binucleate hepatocytes increased after the perinatal stage and did not divide but remained binucleate keeping many mitochondria in their cytoplasm which were more in number than mononucleate hepatocytes at the senescent stage.
Thus, our previous papers were the first which dealt with the relationship between the DNA synthesis and aging in hepato- cytes of mice in vivo at various ages by means of electron microscopic radioautography observing the small dot-like silver grains, due to incorporations of 3H-thymidine, which exactly localized inside the mitochondria.
Later we also studied intramitochondrial DNA synthesis in adreno-cortical cells from prenatal day 19 to postnatal day 1, 3, 9, 14, month 1, 2, 6, 12 and 24 (year 2) and found that the numbers of mitochondria in 3 zones, zona glomerulosa, zona fasciculate and zona reticularis, increased reaching the maxima at postnatal month 2 and kept continued until senes- cence up to 24 months (2 years). To the contrary, the numbers of labeled mitochondria and the labeling indices increased to postnatal month 2, reaching the maxima, then decreased to month 24 [23-28].
Later we also demonstrated the results from the RNA synthe- sis in the livers and adrenal glands of aging mice which also revealed that an increase was observed by direct observation on mitochondria at electron microscopic level and obtaining accurate mitochondrial number and labeling indices in the hepatocytes and adreno-cortical and adreno-medullary cells. In the present study, we also demonstrated the RNA synthesis in the pancreatic acinar cells in 10 groups of developing and aging mice. There was a discrepancy between our results from the hepatocytes [59,60] and the adrenal cells [23-28] as well as the pancreatic acinar cells at present and the results from the several types of cells in the brains by Korr et al. [82-85]. The reason for this difference might be due to the difference between the cell types (hepatocytes, adrenal cells, pancreatic cells from our results and the brain cells from their results) or the difference between the observation by light microscopy or electron microscopy, i.e., direct observation of mitochondria by electron microscopy in our results or light microscopy, i.e., indirect observation of mitochondria without observing any mitochondria by Korr et al. [82-85].
We also studied other macromolecular synthesis such as glu- cides, lipids and others than nucleic acids and proteins by means of suitable radiolabeled precursors.
Anyway, the results obtained from the pancreartic acinar cells of aging mice at present should form a part of special cyto- chemistry [17] in cell biology, as well as a part of special radio- autographology [12], i.e., the application of radioautography to the pancreas, as was recently reviewed by the present author including recent results dealing with various organs [86-93]. We expect that such special radioautographology and special cytochemistry should be further developed in all the organs in the future.
Conclusions
From the results obtained in our laboratory, it was concluded that almost all the pancreatic acinar cells in the pancreatic exocrine portions of mice at various ages, from prenatal em- bryo day 19 to postnatal newborn, day 1, 3, 7 and 14, and to postnatal month 1, 2, 6, 12 and 24, were labeled with silver grains showing DNA synthesis with 3H-thymidine, showing RNA synthesis with 3H-uridine and showing protein synthesis with 3H-leucine in their mitochondria, respectively. Quanti- tative analysis on the number of mitochondria in pancreatic acinar cells resulted in increases from the prenatal day to postnatal day 1, 3, 7, 14, to month 1 and 2, reaching the maximum at postnatal month 2, then slightly decreased to month 6, 12 and 24. To the contrary, the numbers of labeled mitochondria with 3H-thymidine and the labeling indices showing DNA synthesis also increased from prenatal day 19 to postnatal day 1, 3, 7 and 14, reaching the maximum at postnatal day 7 and 14, then decreased to month 1, 2, 6, 12 and 24, while the numbers of labeled mitochondria with 3H- uridine and the labeling indices showing RNA synthesis also increased from prenatal day 19 to postnatal day 14, to month 1, 2, and 6, reaching the maximum at postnatal month 2 and 6, and then decreased to month 12 and 24 and the numbers of labeled mitochondria with 3H-leucine and the labeling in- dices showing protein synthesis also increased from prenatal day 19 to postnatal day 14, to month 1 and 2, reaching the maximum at postnatal month 2, then decreased to month 6, 12 and 24. These results demonstrated that the number of mitochondria in the pancreatic acinar cells increased from perinatal stages to postnatal month 2 and 6, keeping the maximum up to month 24, while the activities of mitochon- drial DNA, RNA and protein syntheses increased to young adult stages at postnatal day 7 and 14, month 1, 2 and 6, reaching the maxima from day 7 to month 6 depending upon each precursor, then decreased to senescent stage at month 12 and 24 due to aging of animals.
Acknowledgments
This study was completed after the present author retired from Shinshu University School of Medicine and was not supported by any research grants from any foundations or national government. However, the most parts of the ex- periments employing radioactive precursors were carried out while the author worked at Shinshu University during the tenure before retirement and was supported by the Grants- in-Aids for Scientific Research from the Ministry of Educa- tion, Science, Sports and Culture of Japan Government (No. 090284, No. 501533, No. 56870001, No. 02454564). The author thanks Dr. Kiyokazu Kametani, Technical Official, Re- search Center for Instrumental Analysis, Shinshu University, for his technical assistance during the course of this study.
2478
References
- Nagata, T., Usuda, N. Image processing of electron microscopic radioaautograms in clinical electron microscopy. J Clin Electron Microsc. 1985; 18: 5-6.
- Nagata, T., Usuda, N., Ma, H. Electron microscopic radioautography of nucleic acid synthesis in pancreatic acinar cells of prenatal and postnatal aging mice. Proc. 11th Internat Cong Electron Microsc, Kyoto, Japan. 1986. 3: 2281-2282.
- Nagata, T., Usuda, N., Ma, H. Application of high voltage electron microscopy to histochemistry of whole mount preparations of cultured cells or thick sections from embedded tissues. Proc 11th Internat Cong Electron Microsc, Kyoto, Japan. 1986. 3: 1183-1184.
- Nagata, T., Usuda, N., Ma, H. Electron microscopic radioautograpahy of nucleic acid synthesis in pancreatic acinar cells of prenatal and postnatal aging mice. Proc 11th Internat Cong Electron Microsc, Kyoto, Japan. 1986. 3: 2281-2282.
- Nagata, T. Radiolabeling of soluble and insoluble compounds as demonstrated by light and electron microscopy. In: Wegmann RJ, Wegmann MA, editors. Recent Advances in Cellular and Molecular Biology. Vol. 6 Molecular Biology of Pyrimidines, DNA, peroxisomes, organelles and cell movements. Peeters Press, Leuven, Belgium. 1992. pp. 9-21.
- Nagata, T. Quantitative analysis of histochemical reactions: image analysis of light and electron microscopic radioautograms. Acta Histochem Cytochem 1993; 26: 281-291.
- Nagata, T. Quantitative light and electron microscopic radioautographic studies on macromolecular synthesis in several organs of prenatal and postnatal aging mice. Chinese J Histochem Cytochem 1993; 2: 106-108.
- Nagata, T. Radioautographic study on intramitochondiral nucleic acid synthesis: Its relationship to the cell cycle in cultivated cells. Proc 4th Internat Cong Histochem Cytochem, Kyoto, Japan. 1972. 1: 223-224.
- Nagata, T. Electron microscopic radioautography of intramitochondrial nucleic acid synthesis in mammalian cells in vitro. Proc 8th Internat Cong Electron Microsc, Canberra, Australia. 1974. 2: 346-347.
- Nagata, T. Electron microscopic radioautography of RNA synthesis of HeLa cells in culture. Histochemie. 1972. 32: 163-170.
- Nagata, T., Iwadare, N., Murata, F. Mitochondiral and nucleolar RNA synthesis as revealed by electron microscopic radioatography. Proc 5th Internat Cong Histochem Cytochem. Bucharest, Romania. 1976. 1: 242-243.
- 12] Nagata, T. Radioautographology, General and Special. In: Graumann W. editor, Progress in Histochemistry and Cytochemistry, Urban- Fischer, Jena, Germany, Vol. 32, No. 2. 2002. pp. 57-228.
- Nagata, T. Macromolecular synthesis in the livers of aging mice as revealed by electron microscopic radioautography. In: Sasse D, Schumacher U. editors, Progress in Histochemistry and Cytochemistry, Eslevier, Jena, Germany, Vol. 45, No. 1. 2010. pp. 1-80.
- Nagata, T. Chapter 2. Macromolecular synthesis in mitochondria in adrenal glands of mice as observed by electron microscopy. In: Campbell MJ. editor, DNA Microarrays, Synthesis and Synthetic DNA, Nova Science Publishers, NY, USA, Vo. 1. 2011. pp. 72-166.
- Nagata, T., Shibata, O., Nawa, T. Incorporation of tritiated thymidine into mitochondrial DNA of the liver and kidney cells of chickens and mice in tissue culture. Histochemie 1967; 10: 305-308.
- Nagata, T. Aging changes of macromolecular synthesis in various organ systems as observed by microscopic radioautogtraphy. Methods Find Exp Clin Pharmacol. 1999; 21: 683-706.
- Nagata, T. Special cytochemistry in cell biology. In: Jeon KW. editor, International Review of Cytology, Vol. 211, Chapter 2. Academic Press, N. Y., USA. 2001. pp. 33-154.
- Nagata, T. Light and electron microscopic radioautographic studies on macromolecular synthesis in amitotic hepatocytes in aging mice. Cell Mo Biol. 2003; 49: 591-611.
- Nagata, T. Macromolecular synthesis in hepatocyte mitochondria of aging mice as revealed by electron microscopic radioautography. I: Nucleic acid synthesis. In: Mendez-Vilas A, Diaz J. editors, Modern Research and Educational Topics in Microscopy. Formatex Micrscopy Series No. 3, Formatex, Badajoz, Spain, Vol. 1. 2007. pp. 245-258.
- Nagata, T. Macromolecular synthesis in hepatocyte mitochondria of aging mice as revealed by electron microscopic radioautography. II: Protein synthesis. In: Mendez-Vilas A, Diaz J. editors, Modern Research and Educational Topics in Microscopy. Formatex Micrscopy Series No. 3, Formatex, Badajoz, Spain, Vol. 1. 2007. pp. 259-271.
- Nagata, T. Sexual difference between the macromolecular synthesis of hepatocyte mitochondria in male and female mice in aging as revealed by electron microscopic radioautography. Chapter 22. In: Bennninghouse HT, Rosset AD. editors. Women and Aging: New Research, Nova Biomedical Books, New York, USA. 2009. pp. 461- 487.
- Nagata, T. Protein synthesis in hepatocytes of mice as revealed by electron microscopic radioautography. In: Esterhouse TE, Petrinos LB. editors. Protein Biosynthesis, Nova Biomedical Books, New York, USA. 2009. pp. 133-161.
- Nagata, T. Electron microscopic radioautographic study on mitochondrial DNA synthesis in adrenal cortical cells of developing mice. J Cell Tissue Res. 2008; 8: 1303-1312.
- Nagata, T. Electron microscopic radioautographic study on mitochondrial DNA synthesis in adrenal cortical cells of developing and aging mice. The Sci. World J. 2008; 8: 683-697.
- Nagata, T. Electron microscopic radioautographic study on mitochondrial DNA synthesis in adreno-cortical cells of aging ddY mice. Bull Shinshu Inst Alternat Med Welfare 2009; 4: 51-66.
- Nagata, T. Electron microscopic radioautographic study on mitochondrial RNA synthesis in adreno-cortical cells of aging mice. Open Anat J. 2010; 2: 91-97.
- Nagata, T. Electron microscopic radioautographic study on mitochondrial DNA synthesis in adrenal medullary cells of developing and aging mice. J Cell Tissue Res. 2009; 9: 1793-1802.
- Nagata, T. Electron microscopic radioautographic study on DNA synthesis of mitochondria in adrenal medullary cells of aging mice. Open Anat J. 2009; 1: 14-24.
- Nass, S., Nass, MMK. Intramitochondrial fibers with DNA characteristics. I. Fixation and electron staining reactions. II. Enzymatic and other hydrolytic treatments. J Cell Biol. 1963; 19: 593-629.
- Gibor, A., Granick, S. Plastids and mitochondria: Inheritable system. Science 1964; 145: 890-897.
- Gahan, PB., Chayen, J. Cytoplasmic deoxyribonucleic acid. Internat. Rev. Cytol. 1965; 18: 223-247.
- Nass, M. M. K. The circularity of mitochondrial DNA. Proc Nat Acad Sci US 1966; 56: 1215-1222.
- van Bruggen, EFJ., Borst, P., Ruttenberg, GJC., Gruber, M., Kroon, AM. Circular mitochondrial DNA. Biochim Biophys Acta 1966; 119: 437- 439.
- Sinclair, JH., Stevens, BJ. Circular DNA filaments from mouse mitochondria. Proc Nat Acad Sci US 1966; 56: 508-514.
- Schatz, G. Biogenesis of mitochondria. In: Racker E editor, Membranes of Mitochondria and Chloroplasts. Van Nostrand-Reinhold, New York, USA. 1970. pp. 251-314.
- Guttes, E., Guttes, S. Thymidine incorporation by mitochondria in Physarum polycephalum. Science 1964; 145: 1057-1058.
- Schuster, FL. A deoxyribose nucleic acid component in mitochondria of Didymium nigirpes, a slime mold. Exp Cell Res 1965; 39: 329-345.
- Stone, GE., Miller, OL Jr. A stable mitochondrial DNA in Tetrahymena puriformis. Exp Zool 1965; 159: 33-37.
- Chévremont, M. Cytoplasmic deoxyribonucleic acids: Their mitochondrial localization and synthesis in somatic cells under experimental conditions and during the normal cell cycle in relation to the preparation for mitosis. Cell Growth and Cell Division. Symposia of the Internat Soc for Cell Biol. Vol. 2, Harris RJC editor, Academic Press, New York, USA. 1963. pp. 323-333.
- Salpeter, MM., Bachmann, L., Salpeter, EE. Resolution in electron microscope radioautography. J Cell Biol. 1969; 44: 1-20.
- Nadler, NJ. The interpretation of grain counts in electron microscope radioautography. J Cell Biol. 1971; 49: 377-382.
- Nagata, T. Techniques and application of electron microscopic radioautography. J Electron Microsc. 1996; 45: 258-274.
- Nagata, T. Techniques and application of microscopic radioautography. Histol Histopathol 1997; 12: 1091-1124.
- Uchida, K., Mizuhira, V. Electron microscope autoradiography with special reference to the problem of resolution. Arch Histol Jap. 1971; 31: 291-320.
- Murata, F., Yoshida, K., Ohno, S., Nagata, T. Electron microscopic radioautography using a combination of phenidon developer and domestic emulsion. Acta Histochem Cytochem 1979; 12: 443-450.
- Nagata, T. Electron microscopic observation of target cells previously observed by phase-contrast microscopy: Electron microscopic radioautography of laser beam irradiated cultured cells. J Clin Electron Microsc. 1984; 17: 589-590.
- Nagata, T., Murata, F., Yoshida, K., Ohno, S., Iwadare, N. Whole mount radioautography of cultured cells as observed by high voltage electron microscopy. Proc 5th Internat Conf High Voltage Electron Microsc. Kyoto, Japan. 1977. pp. 347-350.
- Nagata, T., Iwadare, N., Murata, F. Electron microscopic radioautography of nucleic acid synthesis in cultured cells treated with several carcinogens. Acta Pharmacol Toxicol. 1977; 41: 64-65.
- Nagata, T., Murata, F. Electron microscopic dry-mounting radioautography for diffusible compounds by means of ultracryotomy. Histochemistry 1977; 54: 75-82.
- Nagata, T., Ohno, S., Murata, F. Electron microscopic dry-mounting radioautography for soluble compounds. Acta Pharmacol Toxicol. 1977; 41: 62-63.
- Nagata, T., Nawa, T., Yokota, S. A new technique for electron microscopic radioautography of soluble compouds. Histochemie 1969; 18: 211-249.
- Nagata, T., Ito, M., Chen, S. Aging changes of DNA synthesis in the submandibular glands of mice as observed by light and electron microscopic radioautography. Ann Microsc. 2000; 1: 13-22.
- Nagata, T., Ohno, S., Kawahara, I., Yamabayashi, S., Fujii, Y., Murata, F. Light and electron microscopic radioautography of nucleic acid synthesis in mitochondria and peroxisomes of rat hepatic cells during and after DEHP administration. Acta Histochem Cytochem 1979; 16: 610-611.
- Nagata, T., Ohno, S., Yoshida, K., Murata, F. Nucleic acid synthesis in proliferating peroxisomes of rat liver as revealed by electron microscopical radioautography. Histochem J. 1982; 14: 197-204.
- Nagata, T., Fujii, Y., Usuda, N. Demonstration of extranuclear nucleic acid synthesis in mammalian cells under experimental conditions by electron microscopic radioautography. Proc 10th Internat Cong Electron Microsc, Hamburg, Germany, Vol. 2. 1982. pp. 305-306.
- Ma, H., Nagata, T. Studies on DNA synthesis of aging mice by means of electron microscopic radioautography. J Clin Electron Microsc. 1988; 21: 335-343.
- Ma, H., Nagata, T. Electron microscopic radioautographic study of DNA synthesis in the livers of aging mice. J Clin Electron Microsc. 1988; 21: 715-716.
- Ma, H., Gao, F., Sun, L., Jin, C., Nagata, T. Electron microscopic radioautographic study on the synthesis of DNA, RNA and protein in the livers of aging mice. Med Electron Microsc. 1994; 27: 349-351.
- Nagata, T. Light and electron microscopic radioautographic studies on macromolecular synthesis in amitotic hepatocytes of aging mice. Cell Mol Biol. 2003; 49: 591-611.
- Nagata, T., Ma, H. Electron microscopic radioautographic study on mitochondrial DNA synthesis in hepatocytes of aging mouse. Ann Microsc. 2005; 5: 4-18.
- Nagata, T. Electron microscopic radioautographic study on protein synthesis in hepatocyte mitochondria of developing mice. Ann Microsc. 2006; 6: 42-54.
- Nagata, T. Electron microscopic radioautographic study on macromolecular synthesis in hepatocyte mitochondria of aging mouse. J Cell Tissue Res. 2007; 7: 1019-1029.
- Nagata, T. Electron microscopic radioautographic study on nucleic acids synthesis in hepatocyte mitochondria of developing mice. Trends Cell Mol Biol. 2007; 2: 19-33.
- Nagata, T. Electron microscopic radioautographic study on protein synthesis in mitochondria of binucleate hepatocytes in aging mice. The Sci World J. 2007; 7: 1008-1023.
- Nagata, T., Usuda, N., Ma, H. Electron microscopic radioautography of nucleic acid synthesis in pancreatic acinar cells of prenatal and postnatal aging mice. Proc 11th Internat Cong Electron Microsc, Kyoto, Japan, Vol. 3. 1986. pp. 2281-2282.
- Sun, L., Gao, F., Jin, C., Nagata, T. DNA synthesis in the trachea of aging mice by light and electron microscopic radioautography. Acta Histochem Cytochem 1997; 30: 211-220.
- Nagata, T., Sun, L. Electron microscopic radioautographic study on mitochondrial DNA and RNA syntheses in pulmonary cells of aging mice. Ann Microsc. 2007; 7: 36-59.
- Hanai, T., Nagata, T. Electron microscopic radioautographic study on nucleic acid synthesis in perinatal mouse kidney tissue. Med Electron Microsc. 1994; 27: 355-357.
- Gao, F., Ma, H., Sun, L., Jin, C., Nagata, T. Electron microscopic radioautographic study on the nucleic acid and protein synthesis in the aging mouse testis. Med Electron Microsc. 1994; 27: 360-362.
- Gao, F., Chen, S., Sun, L., Kang, W., Wang, Z., Nagata, T. Radioautographic study of the macromolecular synthesis of Leydig cells in aging mouse testis. Cell Mol Biol. 1995; 41: 145-150.
- Yamada, AT., Nagata, T. Light and electron microscopic radioautography of DNA synthesis in the endometria of pregnant ovariectomized mice during activation of implantation window. Cell Mol Biol. 1992; 38: 763-774.
- Yamada, AT., Nagata, T. Light and electron microscopic radioautographic studies on the RNA synthesis of peri-implanting pregnant mouse uterus during activation of receptivity for blastocyst implantation. Cell Mol Biol. 1993; 39: 221-233.
- Ito, M., Nagata, T. Electron microscopic radioautographic study on DNA synthesis and the ultrastructure of the adrenal gland in aging mice. Med Electron Microsc. 1996; 29: 145-152.
- Ito, M. Radioautographic studies on aging changes of DNA synthesis and the ultrastructural development of mouse adrenal gland. Cell Mol Biol. 1996; 42: 279-292.
- Nagata, T. Electron microscopic radioautographic study on mitochondrial DNA synthesis in adrenal cortical cells of developing mice. J Cell Tis Res. 2008; 8: 1303-1312.
- Cui, H., Gao, F., Ma, H., Nagata, T. Study on DNA synthesis of cellular elements in the cerebella of aging mice by light and electron microscopic radioautography. Proc 4th China-Japan Joint Histochem Cytochem Symp, Chongqing Publishing House, Chongqing, China. 1996. pp. 111-112.
- Gunarso, W. Radioautographic studies on the nucleic acid synthesis in the retina of chicken embryo II. Electron microscopic radioautography. Shinshu Med J. 1984; 32: 241-248.
- Gunarso, W., Gao, F., Cui, H., Ma, H., Nagata, T. A light and electron microscopic radioautographic study on RNA synthesis in the retina of chick embryo. Acta Histochem 1996; 98: 300-322.
- Gunarso, W., Gao, F., Nagata, T. Development and DNA synthesis in the retina of chick embryo observed by light and electron microscopic radioautography. Cell Mol Biol. 1997; 43: 189-201.
- Kong, Y., Nagata, T. Electron microscopic radioautographic study on nucleic acid synthesis of perinatal mouse retina. Med Electron Microsc. 1994; 27: 366-368.
- Nagata, T. Aging changes of macromolecular synthesis in the avian and mammalian eyes as revealed by microscopic radioautography. Ann Rev Biomed Sci. 2006; 8: 33-67.
- Korr, H., Phillipi, V., Helg, C., Schiefer, J., Graeber, M. B., Kreutzberg, G. W. Unscheduled DNA synthesis and mitochondrial DNA synthetic rate following injuring of the facial nerve. Acta Neuropathol. 1997; 94: 557-566.
- Korr, H., Kurz, C., Seidler, TO., Sommer, D., Schmitz, C. Mitochondrial DNA synthesis studied autoradiographically in various cell types in vivo. Braz J Med Biol Res. 1998; 31: 289-298.
- Schmitz, C., Axmacher, B., Zunker, U., Korr, H. Age related changes of DNA repair and mitochondrial DNA synthesis in the mouse brain. Acta Neuropathol 1999; 97: 71-81.
- Schmitz, C., Materne, S., Korr, H. Cell-type-specific differences in age- related changes of DNA repair in the mouse brain - Molecular basis for a new approach to understand the selective neuronal vulnerability in Alzheimer’s disease. J Alzheimer’s Disease 1999; 1: 387-407.
- Nagata, T. Recent studies on macromolecular synthesis labeled with 3H-thymidine in various organs as revealed by electron microscopic radioautography. Cur Radiopharm 2009; 2: 118-1128.
- Nagata, T. Electron microscopic radioatuographic studies on macromolecular synthesis in mitochondria of various cells. 18EMSM Conference Proc 9th Asia-Pacific Microscopy Conference (APMC9), Kuala Lumpur, Malaysia. 2009. pp. 48-50.
- Nagata, T. Electron microscopic radioautographic studies on macromolecular synthesis in mitochondria of animal cells in aging. Ann Rev Biomed Sci. 2009; 11: 1-17.
- Nagata, T. Electron microscopic radioautographic studies on macromoleclular synthesis in mitochondria of some organs in aging animals. Bull Shinshu Inst Alternat Med Welfare 2009; 4: 15-38.
- Nagata, T. Electron microscopic radioautographic studies on macromolecular synthesis in mitochondria of animal cells in aging. Ann Rev Biomed Sci. 2010; 12: 1-29.
- Nagata, T. DNA synthesis in the pancreatic acinar cells of aging mice as revealed by electron microscopic radioautography. IIOABJ (Institute of Integrative Omics and Applied Biotechnology Journal) 2011; 2: 31- 39.
- Nagata, T. RNA synthesis in the pancreatic acinar cells of aging mice as revealed by electron microscopic radioautography. Curr Radiopharaceut 2011; 5. In press.
- Nagata, T. Electron microscopic radioautographic study on the protein synthesis in the pancreas of aging mice with special reference to mitochondria. Gastroenterol Res. 2011; 4: 114-121.