Keywords
|
| Cefamandole; Intravenous administration; Mathematical model |
Introduction
|
| Cefamandole, also known as cephamandole is a second generation broad-spectrum cephalosporin antibiotic. It is classified as a second generation of cephalosporin, is very effective against certain Gramnegative and Gram-positive microorganisms [1]. It is well suited for the use in situations which require rapid achievement of sufficient drug concentrations in blood. In the study [1], pharmacokinetics of cefamandole (administered intravenously over a period of 10 min to six normal healthy adult male volunteers was investigated. |
| The current study is a companion piece of a related Aziz study published in June issue 1978 of Journal of pharmacokinetics and Biopharmaceutics. The study cited here described an investigation of the pharmacokinetic behavior of cephamandole, intravenously administered, at a dose of 15 mg/kg over a period of 10 min to six normal healthy adults, healthy adult male volunteers. |
| The main goal of the current study was to present a further example which illustrated a successful use of an advanced mathematical modeling method based on the theory of dynamic systems in mathematical modeling in pharmacokinetics [2-12]. An additional goal was to motivate researchers in pharmacokinetics to use of an alternative modeling method, namely a modeling method based on the theory of dynamic systems to develop pharmacokinetic models. Previous examples presenting an advantageous use of the modeling method used in the current study can be found in the articles available online, which could be downloaded free of cost from the following Web pages of the author: https://www.uef.sav.sk/durisova.htm and https://www.uef.sav.sk/advanced.htm. |
Methods
|
| The data published in the study [1] were used. For modeling purposes, an advanced mathematical modeling method based on the theory of dynamic systems was employed; see e.g., the studies cited above. The development of mathematical was performed in the following steps: |
| In the first step of the method, a pharmacokinetic dynamic system, here denoted as H, was defined for each volunteer by relating the Laplace transform of the plasma concentration time profile of cephamandole, here denoted as C(s), and the Laplace transform of the intravenous input of cephamandole into the body, here denoted as I(s). |
| The development of a mathematical model of each dynamic system H, was based on the following simplifying assumptions: a) initial conditions of each dynamic system H, were zero; b) the pharmacokinetic processes occurring in the body after the intravenous cephamandole administration; were both linear and time-invariant, c) concentrations of cephamandole were the same throughout all subsystems of the pharmacokinetic dynamic system H (where subsystems were integral parts of the pharmacokinetic dynamic systems H); d) no barriers to the distribution and/or elimination of cephamandole existed. |
| In the second step of the method, the pharmacokinetic dynamic systems H, were used to mathematically represent static and dynamic aspects of the pharmacokinetic behavior of cephamandole in volunteers [2-12]. |
| In the third step of the method, transfer functions, here denoted as H(s), of pharmacokinetic dynamic systems H were derived by relating the Laplace transforms of the mathematical representations of the plasma concentration-time profiles of cephamandole, here denoted as C(s), and the Laplace transforms of the mathematical representations of the intravenous administration of cephamandole, here denoted as I(s), (the lower case letter “S” denotes the complex Laplace variable), see e.g., the following studies [3-12], references therein, and the following equation: |
 (1) (1) |
| Thereafter, the pharmacokinetic dynamic system of each volunteer was described with transfer function, here denoted as H(s) [3-12]. |
| For modeling purposes, the software named CTDB [8] and the transfer function model HM(s), described by the following equation were used: |
 (2) (2) |
| On the right-hand-side of Eq. (2) is the Padé approximant [13] of the model transfer function HM(s), G is an estimator of the model parameter called the gain of the dynamic system, a1…an,b1 …bm are the additional model parameters, n is the highest degree of the nominator polynomial, and m is the highest degree of the denominator polynomial, where n3-16]. |
In the fourth step of the method, the transfer function H(s), was converted to equivalent frequency response function, here denoted as  . . |
In the fifth step of the method, the non-iterative method published previously [17] was used to determine a mathematical model of the frequency response function  of each volunteer and point estimates of parameters of the model frequency response function in the complex domain. The model of the frequency response function used in the current study is described by the following equation: of each volunteer and point estimates of parameters of the model frequency response function in the complex domain. The model of the frequency response function used in the current study is described by the following equation: |
 (3) (3) |
| Analogously as in Eq. (2), n is the highest degree of the numerator polynomial of the model frequency response function , m is the highest degree of the denominator polynomial of the model frequency response function , n≤m,i is the imaginary unit, and w is the angular frequency in Equation 3. In the fifth step of the method, each the model frequency response function , was refined using the Monte-Carlo and the Gauss-Newton method in the time domain. |
| In the sixth step of the method, the Akaike information criterion [18] was used to select best models of frequency response functions , of different complexity with the minimum value of the Akaike information criterion. In the final step of the method, 95% confidence intervals for parameters of the final models were determined. |
| After the development of mathematical models of the pharmacokinetic dynamic systems H, the following primary pharmacokinetic variables were determined: The time of occurrence of the maximum observed plasma concentration of cefamandole, here denoted as tmax the maximum observed plasma concentration of cefamandole, here denoted as Cmax, the elimination half-time of cefamandole, here denoted as t1/2 the area under the plasma concentration-time profile of cefamandole from time zero to infinity, here denoted as, AUC0-∞, and total body clearance of cefamandole, here denoted as CI |
| The transfer function model, here denoted as HM(s) and the frequency response function model have been implemented in the computer program CTDB (8). A demo version of the computer program CTDB is available at the following Web site: https://www.uef. sav.sk/advanced.htm. |
Results
|
| The best-fit third-order model of selected with the Akaike information criterion is described by Eq. (4): |
 (4) (4) |
| This model provided an adequate fit to the cefamandole concentration data in all volunteers investigated in the previous (1) and the current study. Estimates of the model parameters a0,a1,b1,b2,b3 are listed in Table 1. Model-based estimates of primary pharmacokinetic variables of cefamandole are given in Tables 2 and 3. |
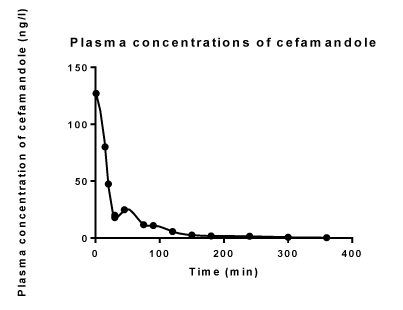
| Volunteer No. 1 was arbitrarily chosen from six volunteers investigated in the previous study [1] and in the current study, to illustrate the results obtained. Figure 1 illustrates the observed plasma concentration time profile of cefamandole and the description of the observed profile with the developed model of the pharmacokinetic dynamic system, defined for volunteer No. 1. Analogous results also hold for all volunteers investigated in the previous [1] and the current study. |
| The first peak of the plasma concentration of cefamandole was achieved immediately after the end of cefamandole infusion and the second peak of the plasma cefamandole concentration was approximately achieved at 45 min after the start of the cefamandole infusion (Figure 1). |
Discussion
|
| The pharmacokinetic dynamic systems used in the current study are mathematical objects, without any physiological relevance. They were used to model some static and dynamic aspects of the pharmacokinetic behavior of cefamandole [13-15] in the healthy male volunteers investigated in the previous [1] and current study. The method used in the current study has been described in detail in the previous studies [3-13], authored or co-authored by the author of the current study. |
| As in previous studies, the development of mathematical models of the pharmacokinetic dynamic systems was based on known inputs and outputs of the pharmacokinetic dynamic systems, in the current study. In general, if a dynamic system is modeled using a transfer function model; as it was the case in the current study (Equation 2), then the accuracy of the model depends on the degrees of the polynomials of the transfer function model used to fit the data, see e.g., the following studies [3-12]. |
| The parameter gain is also called gain coefficient, or gain factor. Generally, parameters gains are defined as relationships between magnitudes of outputs of dynamic systems to magnitudes of inputs to the dynamic systems at steady state. Or in other words, the parameter gains of dynamic systems are proportional values that show relationships between magnitudes of outputs to magnitudes of inputs of dynamic systems at the steady state. The pharmacokinetic meaning of parameters gains depend on the nature of investigated dynamic systems; see e.g., studies available at: https://www.uef.sav.sk/advanced.htm. |
| The non-iterative method published in the study [17] and used in the current study provides quick identification of optimal structures of models frequency responses. It is a great advantage of this method, because this significantly speeds up the development of frequency response models. |
| The reason for conversion of HM(s) to can be explained as follows: the variable:“s” in the transfer function model HM(s) is a complex Laplace variable (Equation 2), while the angular frequency w in (Equation 4), is a real variable, this proved to be suitable for modeling purposes. |
| The linear mathematical models developed in the current study sufficiently approximated static and dynamic aspects of the pharmacokinetic behavior of cefamandole in the volunteers investigated in the previous [1] and the current study. |
| The current study showed again that mathematical and computational tools from system engineering can be successfully used in mathematical modeling in pharmacokinetics. Frequency response functions are complex functions, therefore modeling is performed in the complex domain. The modeling methods used to develop model frequency response functions are computationally intensive, for accurate modeling they require at least a partial knowledge of the theory of dynamic system, and an abstract way of thinking about investigated dynamic systems. |
| The principal difference between traditional pharmacokinetic modeling methods and modeling methods that use of mathematical and computational tools from the theory of dynamic systems, is as follows: the former methods are based on mathematical modeling of plasma (or blood) concentration-time profiles of administered drugs, however the latter methods are based on mathematical modeling of dynamic relationships between a mathematically represented drug administration and a mathematically represented resulting plasma (or blood) concentration-time profile of the drug administered. See e.g., the studies and an explanatory example available at https://www.uef.sav. sk/advanced.htm. |
| The computational and modeling methods that use computational and modeling tools from the theory of dynamic systems can be used for example for adjustment of a drug (or a substance) dosing aimed at achieving and then maintaining required drug (or a substance) concentration–time profile in patients see e.g., the following study [6]. Moreover, the methods considered here can be used for safe and costeffective individualization of drug (or a substance) dosing of a drug and/or a substance, for example using computer-controlled infusion pumps. This is very important for administration of a clotting factor to a hemophilia patient, as exemplified in the simulation study [6]. |
| The advantages of the model and modeling method used in the current study are evident here: The models developed overcome one of the well-known limitations of compartmental models: For the development and use of the models considered here, an assumption of well-mixed spaces in the body (in principle unrealistic) is not necessary. The basic structure of the models developed using computational and modeling tools from the theory of dynamic systems are broadly applicable to develop mathematical models not only in the field of pharmacokinetics but also in several other scientific as well as practical fields. From a point of view of pharmacokinetic community, an advantage of the models developed using computational tools from the theory of dynamic systems is that the models considered here emphasize dynamical aspects of the pharmacokinetic behavior of a drug in a human and/or an animal body. Transfer functions of dynamic systems are not unknown in pharmacokinetics; see e.g., the following studies [19-21]. In pharmacokinetics, transfer functions are usually called disposition functions [22,23]. |
Conclusion
|
| The models developed and used in the current study successfully described the pharmacokinetic behavior of cefamandole after its intravenous administration over a period of 10 minutes to healthy male adult volunteers. The modeling method used in the current study is universal, comprehensive and flexible and thus it can be applied to a broad range of dynamic systems in the field of pharmacokinetics and in many other fields. The current study again showed that mathematical and computational tools from the theory of dynamic systems can be advantageously used in pharmacokinetic modeling. To see the previous examples illustrating the successful use of the modeling method employed in the current study please visit the author’s Web page, English version: https://www.uef.sav.sk/advanced. htm. The current study showed that an integration of pharmacokinetic and bioengineering approaches is a good and efficient way to study processes in pharmacokinetics, because such integration combines mathematical rigor with biological insight. |
Tables at a glance
|
|
|
Figures at a glance
|
 |
| Figure 1 |
|


