Keywords
|
| Microdialysis; Hydrofluoric acid diffusion; Fluoride permeation; in situ calibration of fluoride ions; Fluoride ion recovery |
Abbreviations
|
| HF: Hydrofluoric acid; MD: Microdialysis; % Recovery: Percent recovery by gain; F electrode: Fluoride ion selective electrode; Ca electrode: Calcium ion selective electrode; % CV: Coefficient of variation |
Introduction
|
| Hydrofluoric acid (HF) is one of the strongest inorganic acids, used for manufacture of variety of chemicals and for industrial glassetching, glass-polishing and metal cleaning. Accidental exposure to this acid produces serious injury and extended disability [1]. |
| Microdialysis technique for monitoring drug availability in tissues such as brain, heart, lung, skin or eye is well known and established [2- 5]. This sampling technique is based upon passive diffusion of molecules through a semi permeable membrane conforming to the Fick’s law [6,7]. MD probe can be placed nearly in any tissue, organ or fluid and the collected dialysate samples can be analyzed by a suitable analytical technique such as ion selective fluoride and calcium electrodes in our study [8,9]. The term recovery is often used in quantifying the MD measurements and it denotes the ratio between the concentration of analyte obtained in the microdialysate and its real concentration in the extracellular fluid surrounding the probe [10-12]. |
| The transport of fluoride through tissues is predominantly by nonionic diffusion. Though, due to very small sizes of both the HF and the fluoride ions both of these entities are able to diffuse very rapidly through the tissues [13-15]. However, there is not much data available for explaining the rate of diffusion. Therefore this arrangement of work coupling the MD technique with ion selective electrodes is intended to elucidate the diffusion of fluoride across full size sheep eye globe. |
| The eyes were selected as the model for study as the HF burns can cause serious corneal damage, ocular surface defects and a permanent loss in vision. The fundamental goal of any therapy for treating HF eye burns includes verification that effective concentrations of the pharmacological agent are attained within significant intraocular sections. Thus the study is relevant by suggesting the use of MD technique for demonstrating intraocular HF acid disposition in aqueous and vitreous humor segments, presenting crucial documentation of optimal drug dose and schedule [16,17]. |
| To detect the fluoride ion, a combination fluoride electrode, sensitive to fluoride ions and not to any of its complexed forms such as HF or HF2- was used. Use of this electrode for the assay of HF necessitates that all the fluoride is decomplexed prior to measurement of electrode potentials. To free the complexed fluoride, the pH of the solution must be adjusted from the weakly acidic to weakly basic region before making the determination. The dilution of samples and standards with a large excess of sodium acetate (10:1), buffers the pH to above 5 and helps to adjust the total ionic strength of samples and standards to the same level [18]. Higuchi’s model was used to describe the permeation pattern of fluoride ions, through the eyes. This equation shows that the permeation of fluoride ions is proportional to square root of time. Fick’s first law of diffusion was used to describe the diffusive flux of fluoride ions at any time point [19]. |
| In this study, HF diffusion was measured in terms of the fluoride content recovered in the microdialysate samples. The in vitro probe calibration and integrity test for assessing the diffusion of acid was performed. The palliative effect of calcium gluconate following ophthalmic HF contamination was studied. The concentrations of calcium gluconate solution for the treatment of HF toxicity ranges from 1%, 2.5%, 5% and 10% have been widely reported in the literature [20]. We selected the median concentrations of 2.5 and 5.0% to study their neutralization capacity. Two different formulations, solution (2.5% and 5.0% w/v calcium gluconate) and the 3% HPMC gel containing 2.5% w/v calcium gluconate were subjected to neutralization potential study. |
Materials and Methods
|
| MD-2204 BR-4 Brain microdialysis probe (BAS) with 4 mm membrane, BAS microinjection pump, sample collection apparatus, sheep eyes from euthanized animals obtained from Musa’s poultry farm, PermeGear Franz diffusion cell, anhydrous calcium gluconate powder, Hydrofluoric acid (48-51% w/w), Methocel K100 M premium grade, Spectra/Por molecular porous membrane (MWCO 3500 Daltons). |
|
Standard calibration curves for fluoride and calcium ions
|
| From the stock solution of 1 M HF, different concentrations (10-5- 1 M) were prepared by serial dilution method. Calibration curve was obtained for these concentrations using pH/mV meter (Corning pH/ mV meter 220). These calibration curves were used to determine the concentration of fluoride ions in subsequent experiments by using Thermo Scientific Fluoride ion selective electrode (F electrode) with serial number 9409BN. The same was repeated in case of calcium gluconate serial dilutions except the concentration (10-5-0.1 M) using Thermo Scientific Calcium ion selective electrode (Ca electrode) with serial number 9300BN. The Ag/AgCl electrode was used as the reference. |
|
Preparation of 2.5% calcium gluconate gel
|
| Methocel (6 g) was dispersed in 50 ml of warm water and 100 ml of cold water. The mixture was homogenized for 1 min at 2000 rpm and then the dispersion was left overnight. Calcium gluconate powder (5 g) was dissolved in 50 ml of warm water. The resultant calcium gluconate solution was slowly dispersed in the gel matrix and stirred to get a uniform consistency. |
|
In vitro probe calibration
|
| The efficiency of 4 mm BR microdialysis probes was tested by using the BAS microinfusion pump. The dialysate sample volumes were controlled by the syringe pump equipped with precision glass syringe. Since temperature affects the probe recovery, the in vitro studies were done at the temperature at which the probes were ultimately used in ocular experiments which was 25°C. |
| The property of the MD probe for dialyzing HF acid solution was checked by performing the in vitro probe experiments. During the experiments, it was observed that the fluoride ion recovery was not reproducible with Phosphate Buffer Saline as the perfusion medium. Therefore the probe efficiency testing was performed by perfusing distilled water at a constant flow rate of 4 μl/ min in 10 min interval. An equilibration time of 1 hour was given before the actual sampling to stabilize the probe. |
| To perform the probe efficiency test, various concentrations of HF were prepared in the range of 1 M to 10-5 M by serial dilution of the stock solution. The choice of HF concentration used for the testing was critical as HF acid is extremely corrosive. The concentrated acid solution could interact with probe material while the low concentration could be far below the detection limit of the F electrode (10-6 M to saturated). Hence, three different concentrations of HF were selected for in vitro testing in order to balance between the loss in probe integrity due to direct acid exposure and F electrode sensitivity. |
| Three samples were collected from the microdialysis probe effluent for each concentration in 300 μl polyethylene vials. The resultant 40 μl of samples were diluted to 10 ml volume using distilled water. The ionic strength of sample solution was adjusted with 9 parts of 15% sodium acetate solution as per the manufacturer’s recommendations. |
| The result was presented as Fluoride ion Percent recovery by gain (% recovery) and was calculated as: |
 |
| (Eq.1) |
| The % recovery values were plotted against the known HF acid concentration. |
|
Probe integrity
|
| Since HF is extremely corrosive acid, the interactions of HF and probe materials could add a bias to the results. It is appropriate, but not completely essential, for probe recoveries to be the same in all probes. The recovery studies were done on individual probes before their intended ocular use. |
| The probe membrane function of 4 mm BR microdialysis probes was tested in vitro. The probes were soaked in distilled water overnight after the recovery experiment. The following day the probes were placed in HF solution with a known concentration of 0.05 M. The check always started with a 30 min equilibration period with a flow rate of 4 μl/ min. The microdialysis probes were then tested with a flow rate of 4 μl/ min and with a sampling time of 10 min. Three samples were collected from each probe and the fluoride concentrations in dialysate fractions were calculated. A coefficient of variation (% CV) was calculated for each probe’s three measurements. The % recovery for each probe was calculated for dialysate samples in triplicate. The % CV was compared for all the ten probes used. |
|
Flow rate selection
|
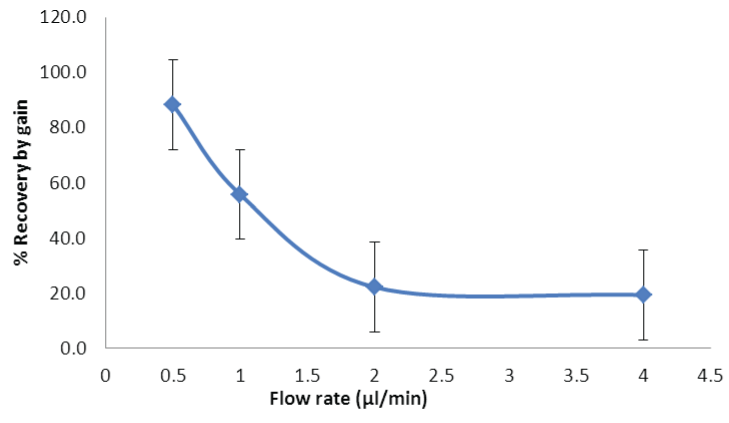
| The relation between recovery and flow rate was observed by placing the microdialysis probe in HF solution of 0.01 M concentration. The volume of dialysate fractions was held constant at 40 μl. The flow rates used for the experiments were 0.5, 1, 2 and 4 μl/ min. The constant dialysate volume of 40 μl was selected because with lower volume the F electrode was not sensitive enough and with the higher volumes, the sampling period was much longer. Three samples were collected for each flow rate, at 80, 40, 20 and 10 min respectively. The results were presented as relative % recovery by gain and were calculated using Equation I. |
|
Selection of eyes
|
| Sheep eyes were selected for this study. Eyes of sheep with average weight of 175-220 lb and age 3-4 years and of both the genders were used for this study. All the eyes were used within a week of time of sacrifice and 0.9% sodium chloride solution was used for preserving the freshly plucked eyes. Sheep eye has bigger globe compared to human and rabbit eye, convenient for probe insertion with accurate positioning. Moreover, sheep eyes were easily accessible from butcher’s shop. |
| The solution was replaced every day to keep the eyes fresh during the study. The eyes were inspected for any shrinkage or microbial growth by observing the frozen cut section histopathology from random eyes. |
|
In situ calibration
|
| Sheep eyes were carefully plucked out within 30 minutes of euthanizing the animal and stored in 0.9% sodium chloride and kept frozen until further use for the microdialysis experiment. |
| To create a pinhole in the sheep eye for making the passage of an MD probe, the eyes were incised using #14, 15, 16, 18, 20, 21 and 22- gauge needles. It was examined that the sheep eye has a very stiff structure with the top layer being slippery. The finer needle gauges could not give a sufficient insertion without altering the geometry of the eye while with the thicker gauges; the insertion was too deep causing the loss of aqueous humor or vitreous humor. Hence, 18-gauge needle was selected to get the desired point insertion of eyes. |
| An 18-gauge needle was inserted into the aqueous/vitreous humor and then the MD probe was carefully inserted into the cavity and was fixed with the adhesive so that there is no leakage of the fluids from the cavity. The adhesive (ethyl cyanoacrylate) does not interact with the study [21]. |
| The donor cell for the eye experiments consisted of both the aqueous and vitreous humors which represent a collective volume of about 5-8 ml based on the samples drawn during the study. The volume variance could be attributed to the change in the size, shape, age and physiological conditions of the sheep’s eye. |
| Full size sheep eye was used for the experimentation. The globe was supported using the customized holder to keep the eye structure secured in place. A volume of 0.15 ml of three HF acid concentrations was poured onto the surface of the eye to provide an illustration of the maximum flux. The dialysate samples were withdrawn in 80 μl aliquots at regular intervals of time, diluted with 15% sodium acetate solution prior to their fluoride measurement using the combination electrode. The probe was checked after the experiment, as described above. |
| For the calcium gluconate neutralization studies, the contaminated eyes were flushed with the excess of calcium gluconate solutions and gel to provide the adequate contact of the antidote ions during the whole experiment procedure. |
|
Cryotome sectioning
|
| HF burnt eye ball and normal eye ball was placed in 1% Formalin solution for 24 hours. Then, the eyes were placed in dry ice to make the 20 micron sections. Thereafter, corneal sections were cut and each section was placed on two separate slides, followed by 0.02% sodium fluorescein solution dyeing for three times. Fluorescence microscopy was used for visualization and image capturing from different positions. |
| The eyes were frozen in 0.9% sodium chloride solution and the solution was thawed whenever the eyes were required. The eyes were tested for any shrinkage and microbial growth by examining the histopathology of frozen cut section of randomly selected eyes under the scanning microscope before experiments each day. |
|
Data analysis
|
| For analyses of microdialysis samples, F electrode and Ca electrode were used to measure their respective concentration. The instrument was sensitive enough to detect these ions in the sampling range (10-6 M to saturated for fluoride ions). Microsoft Excel was used for analysis with the one and two factor ANOVA without replication (p<0.05) was used for each concentration for triplicate samples. |
Results and Discussion
|
|
Flow rate selection
|
| The influence of flow rate on % recovery of fluoride ions was observed, with 4 μl/min: 19.3% and 0.5 μl/min: 88.3% fluoride ions recovered respectively (Figure 2). The decrease in flow rate (<2 μl/ min) resulted in increased sampling time to collect a constant sample volume of 40 μl. It was observed by using ANOVA that that there is no significant effect of changes in flow rate on sampling interval (p>0.05, Fcritical). It was observed that due to the constraints in selecting high flow rates in our study, the relative recovery of 15-20% was found to be acceptable. An optimal flow rate of 4 μl/min was selected to balance between the loss in % recovery and long sampling times. |
| In vitro calibration |
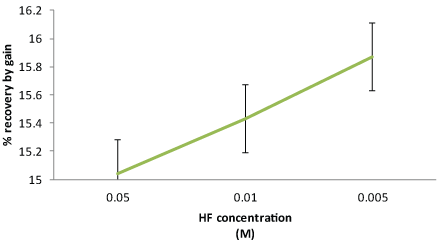
| The results from the % relative recovery for three different concentrations of HF are summarized in Figure 3. |
| Two factor ANOVA analysis showed that there was no significant effect of the sample, or concentration changes on the % recovery measurements for microdialysis probes at the p>0.05 (F=0.5218). It was observed that the recovery of fluoride ions reduced with increased concentration of HF to which the eye was exposed. The results showed that the MD probe is capable of dialyzing the HF solution without interacting with the probe, making the probe suitable for further in situ testing. |
| During the course of these recovery studies, it became obvious that the in vitro concentration ranges were too low and hence the ion selective electrodes may not be in the working range for use with microdialysis with in situ samples. As the samples collected from in situ probes, would have to travel through the tortuous and complex eye structure, the collected microdialysate levels will be really low in fluoride concentration. A difference of 1 ppm may affect the % recovery measurements and therefore, ocular changes could be missed or lost in the random variations of the electrode potentials. It was decided that the higher concentration of acid solutions would be poured for the ocular studies. |
|
Probe integrity
|
| The probe integrity test results for 0.05 M HF concentration including mean recovery and % CV values for ten probes are summarized in Table 1. The results show that 9 out of 10 probes give recovery values without significant variance and one of the probes had a high CV of 2.45% having possibility of experimental error. The single factor ANOVA analysis was used for calculating the significant effects of the % recovery values on each probe for the HF solution (p>0.05, F |
|
In situ calibration
|
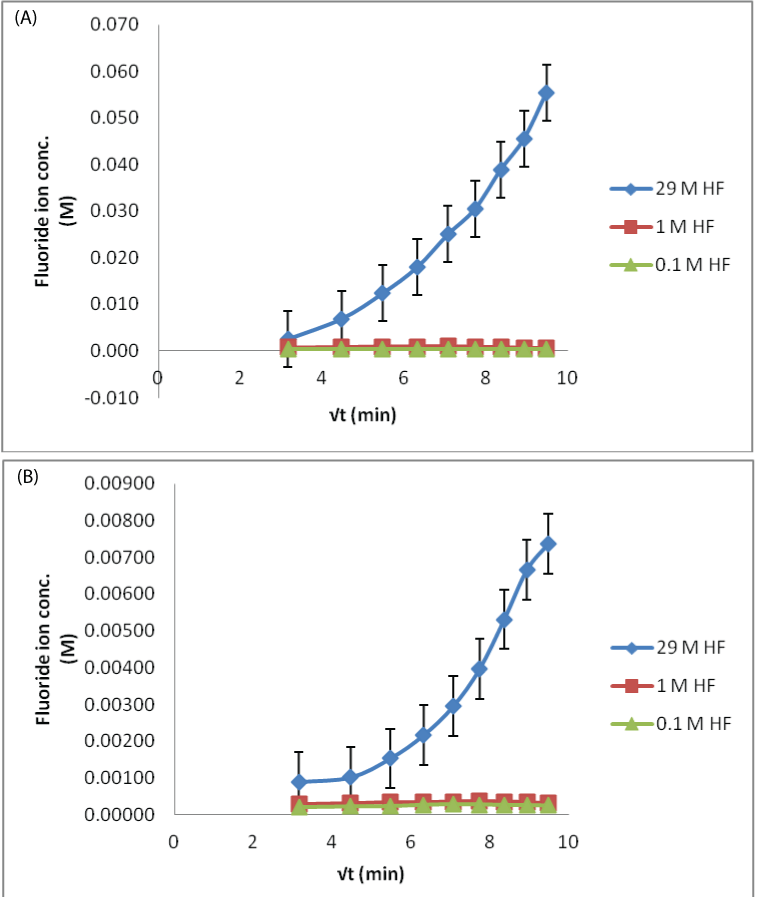
| The process of fluoride ion permeating in the eyes could be diagrammatically elaborated in Figure 4. The recoveries for the MD probe in three different concentrations of HF test solutions are shown. Simple trend i.e., increase in dialysate fluoride ion concentration, when the eyes were treated with higher concentration of HF was observed for both aqueous and vitreous humor sampling. The lower concentrations (0.1 and 1 M) did not show any appreciable difference in the fluoride ion permeation. As the samples collected from the in situ probes were small in volume, their dilution could have a more pronounced effect when the low concentration of acid was poured. The ion selective electrodes may not be suitable, possibly require more sensitive analytical technique. However, in the higher concentration, fluoride ion slope is positive and plateau after the 180 min time sample. This difference was because, as the HF acid permeates, it damages the corneal membrane and the influx increases as the time progresses. |
| In case of 0.1 M HF contamination, the lowest fluoride ion concentration observed in the dialysate was found to be 8 ppm, which is way higher than its safe permissible exposure limit of 3 ppm. So the study is clinically important from the toxicological point of view [22]. The rate of fluoride permeation decreases with the decrease in amount of HF exposure (29 M>1 M>0.1 M). |
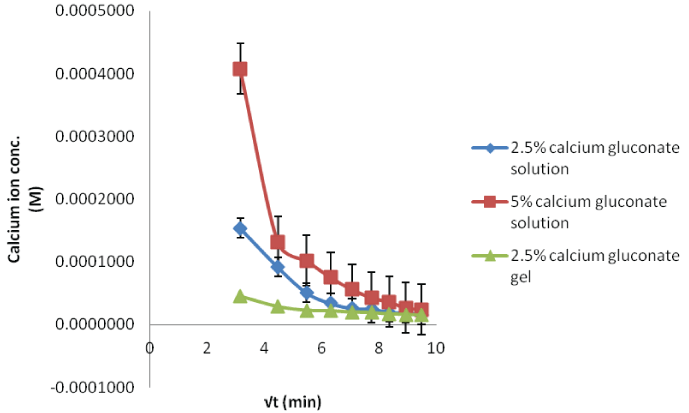
| In case of calcium studies, the influx decreases as the time progresses (Figure 5). With the higher concentration, permeation is high and the gel preparation shows the lowest influx due to slower release from formulation. |
| The study suggests that the MD technique can be employed for demonstrating the intraocular HF disposition in both the aqueous and vitreous humor segments. The fluoride and calcium control experiments give a point of comparison for target neutralization with calcium gluconate solutions and gel. |
| Applying single factor ANOVA, it could be concluded that there is no significant effect of concentration on fluoride diffusion for 29 M HF solution (p>0.05, Fcritical) for both aqueous and vitreous humor control samples. But there is a significant effect of concentration on fluoride diffusion when the eye was exposed to 0.1 and 1 M HF solutions for both aqueous and vitreous humor control samples. This means that the variations of recoveries in samples for low acid exposure could occur from the variability in assay method. This could be due to less sensitive analytical technique. |
| There is no significant difference in calcium ion concentrations for samples in the calcium control studies. It suggests that the assay method could measure the changes in calcium flux during in situ tests with the calcium gluconate samples. It confirms the Ca electrode usability for the neutralization studies. |
|
Calcium gluconate treatment
|
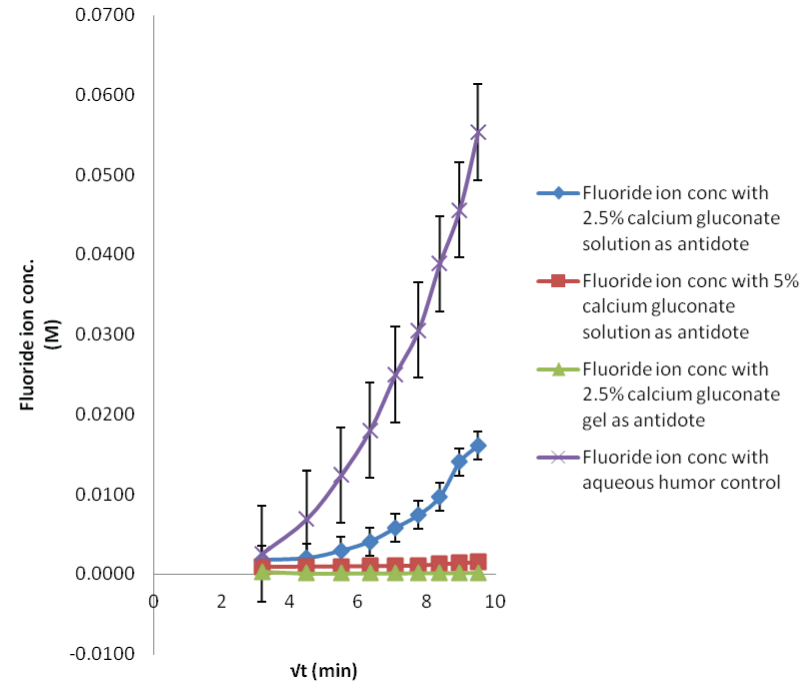
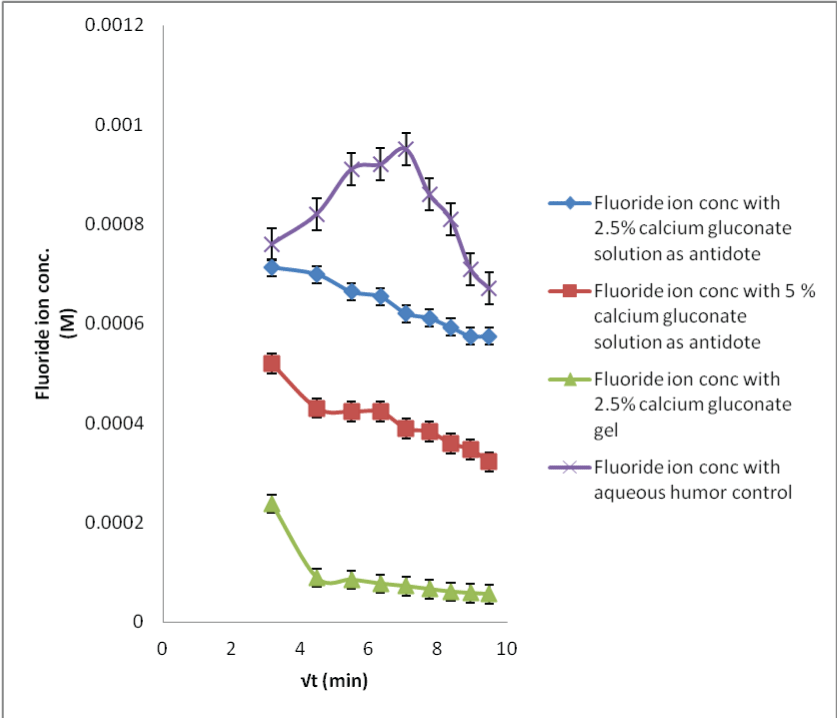
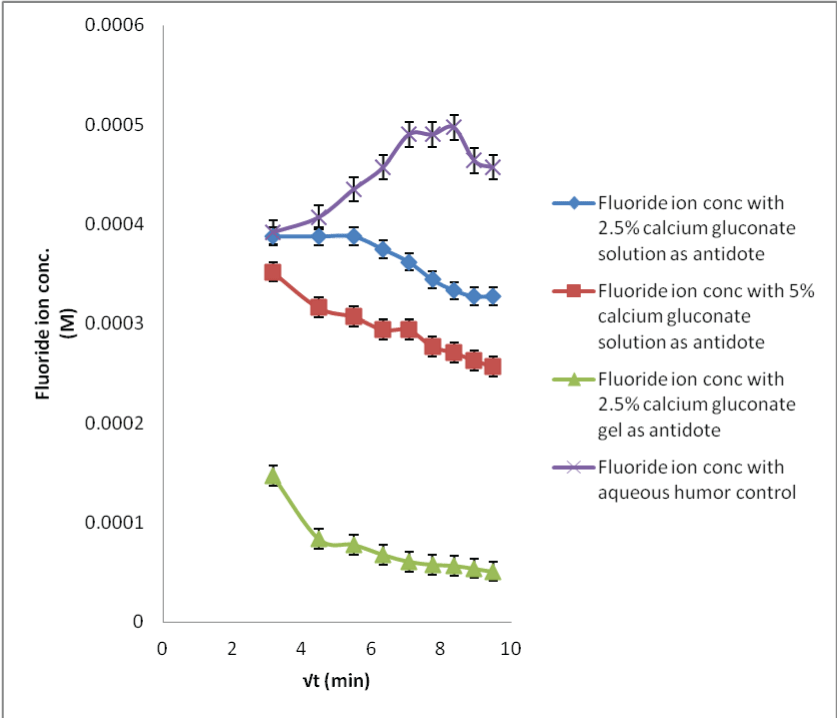
| The in situ probe calibration performed in the preceding section provides the baseline fluoride concentrations required for the calcium gluconate therapy. When the acid burnt eyes were treated with calcium gluconate solution, the fluoride ions formed the calcium fluoride complex with the calcium ions. This results in less available free fluoride ions and thus, decreased flux with low dialysate concentrations (Figures 6-8). Within different calcium gluconate formulations, 2.5% calcium gluconate gel is more effective than solution of the same concentration. Whereas, the 5% calcium gluconate solution has almost similar extent of complexation as compared to 2.5% calcium gluconate gel. It can be inferred that the gel formulation is more effective for the treatment as compared to all the solution formulations. The efficiency of gel formulation is attributed to its extended ocular residence. |
| A comparison study of HF neutralization with the calcium gluconate gel vs. Methocel control formulation was performed to eliminate any contribution from the gel component. Hence, sheep eyes were contaminated with the 29 M HF solution, and flushed with excess of Methocel gel to provide the adequate gel contact. The drawn aqueous humor samples showed that the fluoride penetration followed the similar pattern in the presence of Methocel gel as the fluoride control studies in the absence of any gel (Figure 4). It concluded that the Methocel gel was not involved in neutralizing the fluoride ions. |
| Applying single factor ANOVA, it could be concluded that there was no significant effect of the sample fluoride concentrations on the recovery results for 29 M HF solution neutralization studies with all the three formulations of calcium gluconate (p>0.05, Fcritical). |
| Likewise, there was no significant effect of the sample fluoride concentrations on the recovery results for the 2.5% calcium gluconate gel neutralization studies for all the HF concentrations; while there was a significant effect for the other neutralization studies for 0.1 and 1 M HF concentrations (p<0.05, F>Fcritical). This could be due to less sensitive analytical technique. |
| The neutralization of fluoride with the calcium ions is a time bound process. It was easier to monitor the fluoride level changes for sampling period where the amount of acid exposed was high; resulting in more complexation. Therefore, more time could be required before the fluoride concentration levels could return to the basal levels. The data comparison for the control and neutralization studies show that the MD technique can be used for preventing serious burns and systemic toxicity or mitigating them by observing the time bound penetration kinetics. |
| The degree of changes in aqueous humor fluoride concentration levels were very less obvious when exposed to the low acid concentrations, probably could not be monitored efficiently. |
Conclusions
|
| The technique of microdialysis could be used successfully to ascertain the relative movement of fluoride ions permeating in the HF-burnt eyes. Probes were found to be stable during the course of investigation. In this study, at low concentrations of acid no appreciable differences were found in permeation of fluoride ions as compared to high concentrations. Complete neutralization by calcium ions takes up to, or more than, 1-2 hours with a lag time of about 10-15 minutes so the patient should be observed vigilantly for this period. By increasing the amount of calcium ions available on eye surface, increases the neutralization as shown in the results; the gel preparation is better than the solution of same concentration. The intraocular levels of calcium ion following application of calcium gluconate solution or gel were not correlated to intraocular fluoride ions. It can be concluded that only gel therapy provides necessary counter ion to neutralize the destructive power of fluoride ions peri- and intra- ocularly presumably by offering the necessary “sink” conditions that can draw fluoride from the affected eye and because of reduced clearance from ocular surface. |
Acknowledgements
|
| The research described above was performed by Ms. Navpreet Pandher, a student at St. John’s University, New York. The credit goes to the valuable guidance of Emilio Squillante III and Murali Mohan Bommana. The research and ideas of Tom Needham and Chandra S. Chaurasia, on microdialysis played a significant role in the research work. |
Figures at a glance
|
 |
 |
 |
 |
| Figure 1 |
Figure 2 |
Figure 3 |
Figure 4 |
 |
 |
 |
 |
| Figure 5 |
Figure 6 |
Figure 7 |
Figure 8 |
|
| |


