Keywords
Cognitive demand; Cognitive inhibition; Cognitive metabolism; Indirect calorimetry; Motor response task
Introduction
It is well-established that activities such as exercise and feeding are associated with significant changes in energy expenditure (EE) [1]. However, the effects of mental activities on EE remains incompletely understood. How much extra energy do we use whilst mentally engaged in a task, and how much energy is taken up by the brain during cognition? Is mental activity associated with an additional metabolic cost? If mental activity is shown to be effortful, are all mental processes equal in their demand? Increased cognitive demand is thought to be associated with both increased cerebral vascularity for increased glucose and oxygen supply [2] and increased sympathetic autonomic system activity and muscle tension [3]. Consequently, the energy cost associated with cognition has proven difficult to isolate and explore, and there is little published literature in this field. Thus, our current limited knowledge in this field is largely based on a priori conclusions and mechanistic theories [2,4-6].
Historically, measurements of brain metabolic activity were derived from comparisons of oxygen concentrations between carotid arterial and jugular venous blood [7]. The failure to observe an increase in cerebral oxygen consumption during ‘mental work’ led some to speculate that mental activity does not incur physical energy costs beyond the brain’s baseline metabolism [8,9]. It was also recognised that cognition may require less energy than could be measured at the time. The advent of PET and fMRI enabled visual mapping of changes in cerebral glucose uptake in response to mental activities. Whilst these changes reflect patterns of metabolic activity, they do not quantify the extent of cerebral metabolic change or EE as a whole [10,11]. The introduction of rapid sequencing indirect calorimetry methods [12-14] provides an opportunity to explore further the effects of human cognition on EE.
Published studies on EE and autonomic variables during human cognition have shown conflicting results [15,16]. There is a need for further studies to explore metabolic rate during periods of high cognitive demand, to ascertain whether there is a difference in EE during these times compared with rest, and what factors are involved in modulating this response. The aim of our study was to address this issue by investigating the effect of a simple cognitive-motor task on human EE using metabolic cart analyses. This approach was designed to provide novel insight into the body’s overall adaptation to cognitive demand, beyond the already well-studied metabolic changes within the neural structures directly involved in the task.
Generally, we expected to find higher EE during task performance than during rest periods, if only due to the minute finger movements required for the task. Specifically, however, we were interested in:
The magnitude of this difference-does performing a minimally demanding perceptuo-motor task result in a significant increase in EE? To investigate this issue, we alternated task blocks and rest periods (rather than just measuring resting EE once at the beginning of the experiment);
• The time-course of any EE effects-does EE rise continuously during task performance, decrease continuously during rest, or show any other systematic pattern? We sampled EE with a rate of 8-12 samples per minute, which allowed us to conduct a relatively fine-grained time-course analysis;
• The impact of purely cognitive (non-motor) demands on EE-does increasing the demand on cognitive control without an increase in motor demands result in a measurable change in EE? In order to investigate this, we presented the cognitive-motor task in two versions: in both, the response-relevant target stimulus was preceded by an additional, response-irrelevant prime stimulus. In one, primes were unrelated to the targets, and ‘neutral’ in the sense of not being associated with any response. In the other, primes were from the same stimulus set as targets and thus were associated with the same set of responses. Prime-triggered, automatic motor activation thus could either facilitate the subsequent target response (if both were the same), or interfere with it (if prime and target response differed). In the latter case, prime-triggered activation had to be actively suppressed (inhibited) in order execute the correct response [17,18].
We were interested in inhibitory control in particular because:
• The ability to suppress goal-inappropriate thoughts and actions is crucial for goal-directed behaviour, and is assumed to have a central role in such varied areas as reward, addiction and depression, with links to dementia and Parkinson’s disease, making it a useful target for a cognitive task-based test both in this setting and in pathology [19];
• The neural correlates of inhibitory cognitive control have been studied extensively [20];
• Inhibitory cognitive control is effortful, and thus can be expected to trigger an increase in metabolic activity relative to a non-inhibitory control condition [21].
• Inhibitory cognitive control is effortful, and thus can be expected to trigger an increase in metabolic activity relative to a non-inhibitory control condition [21]. In the standard priming task, as employed in the present study, positive compatibility effects are observed, such that relative to neutral trials, responses are typically faster and more accurate on compatible trials (where prime- and targetrelated response are identical), and slower and less accurate on incompatible trials (where prime- and target-related responses differ) [17,18]. This has been interpreted as indicating that the prime pre-activates its corresponding response. On compatible trials (where prime and target are associated with the same response), the pre-activated response can then be executed. On incompatible trials (where prime and target are associated with different responses), the pre-activated response has to be suppressed in order to execute the correct alternative response.
In the present study, half of the experimental blocks contained only neutral trials (requiring little cognitive control), whereas the other half contained compatible and incompatible trials (requiring high cognitive control). We expected to replicate this standard effect. Furthermore, because relative to neutral trials, responses on incompatible trials are disadvantaged, but responses on compatible trials are facilitated, we expected that overall (averaged) RTs and ERs would be similar in motor priming and in neutral blocks.
The main question of interest, however, was whether these tasks modulated EE, specifically:
• Whether EE increased during task performance and decreased during subsequent rest phases;
• Whether EE showed distinct time-courses over task blocks and rest phases;
• Whether EE during motor priming blocks was higher than during non-motor priming (neutral) blocks.
Method
Participants
Healthy adult volunteers (n=9; 3 male, 6 female, aged 25-52 years) were recruited, and screened for any co-morbidities, including thyroid status. None of the participants were on any regular medication. To mitigate metabolic effects of feeding and exercise on resting metabolic rate (RMR), the study was executed after at least 4 hours of fasting. Participants were instructed to maintain a normal diet the day before and to abstain from eating or drinking for 4 hours prior to metabolic testing. Participants were also encouraged to avoid any exercise or strenuous activity outside their daily routine on the test day. The study had research ethics committee approval from the National Research Ethics Service Committee West Midlands at Solihull. Information was provided and written consent was obtained from each participant, and all elements of study design and participant involvement complied with the Declaration of Helsinki.
Design
Using a localised indirect calorimetry setting via a metabolic cart analysis system, we measured rapid sequential EE during acute phase mental activities such as a brief cognitive task designed to elicit a mental stress response. Our study design enabled clear visualisation of the rapid human metabolic changes that occur between mental work and rest, and exploration of the impact of increased cognitive activity on overall EE in the context of inhibitory cognitive control (ability to maintain behavioural goals in the presence of distracting thoughts or events).
Equipment and set-up
For the duration of each test, participants lay supine on a standard patient bed with head tilt facing a test monitor. Response buttons were assigned to two wired control panels, which were placed on either side of the participant, one for each hand to rest on, allowing actuation of each response button using minimal finger and muscle movement.
The experiment consisted of a series of alternating test and rest phases, with each test phase lasting approximately 2 minutes, followed by a rest phase of approximately 3 minutes, followed by the next test, etc. In total, six test and six rest phases were delivered over a period of approximately 30 minutes. The experiment was monitored from within the same room to record start and end-points of each test and rest period.
EE measurement
Measurements of EE were conducted using the MetaLyzer 3BR2 metabolic cart (Serial no. 65620706, firmware 2.7.22) running MetaSoft Cortex software. This involved wearing a tight-fitting mask connected to a galvanic gas analyser and airpowered open turbine.
This outputs real-time measurements of partial pressure of oxygen and carbon dioxide, as well as airflow of ventilation. Metabolic data were derived indirectly from disparity in oxygen and carbon dioxide concentrations between inhaled and exhaled air to calculate EE from respiration. All inexperiment computations were carried out by the MetaSoft Cortex software after standardised calibration.
This method allowed accurate metabolic derivations to be taken every 5 seconds (equivalent to 4-5 tasked button presses during the mental test). Measurements of EE were recorded in real time, and the data were standardised post-test by converting to units per Kg total body mass. Initial equipment testing and baseline measurements were performed for each participant.
This involved measurement of resting metabolic rate (RMR, also known as resting energy expenditure [RER]), as well as measurements for height and weight. RMR was recorded with the participant lying down and at rest for 20 minutes with no cognitive tasks. Throughout the experiment, participants remained in the same position, with the metalyzer mask in situ, and the test monitor positioned at eye level. EE was measured continuously throughout the experiment (Table 1).
| |
Mean (N=9) |
SD |
| Age (years) |
35.7 |
11 |
| Height (cm) |
166.89 |
12.8 |
| Weight (kg) |
72.04 |
12.6 |
| BMI (kg/m2) |
26 |
3.7 |
| Physical Activity (hrs/week) |
2 |
2.2 |
| Fasting Duration (hrs) |
8.6 |
4.9 |
| Resting Metabolic Rate (RMR) (kcal/d) |
1983.1 |
534.9 |
| Resting Metabolic Rate per kilogram |
27.3 |
4.2 |
| (kcal/d/kg) |
|
|
| V’02 Inspired (l/min) |
0.29 |
0.07 |
| V’C02 Expired (l/min) |
0.23 |
0.08 |
| Respiration Quotient (V’02:V’C02) |
0.78 |
0.11 |
Table 1:Demographics and pre-test baseline parameters of all participants as mean and SD values.
Cognitive task
Stimuli were left- and right-pointing arrows and a plus sign (‘<’, ‘>’, ‘+’), approximately 2 × 2 cm in size, presented in white on a black background at the centre of a 120 Hz TFT computer screen. Each trial began with a 50-ms prime stimulus, followed by a 150-ms blank screen, followed by a 100-ms target stimulus. Inter-trial interval was 1000-ms.
Targets were always arrow stimuli. Participants had to give a speeded button-press response to the direction of the target (right-hand response to a right-pointing, left-hand response to a left-pointing arrow, presented randomly and with equal probability), and to ignore the prime. In motor priming blocks, primes-like targets-were arrow stimuli, pointing randomly and with equal probability in the same (compatible) or the opposite (incompatible) direction as the subsequent target. In non-motor priming (neutral) blocks, the prime was always the plus sign.
Participants completed 3 motor priming and 3 neutral blocks, presented in an alternating order (Figure 1), each lasting approximately 2 minutes and being followed by a 3- minute rest. It was decided that rest phases were to be extended to a 3 minute period to account for any delay between a participant’s change in EE and the detection of the change by the MetaLyzer.
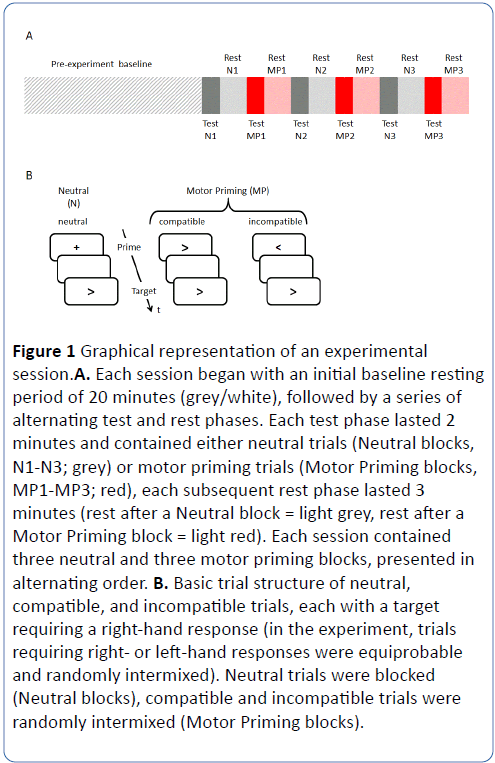
Figure 1: Graphical representation of an experimental session.A. Each session began with an initial baseline resting period of 20 minutes (grey/white), followed by a series of alternating test and rest phases. Each test phase lasted 2 minutes and contained either neutral trials (Neutral blocks, N1-N3; grey) or motor priming trials (Motor Priming blocks, MP1-MP3; red), each subsequent rest phase lasted 3 minutes (rest after a Neutral block = light grey, rest after a Motor Priming block = light red). Each session contained three neutral and three motor priming blocks, presented in alternating order. B. Basic trial structure of neutral, compatible, and incompatible trials, each with a target requiring a right-hand response (in the experiment, trials requiring right- or left-hand responses were equiprobable and randomly intermixed). Neutral trials were blocked (Neutral blocks), compatible and incompatible trials were randomly intermixed (Motor Priming blocks).
Behavioural data
Reaction times (RTs) were measured from target onset, and mean correct-response RTs and error rates (ERs) were calculated separately for each trial type (compatible, incompatible, neutral). RTs and ERs were analysed using repeated measures ANOVAs with the within-subject factor prime (compatible, neutral, incompatible). Furthermore, mean RT and ER on priming and neutral trials were compared using paired t-tests.
Metabolic data
Visual inspection of the RMR data revealed that EE was most stable around 5-10 minutes into the recording (before as well as subsequently, some participants showed extreme EE peaks, exceeding 100 kcal/kg/d). Therefore, the 2-minute segment (in keeping with the experimental conditions, see below) selected as an estimate of baseline RMR was chosen as minutes 5-6 of the pre-experiment period.
EE during the experimental phase was off-line segmented into non-overlapping 30-second time windows. Each test block (3 neutral and 3 motor priming) was divided into four such segments, as were the first two minutes of rest following each test block. From each time window, three values were extracted: mean EE (kcal/kg/day), peak EE, and minimum EE. Next, corresponding values from each of the three repetitions (3 neutral test blocks, 3 follow-neutral rest blocks, 3 priming test blocks, and 3 follow-priming rest blocks) were averaged, resulting, for each participant, in 48 values (2 activities [test, rest] × 2 tasks [neutral, motor priming] × 4 time windows [30,60,90 and 120 seconds] × 3 measurements [mean, peak, min]). Repeated-measures ANOVAS with the within-factors activity, task, and time window were conducted separately for each of the three measurements. Two participants were excluded from these analyses due to incomplete data (pauses of less than 2 minutes duration between action blocks). Statistical analyses were conducted using the SPSS software package.
Results
Analyses of behavioural data
As shown in Figure 2, standard positive compatibility effects were obtained: responses were fastest and most accurate on compatible trials, and slowest and least accurate on incompatible trials, F(2,16) = 26.7, p < .001; MSE = 1181, and F(2,16) = 7.0, p = .029, MSE = 201, for RTs and ERs, respectively. There was no significant difference in speed or accuracy between motor priming and neutral blocks, both ts < 2.2, both ps > .067.
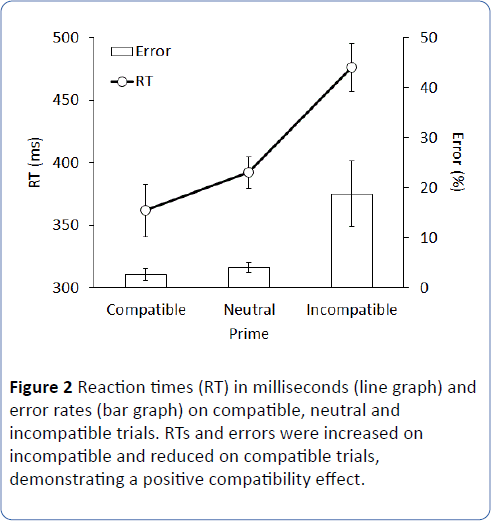
Figure 2: Reaction times (RT) in milliseconds (line graph) and error rates (bar graph) on compatible, neutral and incompatible trials. RTs and errors were increased on incompatible and reduced on compatible trials, demonstrating a positive compatibility effect.
Analyses of EE during cognitive-motor activity
Mean RMR prior to the experimental phase was 25.9 kcal/kg/d (SE = 1.45), with a mean minimum of 17.1(SE=1.72) and a mean maximum of 36.3(SE=2.30).
During the experimental phase, mean EE was generally higher during test (mean EE= 29.1 kcal/kg/d, SE=1.24) than.during rest (mean EE=25.1 kcal/kg/d, SE=1.19), F(3,18)=8.18, p=.029, MSE=456, and decreased over time within each block (from 29.5 on average to 25.8), F(3, 18)=9.40, p=.011, MSE=174. The two factors, activity and time, interacted significantly, F(3,18)=10.1, p=.015, MSE=21 (Figure 3), as EE decreased substantially during each rest period, but remained constantly elevated during test. This was confirmed by followup analyses, conducted for test and rest blocks separately: a significant effect of time was only found for the rest phases, F(3,18)=13.6, p=.007, MSE=30, but not for the test blocks (F< 1). There were no effects of task (priming vs neutral) on mean EE, nor any interaction with this factor (all Fs < 2.2, all ps > .13).
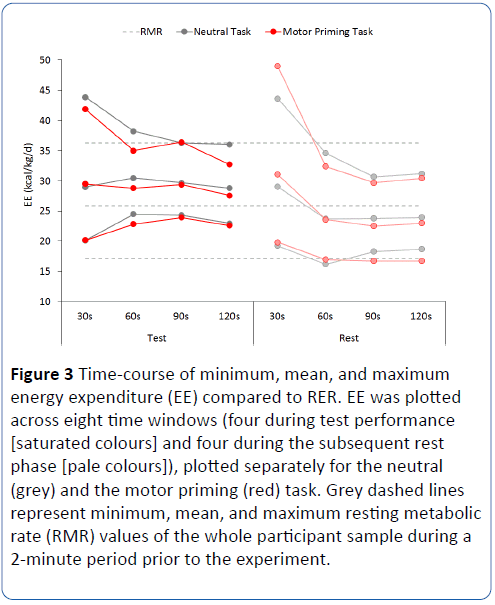
Figure 3: Time-course of minimum, mean, and maximum energy expenditure (EE) compared to RER. EE was plotted across eight time windows (four during test performance [saturated colours] and four during the subsequent rest phase [pale colours]), plotted separately for the neutral (grey) and the motor priming (red) task. Grey dashed lines represent minimum, mean, and maximum resting metabolic rate (RMR) values of the whole participant sample during a 2-minute period prior to the experiment.
The analyses of EE peaks and minima (Figure 3) revealed similar patterns of significant activity x time window interactions (both Fs > 4.11, both p < .022) and an absence of task effects (all Fs < 2.8, all ps > .14). EE peaks and minima differed from the mean EE analyses in that for peak EE amplitudes, time was a significant factor, F[3,18]=20.1, p=.002, MSE=2047), but activity was not (F < 1), whereas for the minima, the reverse was true: time F < 1; activity F(13,6)=16.2, p=007, MSE=662).
EE in the 30s and 90s time window of each experimental condition was compared against RMR using paired t-tests. After Bonferroni correction, the only remaining significant difference was that for both neutral and motor priming tasks, minimum EE during test was higher than minimum RMR, both t(6) > 5.2, both ps < .002 (Figure 3). No other difference reached statistical significance, all ts < 3.0, all ps > .025.
To summarise, our data showed significantly higher EE when participants engaged in a simple cognitive-motor activity than when they rested. This effect was driven mainly by a decrease in mean EE during rest, whereas during test, EE remained relatively stable at a higher level. The type of task (neutral versus motor priming) did not affect overall EE.
EE during transition from test to rest
Visual inspection of the data suggests that type of task (neutral versus motor priming) might affect the transition from test to rest, rather than either of these activities themselves. Note that the initial time window of the rest phases shows higher EE values than the final time window of the immediately preceding test phase (Figure 3). To investigate whether this effect was modulated by the type of task, the ‘rebound’ was calculated as the difference between the two windows (test 30 sec-test 120 sec), separately for neutral and priming tasks. As the duration of the rest phases is irrelevant in this context, all participants (n=9) were included for this analysis. For each of the three measurements (mean, peak, minimum), the rebound values for the two tasks were compared using paired t-tests. A significant effect of task was found for rebound peak values, with the peak rebound following motor priming blocks (15.90) almost twice as large as the rebound following neutral blocks (8.62), t(8)=2.68, p=.028). Mean and minimum rebound values did not differ significantly (both ts< 1 ).
Discussion
The present study demonstrated clearly for the first time, using indirect calorimetry via a face-mask and metabolic cart and real-time metabolic comparisons, a significant effect of simple cognitive-motor control tasks on EE. It was found that:
• EE was significantly greater during task performance (‘test’) than during subsequent rest phases;
• EE showed distinct time-courses over test versus rest blocks, being steadily maintained at a higher level in the former, but displaying an initial spike and subsequent rapid decline in the latter;
• Overall, EE did not differ systematically between motor priming and non-motor priming (neutral) tasks. However, the time-course analysis revealed that such a difference did emerge at the transition from performance to rest in the form of larger EE rebound following the motor priming task than following the neutral task.
We will briefly discuss each of these findings in turn.
Overall EE differences between task performance and rest
Finding greater EE during activity compared to rest is not surprising. When a task is initiated, the participant actively prepares to take the test and is given a countdown of 3 seconds. Fingers align with the test buttons whilst eyes adjust to the screen images. Both of these actions exert their own metabolic effect via direct muscle movement and presumably also via neural activity related to each action. In particular, occipital neural outputs combine with pre-frontal motor cortex and oculomotor outputs to allow for adequate responses to the active task, and of course the finger movements executed during the task-though minute-also require energy. All of these processes contribute towards increased EE during task performance relative to rest.
EE time course
One might have expected EE to increase throughout task performance, as continued motor and cognitive demands accumulate energetic costs. This was not observed. Instead, steady level of EE was maintained throughout the task block. At first glance, this result suggests that at least at these relatively low demand levels (compared to, eg. physical exercise), the body deals efficiently with any demand, so that no costs accumulate. However, results obtained during rest suggest a more complex picture. Rest phases showed a distinct time-course of an initial EE decrease, levelling out near baseline levels after 60-90 seconds. Importantly, initial resting EE was noticeably higher than performance EE during test. A similar rebound phenomenon has been described previously in a study using a visual (non-motor) puzzle solving task [12]. In this study, EE was below baseline during task performance, only to spike during the first 30-90 seconds post-test before gradually declining back to baseline.
The EE rebound might be taken to indicate that maintaining EE levels during task performance is in itself effortful and incurs metabolic costs, which have to be settled once the task has been completed (a situation similar to holding one’s breath while diving, only to suck in deep breaths after breaking the surface). The EE rebound is thus reminiscent of-and might be related to-the phenomenon of excess post-exercise oxygen consumption (EPOC), the increase in oxygen uptake in the recovery period following physical exercise [22]. If this interpretation is correct, then the more effortful it is to maintain EE levels, the larger the rebound should be. This is, in fact, what was observed in the present study.
Task-specific EE modulation
Although EE was similar during performance of motor priming and neutral tasks, peak EE rebound was almost twice as large following the former than following the latter. As outlined above, the priming task is a type of conflict paradigm assumed to require inhibitory cognitive control. On incompatible trials, goal-inappropriate neural activity-such as incorrect motor pre-activation elicited by the prime-has to be inhibited. This is typically associated with increased activation of dopaminergic fronto-striatal networks [20], making motor priming blocks more metabolically ‘taxing’ than neutral blocks . Consequently, maintaining EE levels would have been more effortful during the former than during the latter, causing the accumulation of larger metabolic costs. The larger EE rebound effect following motor priming tasks might reflect the ‘settling’ of these additional costs.
Conclusion
The present study demonstrates the usefulness and sensitivity of the metabolic cart technique (with indirect calorimetry via a face-mask) for the investigation of cognitionrelated EE modulations. Results suggest that in addition to the overt task-related increase in EE, there might be a hidden increase in the form of the rebound effect, and that this effect is modulated by differences in cognitive demand. If this is confirmed in future studies, it could have important implications for the study of cognitive decline in ageing and dementia, which are thought to be associated with impaired regulation of brain metabolism [21].
Acknowledgement
We would like to thank participants who volunteered to take part in this study and James Tresilian for helpful discussions.
11153
References
- Westerterp KR, Plasqui G (2004) Physical activity and human energy expenditure. Current opinion in clinical nutrition and metabolic care 7:607-613.
- Binkofski F, Loebig M, Jauch-Chara K, Bergmann S, Melchert UH, et al. (2011) Brain energy consumption induced by electrical stimulation promotes systemic glucose uptake. Biological psychiatry 70:690-695.
- Pattyn N, Migeotte PF, Neyt X, Den Nest A, Cluydts R (2010) Comparing real-life and laboratory-induced stress reactivity on cardio-respiratory parameters: differentiation of a tonic and a phasic component. Physiology & behavior101:218-223.
- Backs RW, Seljos KA (1994) Metabolic and cardiorespiratory measures of mental effort: the effects of level of difficulty in a working memory task. Int J Psychophysiol16:57-68.
- Chung M, Gobel B (2012) Mathematical modeling of the human energy metabolism based on the Selfish Brain Theory. Advances in experimental medicine and biology 736:425-440.
- Paemeleire K (2002) The cellular basis of neurovascular metabolic coupling. ActaneurologicaBelgica 102:153-157.
- Kety SS (1967) Relationship between energy metabolism of the brain and functional activity. Research publications-Association for Research in Nervous and Mental Disease 45:39-47.
- Gantt H (1994) Do consciousness and mental processes require physical energy? 1978. IntegrPhysiolBehav Sci. 29:77-80.
- Sourkes TL (2006) On the energy cost of mental effort. Journal of the history of the neurosciences15:31-47.
- Cabeza R, Nyberg L (2000) Imaging cognition II: An empirical review of 275 PET and fMRI studies. Journal of cognitive neuroscience12:1-47.
- Huettel SA (2012) Event-related fMRI in cognition. NeuroImage 62:1152-1156.
- Petrek J (2009) Pictorial cognitive task resolution and expired minute ventilation, oxygen consumption, carbon dioxide production and heart rate. Biomed Pap Med FacUnivPalacky Olomouc Czech Repub153:131-136.
- Troubat N, Fargeas-gluck MA, andDugue B (2010) Energy expenditure of a cognitive task: Example of chess. Science and Sports1: 11-16.
- Turner JR, Carroll D (1985) Heart rate and oxygen consumption during mental arithmetic, a video game, and graded exercise: further evidence of metabolically-exaggerated cardiac adjustments? Psychophysiology 22:261-267.
- Rousselle JG, Blascovich J, Kelsey RM (1995) Cardiorespiratory response under combined psychological and exercise stress. Int J Psychophysiol20:49-58.
- Sawai A, Ohshige K, Yamasue K, Hayashi T, Tochikubo O (2007) Influence of mental stress on cardiovascular function as evaluated by changes in energy expenditure. Hypertension research : official journal of the Japanese Society of Hypertension30:1019-1027.
- Chambers CD, Garavan H, Bellgrove MA (2009) Insights into the neural basis of response inhibition from cognitive and clinical neuroscience. Neuroscience and biobehavioral reviews33:631-646.
- Obeso I, Wilkinson L, Casabona E, Bringas ML, Alvarez M, et al. (2011) Deficits in inhibitory control and conflict resolution on cognitive and motor tasks in Parkinson's disease. Experimental brain research212:371-384.
- D'Ostilio K, Garraux G (2012) Dissociation between unconscious motor response facilitation and conflict in medial frontal areas. The European journal of neuroscience 35:332-340.
- Fassbender C, Murphy K, Foxe JJ, Wylie GR, Javitt DC, et al. (2004) A topography of executive functions and their interactions revealed by functional magnetic resonance imaging. Brain research Cognitive brain research. 20:132-143.
- Stranahan AM, Mattson MP (2012) Metabolic reserve as a determinant of cognitive aging. Journal of Alzheimer's disease 2:S5-S13.
- Borsheim E, Bahr R (2003) Effect of exercise intensity, duration and mode on post-exercise oxygen consumption. Sports Med33:1037-1060.