Keywords
Alzheimers disease, Multifractality, MFDFA, Speech, Emotion
Introduction
Emotions are fundamental features of human beings, impacting their perception and everyday activities such as communication and decision making. They are expressed through speech, facial expressions, gestures and other nonverbal clues. Speech emotion recognition is the process of analyzing vocal behavior, with emphasis on nonverbal aspects of speech. Difference of emotional states can be considered as one of the important evaluation criteria to measure the performance of cognition procedure especially for the process of decision making [1] and action tendency [2]. Emotion plays a significant role in influencing motivation and focus of attention. Regarding the model for emotion categorization, multifarious conventional emotions are regarded as explicitly different and mutually exclusive from each other. Cornelius defined the big six emotions as: fear, anger, sadness, happiness, surprise and disgust [3]. Later it was argued that emotion is a continuous process, and speech emotion research has been done using two-dimensional emotion model defined by valence (positivity or negativity of the emotion) and arousal (activity, excitation of the emotion) [4]. The common disapproval of this model is that very differing emotions in terms of semantic, psychological and cognitive meaning may be close in this defined emotional space.
Most of the previous studies on speech emotion recognition have normally used pattern recognition methods using extracted acoustic features (such as pitch, energy and Melfrequency filter banks, Mel-frequency cepstral coefficients (MFCCs) etc.) from audio files. Popular classifiers are the linear discriminate classifier [5] and the k-nearest neighbor (k-NN) [6]. In addition to the linear discriminate classifiers, Support Vector Machine (SVM) also achieves promising classification performance [7]. Non-linear discriminative classifiers such as Artificial Neural Network (ANN) and decision trees are also employed because of their robust performances in certain cases [8,9]. However the same feature vector can even produce totally different classification results using different algorithms [10]. Also, extraction and selection of features play an important role in emotional modeling and in deciding on what emotion should be perceived from a particular speech. Other important factors include speaking/listening mechanism, linguistics etc. Recently, Deep Belief Network models are attempted for emotional classification of audiovisual data [10], by capturing complex non-linear feature interactions in multimodal data (audio and video features).
In view of the above, it can be summarized that most of the speech emotion categorization techniques rely on the frequency-domain stationary methods like Fourier power spectrum. These methods have been strongly questioned for non-stationary aspects of signal. In any signal the spectrum covers wide range of frequencies and the numerous harmonics are left unattended by Fourier spectral analysis, which is mostly based on linear super-positions of trigonometric functions [11,12]. Additional harmonic components, as is common in most natural non-stationary time-series, of which speech signal is one, may produce a deformed wave profile. Those deformations are the well-known consequence of nonlinear contributions. These nonlinear and non-stationary aspects contribute towards minute changes of the intricate dynamics of speech signal, which might be caused by any cognitive impairment restricting proper emotional expression, due to complex diseases like Alzheimer's Disease (AD). Not much has been done in this area by analyzing the nonstationary aspects of the speech signal. In this paper, rigorous non-stationary methodology capable of categorization of speech signals of various emotions is proposed. Multifractal Detrended Fluctuation Analysis (MFDFA) method is used to analyze the internal dynamics of the acoustics of digitized audio signal, with a strong focus for possible application of a non-invasive tool for early detection of AD. We have already applied the visibility graph as the latest, rigorous technique that can assess the degree of multifractality accurately and reliably, for quantitative assessment of brain dysfunction [13]. Also we have worked towards quantitative assessment of Heart Rate Dynamics during meditation by studying ECG-signal with multifractal analysis and visibility graph method [14]. Few of our other works on human brain dysfunction using multifractal analysis are in [15-19].
The most common type of dementia among elderly people in Western countries is the Alzheimer's Disease (AD) and its impact in terms of socio-economic aspects is increasing rapidly day by day. Its symptoms include irreversible and progressive cognitive deterioration along with memory loss, impaired judgment and speech, and other cognitive deficiencies. At the later stages the patient becomes incapable of performing professional, simple social or family activities of daily life. At the early stages of AD the patient suffers from intermittent memory deterioration leading towards lack of cognitive and perceptual ability in speech, language, construction of sentences etc. Since during early stages there are mild memory disorders, patients and also their relatives are not able to relate the symptoms with AD, rather they tend to relate the cognitive changes with age. Normally 2 to 3 years are taken to take medical advice after the onset of the symptoms [20]. Also physicians are unable to confirm the diagnosis of AD as they cannot get the whole picture of memory disorder, hence they prescribe for costly neuropsychological tests. Recently clinical biomarkers are found to have some results in early detection but they are costly in terms of infrastructure and technology requirement.
In this context there is urgent need for non-invasive, intelligent diagnosis technique for early detection of AD, which is also less costly in terms of financial and technological cost. As speech is the most spontaneous, natural and intuitive mode of communication, defining one's intelligence, perceptive and cognitive ability, hence Automatic Spontaneous Speech Analysis (ASSA) can be potentially non-invasive methods of early AD detection. Another such method is Emotional Response Analysis (ERA) on speech of the potential AD patients. As emotions are cognitive processes related to decision making, memory or attention, learning and understanding, this technique also has potential [21,22].
Both ASSA and ERA are based on acoustic and stationary features like pitch, intensity, spectral centroid, short term energy etc., of speech audio signal. Recently these techniques are applied by implementing Multi-Layer Perceptron neural network classifier, where Higuchi Fractal Dimension is included in the feature set, along with the acoustics and stationary feature [23]. But Fractal Dimension refers to the overall properties of a signal and in this system stationary properties are used in conjunction with Fractal dimension, which cannot yield most reliable and accurate measurement of the internal dynamics of speech signal. Since different part of the nonstationary signal is scaled differently, only multifractal analysis can measure its internal dynamics more accurately.
As mentioned earlier that instead of the conventional stationary techniques for audio signal analysis, we have used method of complexity analysis without converting the nonstationary audio signal in frequency domain. We have selected our test samples for six basic emotions from Toronto Emotional Speech Set collection [24], where same words are spoken and recorded with all the six emotions. Then the speech samples are categorized and base-lined emotion-wise. Hence we term each of these samples as emotional speech sample and treat each of them as frame of reference of corresponding nascent emotion. We have used basic - waveforms of the audio signals after de-noising them. Then we have done multifractal analysis of the samples and proposed the roadmap of a unique control system based on the emotions elicited by normal subjects and subjects diagnosed with Alzheimer’s disease. This control system is modeled for early detection of the disease.
This paper is organized as follows: Section 2 describes the fractal and multifractal details with respect to speech analysis, Section 3 describes the data and Section 4 contains the detailed process of analysis. In Section 5 the inferences and the proposed model for early detection of AD, are discussed. Finally, the paper ends with a conclusion in Section 6.
Fractal and Multifractal Analysis and Speech
As per Mandelbrot [25], fractal is a geometric pattern which is iterated at smaller or larger scales to produce self-similar, irregular shapes or surfaces that Euclidian geometry cannot represent. Fractal systems are infinite, i.e., they can extend to insurmountable large values of their coordinates, outwards in all direction from the center. Another important feature of fractals is its self-similarity, i.e., smaller and bigger fragments of a system look very similar, but not necessarily identical, to the entire fractal system. To express self-similarity of the large and small, a distinctive power-law (a mathematical pattern in which the frequency of an occurrence of a given size is inversely proportionate to some power-(n) of its size.), is applied. This n is defined as the scaling exponent or the fractal dimension of the system. Fractals can be of two types: monofractals and multifractals. Monofractals are those whose scaling properties are the same in different regions of the system. Multifractals are more complicated self-similar objects that consist of differently weighted fractals with different noninteger dimensions. Hence their scaling properties are different in different regions of the systems [26].
Detrended Fluctuation Analysis (DFA) is a scaling analysis method where the scaling exponent (similar to a single scale Hurst exponent or the Fractal dimension) is used to quantify the long-range correlation of stationary and non-stationary signal [27]. Hurst exponent or the Fractal dimension of the non-stationary signal refers to the overall properties of the signal. Recent research with complex systems shows that naturally evolving geometries and phenomena cannot be characterized by a single scaling ratio (as in monofractal system), as different parts of the system are scaled differently. Such system is better characterized as multifractal system [28,29]. Multifractal Detrended Fluctuation Analysis (MFDFA) method has been first applied successfully to study multifractal scaling behavior of various non-stationary scale invariant time series by Kantelhardt [30]. MFDFA method is a robust tool to perform scaling analysis in case of nonlinear, non-stationary time series. Results obtained by this method turn out to be more reliable in comparison to methods like Wavelet Analysis, Discrete Wavelet Transform, Wavelet Transform Modulus Maxima, Detrending Moving Average, Band Moving Average, Modified Detrended Fluctuation Analysis etc [30-33]. It has been applied for analyzing various phenomena such as heart rate dynamics, DNA sequences, neuron spiking, human gait, and economic time series, also to weather related and earthquake signals.
The process of speech production shows fractal characteristics. The pulmonary pressure provided by the lungs produces speech [34]. It generates phonation in the glottis that is then modified by the vowel tract into different vowels and consonants. The quasi-static oscillations of the vocal folds and the adjustment provided by the vocal tract are both non-linear processes, mainly when the consonants occur; turbulence is initiated in the tapering parts of the vocal tract. As a result, the speech signal waveform shows both periodicity and selfsimilarity according to the vowels and consonants which form the syllables together. Basic fractal analysis has been done for speech signal in [35]. Multifractal nature of speech has been analyzed for representation and characterization of few works like in [36]. In recent times we have done mutifractal analysis of speech and other signals of North Indian Classical Music signals by analysing their non-stationary, nonlinear aspects [37].
In this work, the width of the multifractal spectrum is calculated for the speech samples corresponding to the various emotions and based on this parameter; speech of each emotion is categorized. We are in the process of collecting similar kind of dataset for AD patient and eventually we would implement and extend the current system for early detection of AD based on the width of the multifractal spectrum of their speech.
Data
The data consists of the voice recordings in the Toronto Emotional Speech Set (TESS) collection created by authors Kate Dupuis, M. Kathleen Pechora-Fuller at the University of Toronto Psychology Department [24]. We have obtained it from the website: https://tspace.library.utoronto.ca/handle/ 1807/24487
There are 1200 voice samples of 64 year old subject. In this database a set of 200 target words are spoken in English in the carrier phrase 'Say the word ----' by two actresses (subjects). Each word is spoken in six ways along with the carrier phrase, eliciting all of the six emotions (anger, disgust, happiness, fear, neutral and sadness). Audiometry tests indicated that subjects have thresholds within the normal range. Moreover, the speech set has been recorded recently- 21-Jun-2010, and hence add more authenticity to the experiment. We have considered the data for old subjects because ours is directed towards early detection of AD which is the most common type of dementia for older people especially in western countries, and also the data for young people eliciting emotion through their speech differently than older people.
The samples are in .wav format. Sampling frequency for the data is 24414 Hz. Samples are of type mono. The amplitude waveform is taken for the testing. We have used empirical mode decomposition method as per Huang [38] for noise removal from the original signal. Each .wav file is converted to text file.
Method of Analysis
The Hurst exponent and the width of the multifractal spectrum is calculated for the 1200 clips (200 each for each of the 6 emotions). These values are calculated as per the method prescribed by Kantelhardt [30]. Step-by step process is described in Section 1). Software implementation is done in Matlab. For each of the input files the Hurst exponent hik and width of the multifractal spectrum wik-s are calculated corresponding to each emotion, where i = 1,2,…200 and k = 1(angry), 2(disgust), 3(fear), 4(happy), 5(neutral), 6(sad).
Once all the hik-s and wik-s are calculated for each of the 6 emotions, histogram analysis is done as described in Section 2) and inferences are drawn. Then model for the proposed system for early detection of AD is elaborated in Section 5.
Step I: Calculation of the width of the multifractal spectrum
Step 1: Suppose for each sample, signal: x(i) for i=1,2, …N, is the waveform of N time instants. The mean of this time series is calculated as 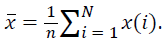 Then the integrated series is computed as per Eq.1 of Kantelhardt [30],
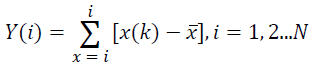
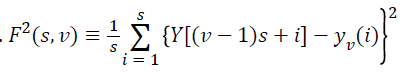
Step 2: The integrated time series is divided into Ns nonoverlapping bins (where 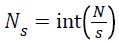 and s is the length of the bin) and the fluctuation function is computed. In our experiment varies from 16 as minimum to 1024 as maximum value in log-scale. For each the local RMS variation is calculated as function F(s,v) as per Equation 2 of Kantelhardt [30].
Where i = 1,2 …s and v=1,2 …Ns
Here yv (i) is the least square fitted polynomial of the bin v.yv (i) is defined as 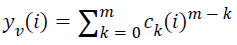 where ck is the kth co-efficient of the fit polynomial with degree m. Here we have taken m as 1.
Step 3: The qth - order overall RMS variation for each scale s, is denoted by Fq(s) which is calculated as per Eq.4 of Kantelhardt [30] as shown below.
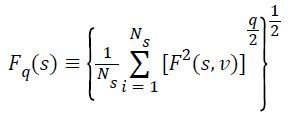
For our experiment we have calculated qth order RMS variation Fq (s) for 100 values of q in between (-5) to (+5).
Step 4: The steps 2-3 is repeated and Fq (s) is calculated for various values of s. If the time series is long range co-related, the Fq (s) versus for each q, will show power-law behavior as below.
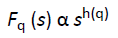
When one quantity varies as power of another, then the quantities are said to be showing power-law behavior. If such a scaling exists log2 (Fq(s)) will depend linearly on log2 (s), where h(q) is the slope. The exponent h(q) depends on q . Here h(q) is the generalized Hurst exponent. This h(q) of MFDFA is related to the scaling exponent τ(q) as per Eq.13 of Kantelhardt [30] as shown below.
Step 5: Multifractal signals have multiple Hurst exponents, hence τ(q) depends nonlinearly on q If α is singularity strength, the singularity spectrum is ƒ(α). ƒ(α) is related to h(q) as per Eq. 15 of Kantelhardt [30].
α = h(q)+qh’ (q) and ƒ(α) = q[α-h(q)]+1
The resulting multifractal spectrum ƒ(α) is an arc where the difference between the maximum and minimum value of is called the multifractal spectrum width. The width of the spectrum gives a measure of the multifractality of the time series.
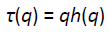
In our experiment, first the width of the multifractal spectrum wik is calculated for each input. Then for each input, the signal is shuffled and the width of the multifractal spectrum for that shuffled signal, is calculated. If there are long range correlations in the original data, those would be removed by this shuffling and the sequence will become uncorrelated. Hence the width of the multifractal spectrum for the shuffled signal will be much less and different from the width of the multifractal spectrum for the original signal. This has been true for all the test samples used in our experiment. Figure 1 shows the multifractal spectrum for one such original sample and its shuffled version.
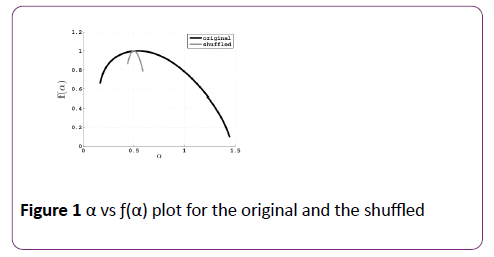
Figure 1: α vs ƒ(α) plot for the original and the shuffled
Step II: Analysis and inferences of hik and wik values
The Hurst exponents, hik and the width of the multifractal spectrum wik-s for i = 1,2 …200 and k = 1,2 …6 are calculated as per the method in Section 1), for all the input files. Then plots and trends as shown in Figures 2 and 3 are formed.
Frequency histogram of hiks: The histogram of frequency of occurrence for a particular hik for each emotion is formed. In this histogram the ranges of hik-s are divided among a number of bins. The peak of the histogram is denoted by hpk, which is considered here as the Hurst exponent for each emotion, where k=1,2 …6
Trend of hpks: Once the peaks of the histograms are calculated emotion-wise, the trends are plotted. Figure 2 shows the trend hpk for k=1,2, ….6.
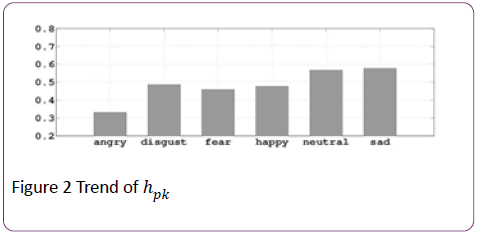
Figure 2: Trend of hpk
Frequency histogram of wiks: The histogram of frequency of occurrence for a particular wik for each emotion is formed. In this histogram the ranges of wik are divided among a number of bins. The peak of the histogram is denoted by wpk which is considered here as the width of the multifractal spectrum for each emotion, where k=1,2,…6.
Trend of wpk-s: Once the peaks of the histograms are calculated emotion-wise, the trends are plotted. Figure 3 shows the trend of wpk for k=1,2…6.
Figure 3: Trend of wpk
Discussions
Inference from test results:
If we analyse the trends of the values hpk for each emotion we can see that the Hurst exponent for sad emotion is higher than that of angry emotion by 73.8%.
Whereas it's evident from the trends that the value of widths of the multifractal spectrum - wpk for angry emotion is higher than that of sad emotion by around 25%.
Note: Values of wpk-s are normalized within a range of [0; 1].
From the above findings we can conclude that the resolution between the values of Hurst exponents and multifractal spectrum widths for both angry and sad emotions, is highest hence while modelling the proposed system for early detection of AD, these emotions would be considered.
Moreover, since the emotions vary from subject to subject, we would be deducing a range of values (defined in Section 5) for the widths of the multifractal spectrum for speech with both angry and sad emotions respectively and not the exact values, for the proposed model.
We propose to extend this work and validate the inferences using a larger database for normal subjects and baseline the range of values for the widths of the multifractal spectrum for both angry and sad speech. This range would be the first set of control element calculated for the normal subjects, denoted by, 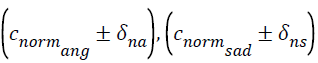 for angry and sad emotions respectively. The age and other parameters of the subjects should be similar to those included in TESS database [24]. Similarly same process is followed for base-lining range of values for subjects diagnosed with AD and for same angry, sad speech. For this analysis same set of words [24]. With angry and sad emotion, would be spoken by subjects diagnosed with AD, as per the method for constructing TESS database [24]. These ranges would be the second set of control elements and should be denoted, by
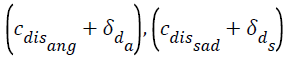 for angry and sad emotion respectively.
Note: δ-s are standard variances.
A methodology is proposed as represented in Figure 4 for assessing the proneness of having AD, for the subject to be diagnosed. Any word W ∈ (the set of words) would be spoken angrily and sadly by the subject and the digitized audio waveform is captured for both the samples.
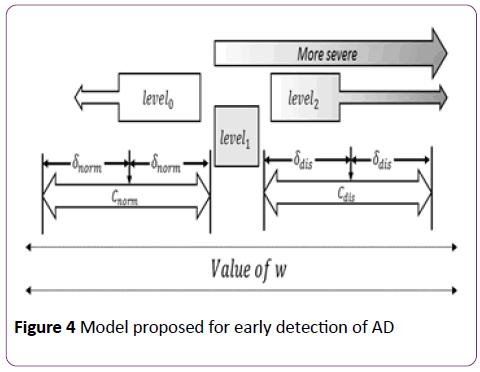
Figure 4: Model proposed for early detection of AD
Then the width of the multifractal spectrum is calculated for the two samples and denoted wa and ws for angry and sad emotions respectively.
Then we calculate a weightage  i.e., the proneness to AD for the subject, based on wa or ws for angry and sad emotions, as per below.
If wa falls within the range 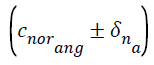 then
then 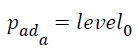
Else, if wa falls outside then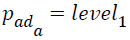
Else, if wa falls between 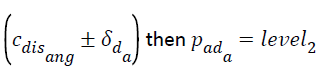
Similarly we calculate pads repeating steps 1 to 3 for ws with control parameters for sadness i.e., 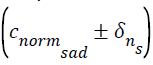 and
and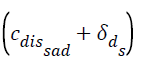
Finally we assign pad with the value of 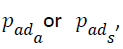 whichever is higher.
Once we obtain the value of pad the assessment of proneness to AD for a subject can be summarized as below
pad = level0: not prone to AD
pad = level1: onset of AD
pad = level2: prognosis of AD
With more validations we can also decide on the severity apart from the levels mentioned.We can devise a simple, lightweight application for routine checkup, where the control elements would be saved locally and pad would be calculated real-time. As this would be a routine check-up model, this process would be a continuous one, setting an alarm parameter for any deviation of pad from its normal range and we may predict the onset of AD at an early stage.
We would like to emphasize that the individual variations to the test samples for six basic emotions from Toronto Emotional Speech Set (TESS) collection [24], have been taken care of during our analysis. Moving further one can take suitable steps to take care the differences in pronunciation of British and American English and even local dialects with different control elements established for them. We propose to extend our methodology to create models for different languages including local dialects.
This technique can also be extended for diagnosis and prognosis of other cognitive diseases, various types of mental depressions and even for the assessment of suicidal tendency of the severely depressed patients.
Conclusion
From the trend of values of the Hurst exponent, and widths of the multifractal spectrum, we can confirm that we can clearly distinguish between fundamental emotions like anger and sadness, by multifractal analysis. Unlike other neurocognitive impairments Alzheimer's Disease (AD) cannot be detected at the early stage, due to the mildness of its early symptoms. Normally 2 to 3 years are taken to take medical advice after the onset of the symptoms [20]. Moreover its major symptoms include lack of cognitive and perceptual ability as speech. In this work we propose one quantitative parameter (widths of the multifractal spectrum) to capture the change in intricate dynamics of speech spoken by normal subject, out of different emotion. Hence any aberration from the normal trend of widths of the multifractal spectrum for different emotion can be contributed towards onset of neurocognitive impairments like Alzheimer's disease (AD). So we can term this method as a non-invasive method for early detection of AD. Eventually we propose to validate the inferences using a larger database and devise a simple 'android' application for routine checkup for elderly people for self-assessment as well as monitoring, in regard to detection of AD.
Acknowledgement
We thank the Department of Higher Education, Govt. of West Bengal, India for logistics support of computational analysis.
Disclosure
The authors have reported no conflicts of interest.
9120
References
- Fridja NH (1987) Emotions, cognitive structure and action tendency. Cognition and Emotion. 1: 115-143.
- Damasio AR (1994) Descartes' Error: Emotion, Reason, and the Human Brain, USA, Harper Perennial.
- Cornelius RR (1996) The science of emotion: research and tradition in the psychology of emotions, London: Prentice-Hall.
- Russell JA (1979) Affective space is bipolar, Journal of Personality and Social Psychology, 37: 345-356.
- Roy D, Pentland A (1996) Automatic spoken affect analysis and classification. Proc. of 2nd Int. Conf. Automatic Face Gesture Recognition, Killington, VT: 363-367.
- Averill J (1994) In the eyes of the beholder. In: The nature of emotion: Fundamental Questions. pp.7-14.
- You M, Chen C, Bu J, Liu J, Tao J (2006) Emotion recognition from noisy speech. Proc. of Multimedia and Expo, IEEE International Conference, Toronto Ont pp. 1653-1656.
- Martinez CA, Cruz A (2005) Emotion recognition in non-structured utterances for human-robot interaction. Proc. of IEEE International Workshop on Robot and Human Interactive Communication., Rome Italy pp. 19-23.
- Schuller B, Seppi ABD (2007) The relevance of feature type for the automatic classification of emotional user states: low level descriptors and functionals. Proc. of INTERSPEECH 2007, 8th Annual Conference of the International Speech Communication Association, Antwerp, Belgium. pp. 2253-2256.
- Kim Y, Lee H, Provost E M (2013) Deep learning for robust feature generation in audiovisual emotion recognition. Proc. of IEEE International Conference on Acoustics Speech and Signal Processing (ICASSP), VancouverBC pp. 3687 - 3691.
- Sarkar A, Barat P (2008) Effect of meditation on scaling behavior and complexity of human heart rate variability. Fractals 16: 199.
- Conte E, Khrennikov A, Federici A, Zbilut J P (2009) Fractal fluctuations and quantum-like chaos in the brain by analysis of variability of brain waves: a new method based on a fractal variance function and random matrix theory. Chaos, Solitons and Fractals 41: 2790-2800.
- BhaduriS, Ghosh D (2015) Electroencephalographic data analysis with visibility graph technique for quantitative assessment of brain dysfunction. Clinical EEG Neuroscience 46: 218-223.
- Bhaduri A, Ghosh D (2016) Quantitative assessment of heart rate dynamics during meditation: An ECG based study with multi-fractality and visibility graph.
- DuttaS, Ghosh D, Shukla S,DeyS (2014) Multifractal parameters as an indication of different physiological and pathological states of the human brain. Physica A: Statistical Mechanics and its Applications. 396:155-163.
- Ghosh D, Dutta S, Chakraborty S (2014) Multifractaldetrended cross-correlation analysis for epileptic patient in seizure and seizure free status. Chaos, Solitons & Fractals 67: 1-10.
- Dutta S, Ghosh D, Chatterjee S (2013) Multifractaldetrended fluctuation analysis of human gait diseases. Frontiers in Physiology.
- Maity AK, Pratihar R, Mitra A, Dey S, DipakGhosh, et al. (2015) Multifractaldetrended fluctuation analysis of alpha and theta EEG rhythms with musical stimuli. Chaos, Solitons and Fractals 81: 52-67.
- Dutta S (2010) Multifractal properties of ECG patterns of patients suffering from congestive heart failure. Journal of Statistical Mechanics: Theory and Experiment 2010: 12021.
- McKhann G, Drachman D, Folstein M, Katzman R, Price D, et al. (1984) Clinical diagnosis of Alzheimer's disease: Report of the National Institute on Aging Alzheimer's Association workgroup on Alzheimer's disease. Neurology 34: 939-944.
- Knapp ML (1980), Essentials of nonverbal communication. Harcourt School, New York, USA.
- Cowie R, Douglas-Cowie E, Tsapatsoulis N, Votsis G, Kollias S, et al. (2001) Emotion recognition in human-computer interaction. IEEE Signal Processing Magazine 18: 32-80.
- de-Ipina L, Alonso K,Travieso JB, Sole-Casals CM (2013) On the selection of non-invasive methods based on speech analysis oriented to automatic alzheimer disease diagnosis. Sensors 13: 6730-6745.
- Toronto Emotional Speech Set (TESS) Collection (2015) https://www.alz.org/research/funding/global_biomarker_consortium.asp.
- Chen Z, Ivanov PC, Hu K, Stanley HE (2002) Effect of non-stationarities on detrended fluctuation analysis. Physical Review E, 65: 041107.
- Hausdorff JM, Purdon PL, Peng CK, Ladin Z, Wei JW, et al. (1996) Fractal dynamics of human gait: stability of long-range correlations in stride interval fluctuations. Journal of Applied Physiology 80: 1448-1457.
- Buldyrev SV, Goldberger AL, Havlin S, Peng CK, Stanley HE (1993) Fractal landscapes and molecular evolution: analysis of myosin heavy chain genes MHR Biophys J 65: 2673-2679.
- Kantelhardt JW, Koscielny-Bunde E, Rego HHA, Havlin S, Bunde A (2001) Detecting long-range correlations with detrended fluctuation analysis. Physica A: Statistical Mechanics and its Applications 295: 441-454.
- Kantelhardt JW, Zschiegner SA, Koscielny-Bunde E, Bunde A, Havlin S, et al. (2002) Multifractaldetrended fluctuation analysis of nonstationary time series Physica A: Statistical Mechanics and its Applications 316: 87-114.
- Serranoa E, Figliola A (2009) Wavelet Leaders: A new method to estimate the multifractal singularity spectra. Physica A: Statistical Mechanics and its Application 388: 2793-2805.
- Oswiecimka P, Kwapien J, Drozdz S (2006) Wavelet versus detrended fluctuation analysis of multifractal structures. Physical Review E 74: 16103.
- Huang YX, Schmitt FG, Hermand JP, Gagne Y (2011) Arbitrary-order Hilbert spectral analysis for time series possessing scaling statistics: a comparison study with detrended fluctuation analysis and wavelet leaders. Physical Review E 84: 16208-16213.
- Levelt WJM (1999) Models of word production. Trends in Cognitive Sciences 3: 223-232.
- Maragos P, Potamianos A (1999) Fractal dimensions of speech sounds: Computation and application to automatic speech recognition. The Journal of the Acoustical Society of America 105: 223-232.
- Gonzalez DC, Lee LL, Violario F (2011) Analysis of the multifractal nature of speech signals. Proc. of 17th Iberoamerican Congress, Buenos Aires, Argentina: 740-748.
- Bhaduri S, Ghosh D (2016) Speech music and multfractality. Current Science.
- Huang NE, Zheng S, Steven R, Manli C, Hsing H (1998) The empirical mode decomposition and the Hilbert spectrum for nonlinear and non-stationary time series analysis. Proc. of the Royal Society of London, London, UK.