Keywords
Oat peptides; Diabetic; Hypoglycemic activities; Insulin
Introduction
Type 2 diabetes mellitus (T2DM) affects 5-7% of the total world population [1,2]. Cardiovascular disease, T2DM, and other obesity related chronic diseases are major causes of morbidity and mortality. High fasting blood glucose (FBG) and insulin resistance typically precede T2DM. Dietary components such as polyunsaturated fats, viscous fibers, and polyphenolic compounds have been reported to reduce risk factors associated with T2DM.
Dietary protein is not only the source of essential amino acids required for growth or maintenance but also contains amino acid sequences for bioactive peptides that have antimicrobial, blood pressure-lowering (ACE inhibitory), anti-oxidative, cholesterollowering, and hypoglycemic properties [3,4]. The effects of different dietary protein and intake amount on hypoglycemic activities have received considerable attention. Gannon et al. showed that feeding T2DM patients with 50 g glucose in addition to 25 g various proteins led to increases in insulin secretion according to the protein type with the largest increases obtained with cottage cheese and least with egg protein [5]. Whey protein was demonstrated to have insulinotropic effects and reduced postprandial glycemia by stimulating the glucagon like peptide-1 (GLP-1) and glucose-dependent insulinotropic peptide (GIP) in C57BL/6J mice [6]. Power et al. also found that whey protein hydrolysates have a 45% greater insulintropic effect compared with the intact whey protein [7]. The protein from Thai bitter gourd (Momordica charantia) fruit pulp could decrease plasma glucose concentrations in both normal and streptozotocin (STZ)- induced diabetic rats in a dose-dependent manner [8]. One novel peptide (KLPGF) from albumin may have the anti-diabetic activity against amylase with an IC50 of 59.5 μmol L-1 and α-glucosidase with an IC50 of 120 μmol L-1 [4] and the peptide RVPSLM from egg white protein was also discovered as a potential α-glucosidase inhibitor with an IC50 of 23.1 mol L-1 [9].
Oat, as a “third staple food” following rice and wheat in China, has been widely utilized due to the need for high soluble fiber in consumer’s daily diet. Oat also contains 15-20% protein, which consists of balanced amino acid profile devoid of antinutritional factors [10,11] and has a chemical score of 72-74 [12]. Many studies have focused on the hypoglycemic activities of oat β-glucan [13-15]. However, the hypoglycemic activities of oat peptides have not been reported to our knowledge.
The aim of this study was to investigate the hypoglycemic activity of oat hydrolysates prepared by proteolysis by alcalase 2.4 L-1 on blood glucose concentration and insulin response in STZ-induced diabetic mice. STZ, a glucosamine–nitrosourea compound derived from Streptomyces achromogenes, specifically targets pancreatic β cells resulting in hypoinsulinemia and hyperglycemia and has been widely used to generate diabetic animal models [8,16-18].
Materials and Methods
Preparation of oat peptides with the α-glycosidase inhibitory activity
Naked oat (Bailang No.2) was provided by Baicheng Institute of Agricultural Products (Jilin, China) and ground in a hammer mill to pass through a 80-mesh screen. The powder was defatted by suspending 50 g in 100 mL n-hexane, stirring at 300 rpm for 8 h, decanting the hexane, and drying the residue at ambient temperature. A 5% (w/w) suspension of the defatted oat meal was hydrolyzed by 4% Alcalase 2.4 L-1 (Novozyme Inc. Copenhagen, Denmark) at 55°C, pH 7.5 for 4 h with agitation by a SHZ-82A thermostatic oscillator (Guohua Electric Appliance Co., Ltd., Changzhou, China) at 200 w. After proteolysis, the suspension was cooled to the ambient temperature and the supernatant containing the protein hydrolysates separated from the insoluble residue by centrifugation at 8,000 × g for 30 min.
Peptides were separated from high molecular substances by ultrafiltration using a MSC300 ultrafiltration machine (Shanghai Mosu Science and Material Co., Ltd., Shanghai, China) according to the method of Hamada with slight modifications [19]. The crude hydrolysates were ultrafiltered through a Omega membrane with a molecular weight cut-off of 5,000 Da at 0.2 MPa, 20°C, and pH 7.0. Preliminary studies had shown that the fraction below 5 kDa had 18% higher α-glucosidase inhibitory activity than the fraction greater than 5 kDa. The fraction less than 5 kDa was collected, lyophilized, and stored at -20°C for the further study. The purity (65%) was determined by the Kjeldahl method using a conversion factor of 5.83 [20].
Experimental animals
Male ICR (Institute of Cancer Research) mice were obtained from SPF Animals Experiment Technology Co., Ltd. (Certification of Experimental Animal: No. SCXK (Jing) 2011-0004) (Beijing, China). Mice were housed at 20 ± 2°C with a 12 h alternating light-dark cycle. Food and water were available ad libitum. The experimental procedures were carried in conformity with international guidelines for care and use of laboratory animals. After the 3-day acclimation, ten mice were randomly allocated as the normal control (NC) group and intraperitoneally injected with 0.1 mol L-1, pH 4.5 sodium citrate buffer solution at a dose of 150 mg/kg body weight after a 12 h fast. The remaining mice were intraperitoneally injected with 0.1 mol L-1, STZ in pH 4.5 sodium citrate buffer solution (Sigma Chemicals, St. Louis, MO, USA) at a dose of 150 mg/kg body weight after a 12 h fast. After 2 weeks, mice with a fasting blood glucose (FBG) value higher than 11 mmol L-1 were considered diabetic and selected for the further pharmacological studies.
The diabetic mice were randomly divided into five groups of 10 mice. The groups included: a model control (MC), positive control (PC), low oat peptide (OPL), medium oat peptide (OPM), and high oat peptide (OPH). The MC group was fed a standard chow diet including wheat bran, corn, wheat flour, vegetable oil, vitamin, and mineral mix (Beijing Macao Cooperation Feed Co., Ltd., Beijing, China). The PC group, fed the standard chow diet, was orally administered 10 mg/ ml metformin (0.6 g/kg body weight) (Tian'an Pharmaceutical Co., Ltd., Guizhou, China) daily. The OPL, OPM, and OPH groups were orally administered 0.25, 0.5 and 1.0 g/kg body weight in solutions containing 0.15, 0.3 and 0.6 g mL-1 oat peptides solution respectively.
The NC group was fed the standard chow diet and orally administered distilled water (1.0 g/kg body weight) daily. The experiment lasted for 4 weeks and food and water were available ad libitum during the period. Food intake and body weights were recorded weekly.
Blood glucose, insulin, and insulin activity index
During the feeding period, FBG values were determined from the tail vein using a One Touch Ultra blood glucose meter (Johnson & Johnson Medical Ltd., Shanghai, China) weekly for three times. After 4 weeks the mice were feed deprived for 12 h and sacrificed under mild isoflurane anesthesia. The blood samples were taken by orbital venous sinus puncture and separated by centrifuged at 3,000 × g for 15 min at 4°C. For the calculation of insulin activity index (IAI), the FBG values and serum fasting insulin (FINS) in serum were measured using a glucose kit (Leadman Group Co., Ltd., Beijing, China) and an insulin ELISA kit (Beckman Coulter Inc., Miami, FL, USA).
IAI was calculated using the following formula [15]:
FINS and FBG are the concentrations of serum insulin and blood glucose after a 12 h fast.
Hepatic glycogen
Livers were dissected out, washed in ice-cold saline solution to remove blood, frozen in liquid nitrogen, and kept at -80°C. The hepatic glycogen content was determined using a commercially available enzyme assay kit (Nanjing Jiancheng Biocompany, Nanjing, China).
Identification of peptides by Nano-Ultra Performance Liquid Chromatography (UPLC)-MSE Tandem MS
The peptide sequences were indentified according to the method of Shen et al. [21].
After adjusting the pH to 8.5 with 1 M ammonium bicarbonate, oat peptides was chemically reduced for 45 min at 55°C by adding DL-Dithiothreitol (DTT) to 10 mM and carboxyamidomethylated in 55 mM iodoacetamide for 30 min at room temperature in the dark. Then CaCl2 was added to 20 mM, endoprotease Lys-C (Sigma Chemicals, St. Louis, MO, USA) was added to a final substrate/ enzyme ratio of 100:1 (w/w), and the reaction was incubated at 37°C for 12 h. Nano-scale liquid chromatography (LC) separation of peptides digested by Lys-C and trypsin was performed with a nano ACQUITY system (Waters Corporation, Milford, MA, USA) equipped with a symmetry C18, 5 μm, 180 μm x 20 mm precolumn and an ethylene bridged hybrid (BEH) C18, 1.7 μm, 75 μm x 250 mm, analytical reversed-phase column (Waters Corporation, Milford, MA, USA). The column temperature was maintained at 35°C. The mobile phase A was deionized water with 0.1% formic acid and the mobile phase B was 0.1% formic acid in acetonitrile. The peptides were separated with a linear gradient of 0-40% mobile phase B over 80 min at 0.2 μL min-1 followed by 10 min at 80% mobile phase B. The column was re-equilibrated at initial conditions for 20 min.
Analysis of oat peptides was performed using a SYNAPT high definition mass spectrometer (HDMS) (Waters Corporation, Milford, MA, USA). The source temperature was 90 °C. The mass range was from m/z 350 to 1600. The time-of-flight (TOF) analyzer of the mass spectrometer was calibrated with the MS/ MS fragment ions of [Glu1] fibrinopeptide B (Sigma Chemicals, St. Louis, MO, USA) from m/z 50 to 2000. Peak lists were generated using Protein Lynx Global Server version 2.3 (PLGS 2.3) software and automatically combined into a single pkl file for every LCMS/ MS run. Other search parameters were as follows: trypsin digest with one missed cleavage, no fixed modification and carboxyamidomethyl of cysteine and oxidation of methionine as the variable modification. The precursor mass tolerance and fragment ion mass tolerance was set 0.2 Da.
Statistical analysis
Data are expressed as means ± standard deviations of three replicated determinations. Differences among groups were determined by one-way ANOVA analysis of variance using the Minitab 15 statistical program (Minitab Inc., State College, PA, USA) for differences between different biological parameters. Pearson correlation coefficients were calculated for investigating relationships of different biological parameters and determined by the SPSS16.0 statistical program (IBM Inc., New York, NY, USA). Significance was defined at the 95% confidence level.
Results
Changes in body weights and food intake
There were no significant differences in final body weights or weight gain among the different diabetic mice groups after 4 weeks (Table 1). The total food intake was significantly (P < 0.05) lower in the OPH and PC treatment groups compared with the MC group (Table 1). The total food intake was 19.4%, 10.9%, 5.3%, and 21.2% lower in OPH, OPM, OPL, and PC groups, respectively, compared with the MC group. Moreover, the total food intake was significantly (P < 0.05) inversely related to oat peptides’ dose and the OPH treatment group had the similar total food intake as the PC group. Because there were no differences in weight gain, the lower total food intake of the OPH, OPM, and PC groups translated into significantly (P < 0.05) higher food efficiencies. Compared with the MC group, the food efficiencies of OPH, OPM, and PC groups increased 25%, 19%, and 47%, respectively.
| |
0 |
1 Week |
2 Weeks |
3 Weeks |
4 Weeks |
| Body weight (g) |
| NC |
29.40 ± 1.51a |
32.60 ± 1.96a |
34.80 ± 2.35a |
36.30 ± 2.54a |
38.10 ± 2.96a |
| MC |
23.91 ± 1.22b |
25.92 ± 1.88b |
27.17 ± 2.21b |
28.67 ± 2.10b |
28.42 ± 2.64b |
| OPH |
24.17 ± 1.80b |
24.83 ± 1.64b |
26.00 ± 1.95b |
27.33 ± 1.61b |
28.58 ± 1.31b |
| OPM |
22.75 ± 1.60b |
24.45 ± 1.63b |
26.25 ± 1.96b |
27.08 ± 2.02b |
27.42 ± 2.27b |
| OPL |
23.42 ± 1.88b |
25.08 ± 2.11b |
26.17 ± 2.17b |
27.25 ± 2.53b |
27.67 ± 2.53b |
| PC |
23.00 ± 1.41b |
24.67 ± 1.37b |
25.92 ± 1.83b |
26.83 ± 1.59b |
28.08 ± 1.68b |
| Food intake (g) |
| NC |
5.70 ± 0.14c |
5.80 ± 0.28c |
5.70 ± 0.71e |
5.10 ± 0.71d |
22.3 ± 1.1d |
| MC |
7.17 ± 0.47ab |
10.17 ± 0.94a |
10.00 ± 0.00a |
9.25 ± 0.12a |
36.6 ± 1.1a |
| OPH |
5.83 ± 0.24c |
7.75 ± 0.82b |
8.25 ± 0.12c |
7.67 ± 0.24c |
29.5 ± 0.5c |
| OPM |
6.17 ± 0.00c |
9.67 ± 0.94a |
8.25 ± 0.12c |
8.50 ± 0.94b |
32.6 ± 0.08b |
| OPL |
7.58 ± 0.82a |
9.17 ± 0.94a |
8.92 ± 0.35b |
9.00 ± 0.24ab |
34.7 ± 1.1a |
| PC |
6.83 ± 0.24b |
7.17 ± 1.41b |
7.50 ± 0.24d |
7.33 ± 0.24c |
28.8 ± 0.5c |
aData presented as means ± standard deviations.
bDifferent letters in the same column indicate significant differences at P < 0.05.
cNC: normal control group; MC: model control group; OPH: high-dose oat peptides group (1.0 g/kg body weight); OPM: medium-dose oat peptides
group (0.5 g/kg body weight); OPL: low-dose oat peptides group (0.25 g/kg body weight); PC: positive control group (0.6 g/kg body weight).
Table 1: Effects of different doses oat peptides on body weights in streptozotocin (STZ)-induced diabetic mice.
FBG and insulin responses
Prior to the treatment, the FBG concentrations showed no significant differences among all of the diabetic mice. However, the FBG concentrations of the diabetic mice were all significantly higher (P < 0.05) than that of the NC group (Figure 1). After the first week treatment, the FBG concentrations of mice in OPH, OPM, OPL, and PC groups significantly (P < 0.05) decreased 16.5%, 11.1%, 8.6%, and 19.9%, respectively. The FBG concentrations in OPH and PC were 30.2% and 38.9% lower after the 4-week administration. Compared with the MC treatment group, the FBG concentrations in OPH, OPM, and PC groups significantly (P < 0.05) decreased 31.6%, 14.4%, and 39.7%, respectively, at the end of the treatment.
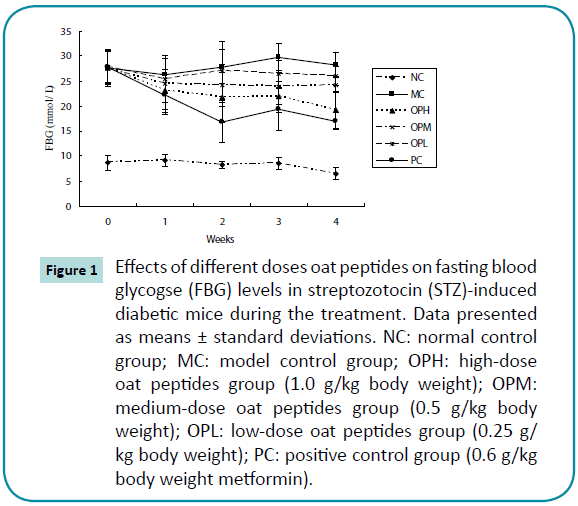
Figure 1: Effects of different doses oat peptides on fasting blood glycogse (FBG) levels in streptozotocin (STZ)-induced diabetic mice during the treatment. Data presented as means ± standard deviations. NC: normal control group; MC: model control group; OPH: high-dose oat peptides group (1.0 g/kg body weight); OPM: medium-dose oat peptides group (0.5 g/kg body weight); OPL: low-dose oat peptides group (0.25 g/kg body weight); PC: positive control group (0.6 g/kg body weight metformin).
Compared with the NC group, all the diabetic mice had significantly (P < 0.05) lower FINS concentrations (Table 2). However, the FINS concentrations in the OPH and PC treatment groups significantly (P < 0.05) increased 13.0% and 30.5% compared with the MC group. Mice in the OPH treatment group had the similar IAI to that of the PC group and the IAI in the OPH and PC treatment groups was 29.1% and 26.8% significantly (P < 0.05) higher than that of the MC group.
| |
NC |
MC |
OPH |
OPM |
OPL |
PC |
| Fins(μIU/L? |
24.50 ± 3.77a |
16.05 ± 2.83c |
18.65 ± 2.81b |
17.45 ± 3.84c |
16.15 ± 3.13c |
21.53 ± 2.55b |
| IAI |
1.88 ± 0.22a |
0.83 ± 0.17c |
1.03 ± 0.021b |
0.87 ± 0.23c |
0.86 ± 0.22c |
1.06 ± 0.15b |
Table 2: Effects of different doses oat peptides on fasting insulin (Fins) and insulin activity index (IAI) in streptozotocin (STZ)-induced diabetic mice.
Hepatic glycogen content
Hepatic glycogen contents of all diabetic mice, except for the PC group, were significantly (P < 0.05) lower than that of the NC group (Figure 2). However, the OPH, OPM, OPL, and PC groups had significantly (P < 0.05) higher (16.8-82.4%) hepatic glycogen content compared with the MC group. Moreover, the increasing hepatic glycogen contents were observed in a dosedependent manner in the OP treatment groups (R2=0.9504).
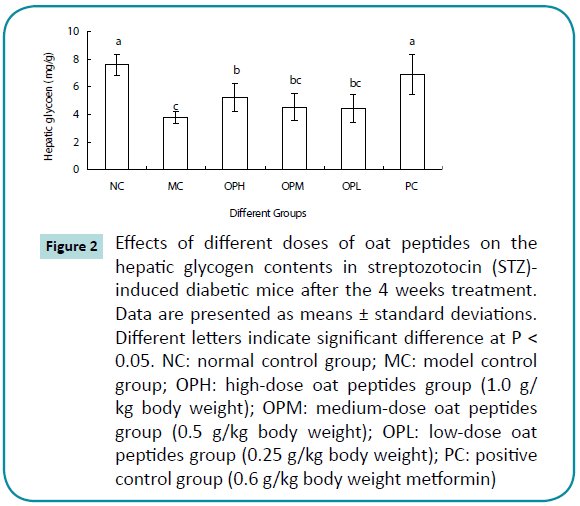
Figure 2: Effects of different doses of oat peptides on the hepatic glycogen contents in streptozotocin (STZ)- induced diabetic mice after the 4 weeks treatment. Data are presented as means ± standard deviations. Different letters indicate significant difference at P< 0.05. NC: normal control group; MC: model control group; OPH: high-dose oat peptides group (1.0 g/kg body weight); OPM: medium-dose oat peptides group (0.5 g/kg body weight); OPL: low-dose oat peptides group (0.25 g/kg body weight); PC: positive control group (0.6 g/kg body weight metformin)
Peptides sequences
The three most prominent ions had m/z ratios of 556.797, 663.32, and 711.87 were clarified. Continuum LC-MS data were processed and searched using PLGS 2.3 software. The peptides sequences of those ions were identified and the MS/MS spectra of Phe-Leu-Gln-Pro-Asn-Leu-Asp-Glu-His (FLQPNLDEH), Asp-Leu-Glu-Leu-Gln-Asn-Asn-Val-Phe-Pro-His (DLELQNNVFPH), and Thr-Pro-Asn-Ala-Gly-Val-Ser-Gly-Ala-Ala- Ala-Gly-Ala-Gly-Gly-Lys-His (TPNAGVSGAAAGAGAGGKH) are shown in Figure 3.
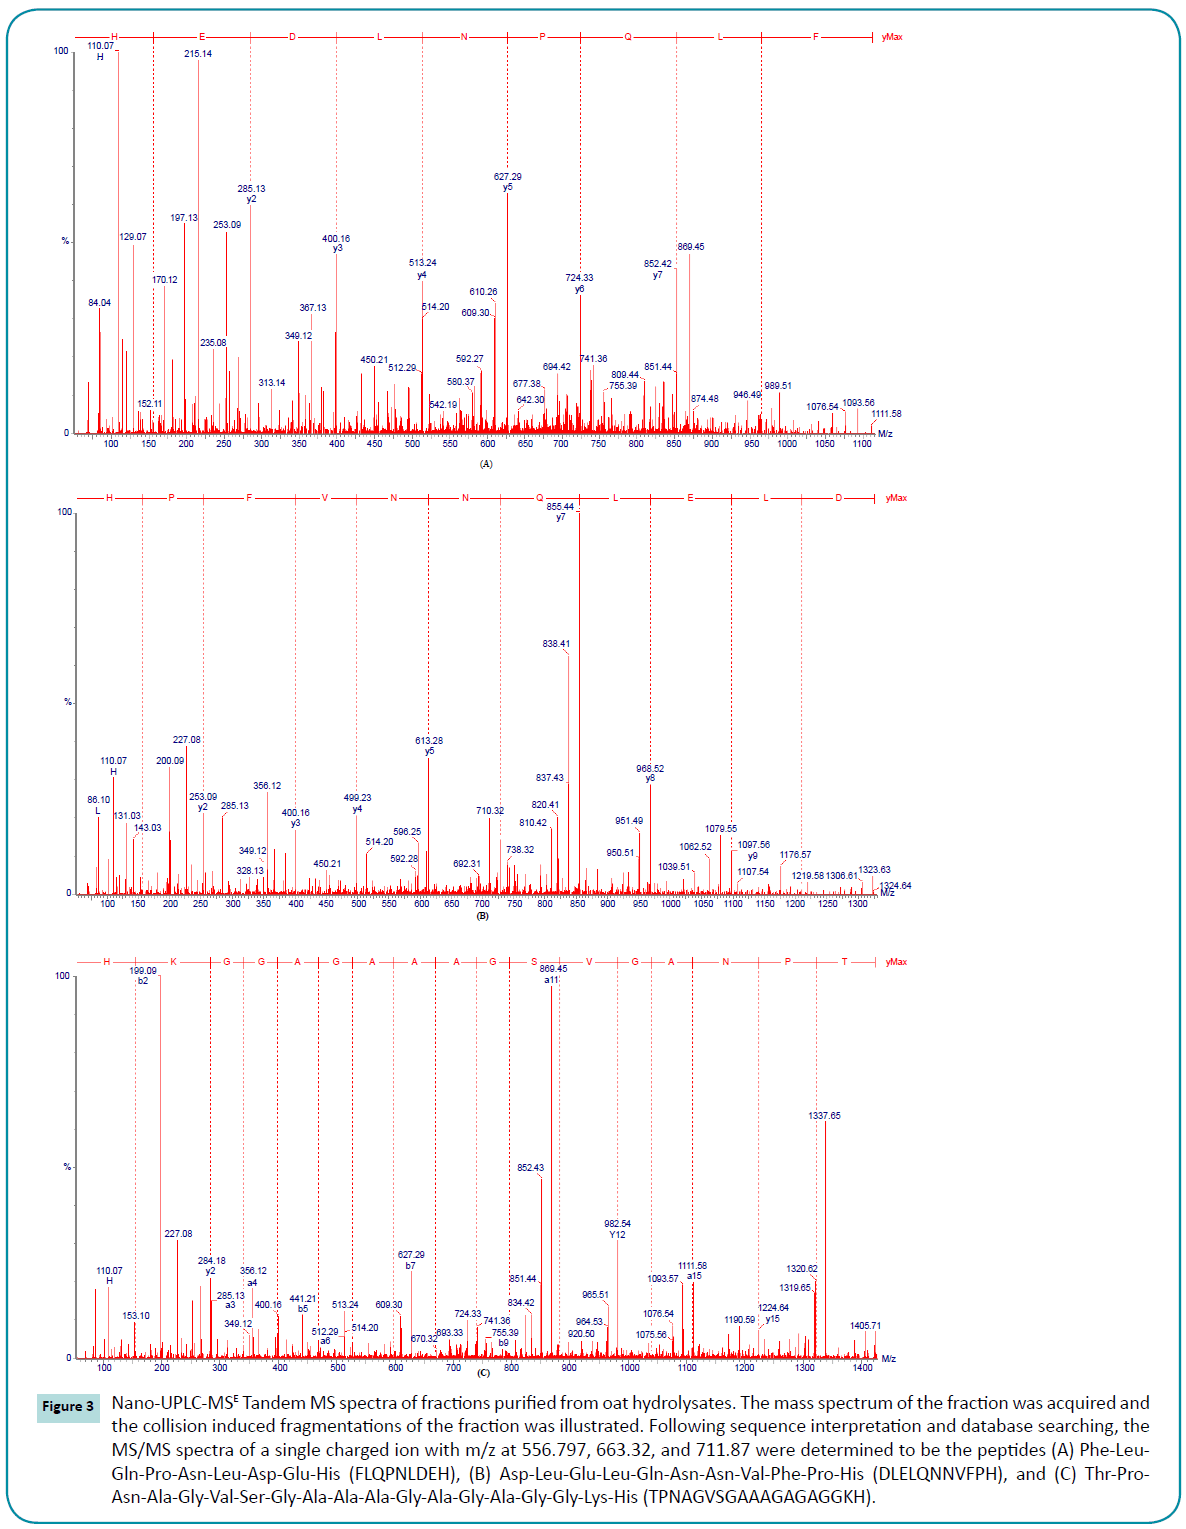
Figure 3: Nano-UPLC-MSE Tandem MS spectra of fractions purified from oat hydrolysates. The mass spectrum of the fraction was acquired and the collision induced fragmentations of the fraction was illustrated. Following sequence interpretation and database searching, the MS/MS spectra of a single charged ion with m/z at 556.797, 663.32, and 711.87 were determined to be the peptides (A) Phe-Leu- Gln-Pro-Asn-Leu-Asp-Glu-His (FLQPNLDEH), (B) Asp-Leu-Glu-Leu-Gln-Asn-Asn-Val-Phe-Pro-His (DLELQNNVFPH), and (C) Thr-Pro-Asn-Ala-Gly-Val-Ser-Gly-Ala-Ala-Ala-Gly-Ala-Gly-Ala-Gly-Gly-Lys-His (TPNAGVSGAAAGAGAGGKH).
Discussion and Conclusions
In preliminary in vitro studies we observed that low molecular weight oat protein hydrolysates prepared by nonspecific proteases decreased starch digestibility by inhibiting α-glucosidase activity. The purpose of this study was to determine if oat protein hydrolysates retained their bioactivity in vivo since digestion by stomach acidity and mammalian digestive enzymes could denature or further hydrolyze and eliminate their inhibitory activity. The STZ-induced diabetic mouse model was selected since it had been shown to have a hypoglycemic response to oat β-glucan treatment [14,15]. Metformin was used as a positive control because it is the first line treatment for T2DM. After a 4-week treatment we observed a dose dependent effect where the mice in the OPH group had the lowest total food intake (29.5 g) and FBG, and the highest food efficiency (0.15 g body weight gain/g food intake), FINS, IAI (1.03), and hepatic glycogen content. There was a significant correlation between the total food intake and the FBG concentrations (r = 0.994, P < 0.01) and FINS concentrations (r = -0.965, P < 0.01). The results suggest that oat peptides reduce the FBG and increase FINS by regulating the food intake of diabetic mice. At a dose of 1200 and 2000 mg/kg body weight β-glucan from oat was also reported to reduce the food intake and FBG of STZ-induced diabetic mice [15]. The similarities in response to the β-glucan and peptide fractions were puzzling and may be due to a common highly bioactive constituent.
Insulin can both reduce endogenous glucose production and stimulate glucose utilization. Therefore, insulin-mediated suppression of endogenous glucose production and insulindependent stimulation are the primary alterations of glucose metabolism in T2DM [22]. In this study, the OPH and PC treatment groups had significantly (P < 0.05) higher FINS concentrations compared with the MC group. Meanwhile, a significantly negative correlation between the FBG concentrations and FINS concentrations (r = -0.979, P < 0.01) was observed. The results show that the hypoglycemic effects of oat peptides are associated with the insulin secretion of diabetic mice. Nilson et al. showed that whey protein increased insulin responsiveness and reduced blood glucose to a greater extent compared with white bread by stimulating the body’s two incretins, GLP-1 and GIP, which are known to stimulate insulin secretion or release by β cells [23]. The higher insulin sensitization was also an important factor of regulating FBG concentrations. A negative correlation was observed between the FBG concentrations and IAI (r =- 0.942, P < 0.01). Shen et al. have reported that oat products could improve the β-cell function and insulin sensitivity after feeding the diabetic mice for 6 weeks [14].
Insulin can also induce cells in the liver, skeletal muscles, and fat tissue to absorb glucose from blood , which is stored as glycogen in the liver and skeletal muscles. The low level of insulin might decrease the availability of the active form of glycogen synthetase [24]. Therefore, regulating the glucose metabolic pathways of diabetic mice may be another aspect for the hypoglycemic activities of oat peptides. The hepatic glycogen contents in OP and PC treatment groups were significantly (P < 0.05) higher than that of the MC group and a positive correlation between the hepatic glycogen contents and the Fins contents (r = 0.982, P < 0.01) was found. Meanwhile, the FBG concentrations were negatively correlated with the hepatic glycogen contents (r =- 0.952, P < 0.01) in all groups. The improvement of glycogenesis of diabetic mice administrated by oat peptides suggested that oat peptides modulated blood glucose levels of diabetic mice by regulating the glycogen metabolism. The peptide fraction MC2-1 obtained from an aqueous Momordica charantia L. var. abbreviata Ser. extract was also reported to produce the significantly increasing hepatic glycogen content in alloxan-induced mice [25].
Although the underlying mechanisms of the proteins or peptides hypoglycemic activities are not yet fully understood, the differences in amino acid composition and protein digestibility are issues for consideration. Van Loon et al. showed that the insulin response to dietary amino acids, oligopeptides, and proteins (consumed with glucose) was related to the combination of leucine, phenylalanine, and arginine content [26]. In the present study, the peptides of FLQPNLDEH and DLELQNNVFPH both had two leucine residues and one phenylalanine residue, which might be related to the antidiabetic effects of oat hydrolsyates. Whey protein stimulating insulin secretion to a greater extent might be due to its easy digestibility [27]. The true protein digestibility of oat was in the range of 90.3 to 94.2% [28], which might be in favor of the antidiabetic effects of oat peptides.
In summary, the present study showed that oat peptides at the higher doses had hypoglycemic activities on STZ-induced diabetic mice by reducing food intake, stimulating insulin secretion and insulin sensitivity, and elevating glycogenesis. The results indicate that the oat peptides’ antidiabetic action could be linked to more than one mechanism. The mechanism of increasing FINS by oat peptides is still not understood. We plan to conduct further studies that will focus on the induction of the surviving intrinsic pancreatic β-cells to secrete insulin or to prevent the disfunction of β-cells by oat peptides.
Acknowledgements
This work was supported by National Natural Science Foundation of China (No. 31271976), the General Project of Beijing Municipal Education Commission (KM201510011006 ), and the Importation and Development of High-Caliber Talents Project of Beijing Municipal Institutions (No. CIT&TCD20130309 and IDHT20130506).
References
- Gorelick J,Kitron A, Pen S, Rosenzweig T, Madar Z (2011) Anti-diabetic activity of Chiliadenusiphionoides. J Ethnopharmacol 137: 1245-1249.
- Nag B, Medicherla S, Sharma SD (2000) Orally active fraction of momordicacharantia, active peptides thereof, and their use in the treatment of diabetes. USA Patent.
- Hartmann R,Meisel H (2007) Food-derived peptides with biological activity: from research to food applications. CurrOpinBiotechnol 18: 163-169.
- Yu Z, Yin Y, Zhao W, Liu J, Chen F (2012) Anti-diabetic activity peptides from albumin against α-glucosidase and α-amylase. Food Chem 135: 2078-2085.
- Gannon MC, Nuttall FQ, Neil BJ, Westphal SA (1988) The insulin and glucose responses to meals of glucose plus various proteins in type ii diabetic subjects. Metabolism 37: 1081-1088.
- Gunnarsson PT,Winzell MS, Deacon CF, Larsen MO, Jelic K, et al. (2006) Glucose-induced incretin hormone release and inactivation are differently modulated by oral fat and protein in mice. Endocrinology 147: 3173-3180.
- Power O,Hallihan A, Jakeman P (2009) Human insulinotropic response to oral ingestion of native and hydrolysed whey protein. Amino Acids 37: 333-339.
- Yibchok-anun S,Adisakwattana S, Yao CY, Sangvanich P, Roengsumran S, et al. (2006) Slow acting protein extract from fruit pulp of Momordicacharantia with insulin secretagogue and insulinomimetic activities. Biol Pharm Bull 29: 1126-1131.
- Yu Z, Yin Y, Zhao W, Yu Y, Liu B, et al. (2011) Novel peptides derived from egg white protein inhibiting alpha-glucosidase. Food Chem 129: 1376-1382.
- Mohamed A, Biresaw G, Xu J, Hojilla-Evangelista MP, Rayas-Duarte P (2009) Oats protein isolate: Thermal, rheological, surface and functional properties. Food Res Int 42: 107-114.
- Liu G, Li J, Shi K, Wang S, Chen J, et al. (2009) Composition, secondary structure, and self-assembly of oat protein isolate. J Agric Food Chem 57: 4552-4558.
- Seligson FH, Mackey LN (1984) Variable predictions of protein quality by chemical score due to amino acid analysis and reference pattern. J Nutr 114: 682-691.
- Daou C, Zhang H (2012) Oat beta-glucan: Its role in health promotion and prevention of diseases. Compr Rev Food Sci F 11: 355-365.
- Shen RL,Cai FL, Dong JL, Hu XZ (2011) Hypoglycemic effects and biochemical mechanisms of oat products on streptozotocin-induced diabetic mice. J Agric Food Chem 59: 8895-8900.
- Dong J,Cai F,Shen R2, Liu Y1 (2011) Hypoglycaemic effects and inhibitory effect on intestinal disaccharidases of oat beta-glucan in streptozotocin-induced diabetic mice. Food Chem 129: 1066-1071.
- Swanston-Flatt SK, Day C, Bailey CJ, Flatt PR (1990) Traditional plant treatments for diabetes. Studies in normal and streptozotocin diabetic mice. Diabetologia 33: 462-464.
- Graham ML,Janecek JL, Kittredge JA, Hering BJ, Schuurman HJ (2011) Thestreptozotocin-induced diabetic nude mouse model: differences between animals from different sources. Comp Med 61: 356-360.
- Lenzen S (2008) The mechanisms of alloxan- and streptozotocin-induced diabetes. Diabetologia 51: 216-226.
- Hamada J (2000) Ultrafiltration of partially hydrolyzed rice bran protein to recover value-added products. J Am Oil ChemSoc 77: 779-784.
- AOAC(1990)Association of official analytical chemists. Offical methods of analysis 15th ed.Washion, DC, USA.
- Shen Z, Li P, Ni RJ, Ritchie M, Yang CP, et al. (2009) Label-free quantitative proteomics analysis of etiolated maize seedling leaves during greening. Mol Cell Proteomics 8: 2443-2460.
- Bonadonna RC (2004) Alterations of glucose metabolism in type 2 diabetes mellitus. An overview. Rev EndocrMetabDisord 5: 89-97.
- Nilsson M, Stenberg M, Frid AH, Holst JJ, Bjorck IM(2004) Glycemia and insulinemia in healthy subjects after lactose-equivalent meals of milk and other food proteins: The role of plasma amino acids and incretins. Am J ClinNutr 80: 1246-1253.
- Goel RK,Mahajan MP, Kulkarni SK (2004) Evaluation of anti-hyperglycemic activity of some novel monocyclic beta lactams. J Pharm PharmSci 7: 80-83.
- Yuan XQ, Gu XH, Tang J, Wasswa J (2008) Hypoglycemic effect of semipurified peptides from momordicacharantia l. Var. Abbreviata ser. In alloxan-induced diabetic mice. J Food Biochem 32: 107-121.
- van Loon LJ, Saris WH, Verhagen H, Wagenmakers AJ (2000) Plasma insulin responses after ingestion of different amino acid or protein mixtures with carbohydrate. Am J ClinNutr 72: 96-105.
- Altman DG, Schulz KF, Moher D, Egger M, Davidoff F, et al. (2001) The revised CONSORT statement for reporting randomized trials: explanation and elaboration. Ann Intern Med 134: 663-694.
- Eggum BO, Hansen I, Larsen T (1989) Protein quality and digestible energy of selected foods determined in balance trials with rats. Plant Foods Hum Nutr 39: 13-21.
6523
References
- Gorelick J,Kitron A, Pen S, Rosenzweig T, Madar Z (2011) Anti-diabetic activity of Chiliadenusiphionoides. J Ethnopharmacol 137: 1245-1249.
- Nag B, Medicherla S, Sharma SD (2000) Orally active fraction of momordicacharantia, active peptides thereof, and their use in the treatment of diabetes. USA Patent.
- Hartmann R,Meisel H (2007) Food-derived peptides with biological activity: from research to food applications. CurrOpinBiotechnol 18: 163-169.
- Yu Z, Yin Y, Zhao W, Liu J, Chen F (2012) Anti-diabetic activity peptides from albumin against α-glucosidase and α-amylase. Food Chem 135: 2078-2085.
- Gannon MC, Nuttall FQ, Neil BJ, Westphal SA (1988) The insulin and glucose responses to meals of glucose plus various proteins in type ii diabetic subjects. Metabolism 37: 1081-1088.
- Gunnarsson PT,Winzell MS, Deacon CF, Larsen MO, Jelic K, et al. (2006) Glucose-induced incretin hormone release and inactivation are differently modulated by oral fat and protein in mice. Endocrinology 147: 3173-3180.
- Power O,Hallihan A, Jakeman P (2009) Human insulinotropic response to oral ingestion of native and hydrolysed whey protein. Amino Acids 37: 333-339.
- Yibchok-anun S,Adisakwattana S, Yao CY, Sangvanich P, Roengsumran S, et al. (2006) Slow acting protein extract from fruit pulp of Momordicacharantia with insulin secretagogue and insulinomimetic activities. Biol Pharm Bull 29: 1126-1131.
- Yu Z, Yin Y, Zhao W, Yu Y, Liu B, et al. (2011) Novel peptides derived from egg white protein inhibiting alpha-glucosidase. Food Chem 129: 1376-1382.
- Mohamed A, Biresaw G, Xu J, Hojilla-Evangelista MP, Rayas-Duarte P (2009) Oats protein isolate: Thermal, rheological, surface and functional properties. Food Res Int 42: 107-114.
- Liu G, Li J, Shi K, Wang S, Chen J, et al. (2009) Composition, secondary structure, and self-assembly of oat protein isolate. J Agric Food Chem 57: 4552-4558.
- Seligson FH, Mackey LN (1984) Variable predictions of protein quality by chemical score due to amino acid analysis and reference pattern. J Nutr 114: 682-691.
- Daou C, Zhang H (2012) Oat beta-glucan: Its role in health promotion and prevention of diseases. Compr Rev Food Sci F 11: 355-365.
- Shen RL,Cai FL, Dong JL, Hu XZ (2011) Hypoglycemic effects and biochemical mechanisms of oat products on streptozotocin-induced diabetic mice. J Agric Food Chem 59: 8895-8900.
- Dong J,Cai F,Shen R2, Liu Y1 (2011) Hypoglycaemic effects and inhibitory effect on intestinal disaccharidases of oat beta-glucan in streptozotocin-induced diabetic mice. Food Chem 129: 1066-1071.
- Swanston-Flatt SK, Day C, Bailey CJ, Flatt PR (1990) Traditional plant treatments for diabetes. Studies in normal and streptozotocin diabetic mice. Diabetologia 33: 462-464.
- Graham ML,Janecek JL, Kittredge JA, Hering BJ, Schuurman HJ (2011) Thestreptozotocin-induced diabetic nude mouse model: differences between animals from different sources. Comp Med 61: 356-360.
- Lenzen S (2008) The mechanisms of alloxan- and streptozotocin-induced diabetes. Diabetologia 51: 216-226.
- Hamada J (2000) Ultrafiltration of partially hydrolyzed rice bran protein to recover value-added products. J Am Oil ChemSoc 77: 779-784.
- AOAC(1990)Association of official analytical chemists. Offical methods of analysis 15th ed.Washion, DC, USA.
- Shen Z, Li P, Ni RJ, Ritchie M, Yang CP, et al. (2009) Label-free quantitative proteomics analysis of etiolated maize seedling leaves during greening. Mol Cell Proteomics 8: 2443-2460.
- Bonadonna RC (2004) Alterations of glucose metabolism in type 2 diabetes mellitus. An overview. Rev EndocrMetabDisord 5: 89-97.
- Nilsson M, Stenberg M, Frid AH, Holst JJ, Bjorck IM(2004) Glycemia and insulinemia in healthy subjects after lactose-equivalent meals of milk and other food proteins: The role of plasma amino acids and incretins. Am J ClinNutr 80: 1246-1253.
- Goel RK,Mahajan MP, Kulkarni SK (2004) Evaluation of anti-hyperglycemic activity of some novel monocyclic beta lactams. J Pharm PharmSci 7: 80-83.
- Yuan XQ, Gu XH, Tang J, Wasswa J (2008) Hypoglycemic effect of semipurified peptides from momordicacharantia l. Var. Abbreviata ser. In alloxan-induced diabetic mice. J Food Biochem 32: 107-121.
- van Loon LJ, Saris WH, Verhagen H, Wagenmakers AJ (2000) Plasma insulin responses after ingestion of different amino acid or protein mixtures with carbohydrate. Am J ClinNutr 72: 96-105.
- Altman DG, Schulz KF, Moher D, Egger M, Davidoff F, et al. (2001) The revised CONSORT statement for reporting randomized trials: explanation and elaboration. Ann Intern Med 134: 663-694.
- Eggum BO, Hansen I, Larsen T (1989) Protein quality and digestible energy of selected foods determined in balance trials with rats. Plant Foods Hum Nutr 39: 13-21.