Keywords
RNA binding proteins, machine learning, SVM, shell features.
Introduction
Proteins are involved in multiple activities for instance molecular interactions with other proteins which comprises small molecules, nucleotides, peptides etc. The biological function of a protein deals with the structure of the specific binding sites. RNA-protein interaction plays crucial role in various biological processes ranging from gene expression, protein synthesis, post transcriptional regulation, and other regulatory processes. Thus taking this as a key note we have dealt with the structures of proteins, to be more specific RNA binding protein pockets in our work. Also due to the tendency of any system to attain the stable state/minimum total potential energy, as stated by the second law of thermodynamics, a ligand also tries to attain the stable configuration with respect to the RNA binding protein pocket. Prediction of ligand binding sites in RNA-binding protein pockets can provide biological insights for RNA-protein interactions and their functional consequences.
Interaction between the protein and the pocket takes place at protein’s pocket surface which is highly complex with longitudinal arrangement. Therefore, the surface properties become significant. Moreover, we are aware of the direct relation between a protein and its pocket, hence the combined features of a protein and its pocket will play a key role [1]. RNA binding proteins (RBPs) play a key role in post-transcriptional control of gene expression [2], which along with transcriptional regulation, is a highly significant way to regulate patterns of gene expression during developmental stages. Thus, the identification and prediction of RNA binding pockets is an important step towards comprehensive understanding of RBPs control over organism development [2]. We have used SVM [3] a widely used tool with functions like polynomials and Radial Basis for the classification purpose [4]. The effective numbers of parameters were adjusted automatically to match the complexity of the problem, as performed by Bobadilla et al. [5]. Therefore, with the combined use of evolutionary features and SVM, we have tried to predict the ligand binding sites in RNA binding protein pockets.
Proteins play essential roles in the human body and are involved in all cellular activities. In many cases, a protein is functionally activated by a molecule (ligand) binding to it, acting as a switch [6]. For this reason determining which ligand binds to a particular protein is of fundamental importance in identification of protein function [7].
Protein-ligand interactions are known to be based on geometric shapes, configurations and electrostatic complementarity [7]. Determining which ligand can bind to a protein is a complex matter because of:
1. The complex nature of protein-ligand interactions and
2. Flexibility of binding sites.
The general method for identification of the binding sites involves volumetric search for large cavities with the help of software like FPOCKET [8], SURFNET [9], VISGRID [10] etc. We have used FPOCKET a “unique binding pocket detection” method which involves similarity search on protein surface done by capturing the local surface features of ligand binding pockets. These ligand bound pockets are then separated and finally the shell features based on these pockets are constructed in which the radius of each shell will be 1 Å. These shells and its features are constructed by taking a radial distance of 1 Å from the center of the pocket. In order to calculate the radial distribution, data is collected inside shells of 1 Å thickness, based on their distance from the center of the site [11]. Through these shell features, a line of classification can be generated using the Support Vector machine (SVM). Subsequently, the remaining features of FPOCKET were also taken into account and processed so as to be fed into the SVM model, the output of which was checked for accuracy.
Materials and methods
The training Protein dataset in this study was obtained from the protein–RNA complexes available at the Protein Data Bank (PDB, https://www.rcsb.org/pdb/) and NCBI. Dataset with reference of BINDN [12] has been processed & run in order to construct our SVM model. The selection of 107 structures was done by X-ray crystallography of resolution within 3.5 Å. A program was written in C++ which takes a set of structure files as input in order to select the RNA binding residues, with per residue selection on the basis of above mentioned criteria. While for selecting the negative dataset, a mixture of different segments of proteins were selected. Thus, in this way only those PDB id’s were selected which were either having a glucose or any other binding site (except for RNA binding site).
Identification of Ligand Binding Sites
From the processed dataset, the initial task was to find the pockets and select only those pockets which had ligand in them (which is mandatory for the positive dataset and optional for the negative). This is done by 2 methods:
1. PDBSUM
2. FPOCKET
To begin with PDBSUM, the respective PDB ID is provided at the site and then it detects the ligand with all other necessary details like chains (A, B, C, D .etc) and name of the amino acid present at that location/site. It also gives the number of amino acid residues available at that site. Consequently, only those proteins and pockets were selected which had ligand present in them. After selecting the pocket and its respective protein, a separate filtered dataset was created.
Afterwards all these selected pockets (along with the pockets found by the PDBSUM) a filtered data set having ligands with their full information was established and combined. Along with protein pockets these proteins comprise a dataset of 82 positive structures. In order to generate the negative dataset, few of the pockets which did not have ligand were also selected.
Feature Extraction
Machine learning algorithms are designed to support only numerical data as an input. This numerical data is provided as features to machine-learning algorithms. Thus a program was specifically written in order to generate this numerical data to be fed as input.
Finally the feature extraction was done by 2 ways (Fig. 1).
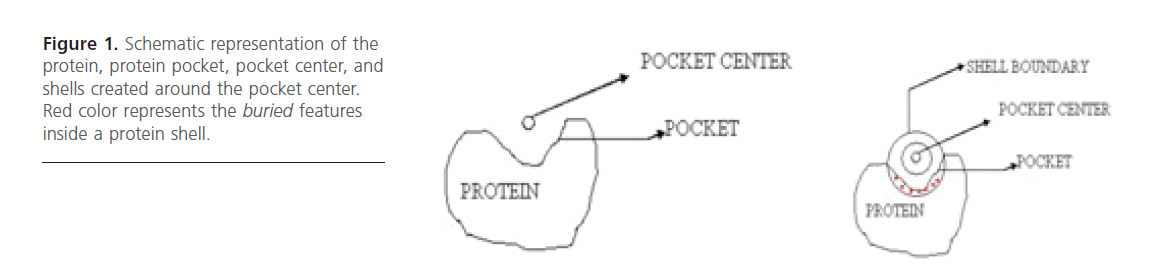
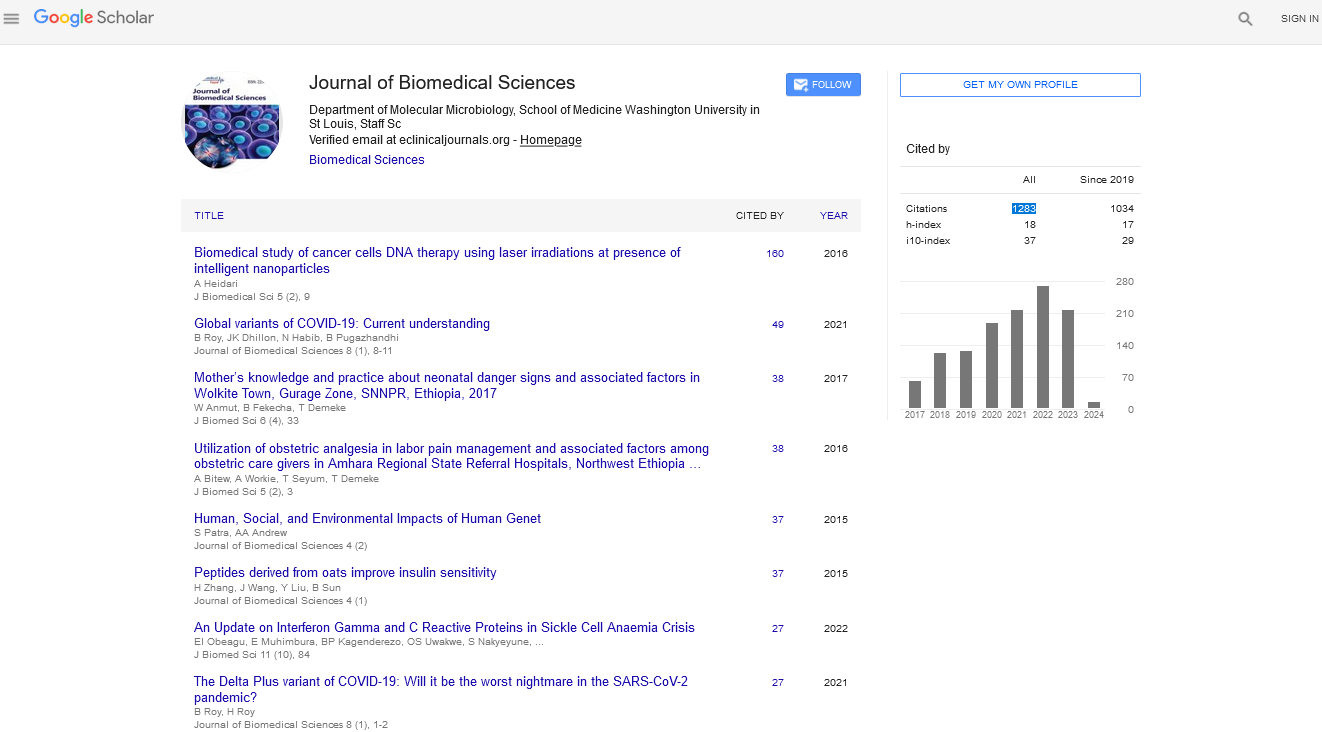
Figure 1. Schematic representation of the protein, protein pocket, pocket center, and shells created around the pocket center. Red color represents the buried features inside a protein shell.
1. Shell features
2. F-Pocket features
Shell Features
Shell features are which further classified as:
• Taking into account both the pocket and protein.
• Taking shells with respect to pocket only.
Our research dealt individually with both of the above apart from checking their corresponding accuracies.
Binding Site Representation: It was represented as a sphere having its centroid concurrent with that of the binding site. This sphere was then subdivided into concentric shells [13]. The first layer width was fixed to 5 Angstrom unit while the width of sub sequent 5 layers was 1 Angstrom each. Eventually 14 shell features came out as very useful features. These 14 physico-chemical features were then used as descriptors.
Fpocket Features
In this approach the features produced by FPOCKET software were taken into account. There were 37 features which came as output of the FPOCKET run and included pre-computed feature values generated by FPOCKET algorithm (based on the pocket detection algorithm used). Then the feature selec-tion approach was used, wherein those features which provide more reliable accuracy (in classification) were selected. Eventually WEKA software was employed for feature selection process and it was found that all the 37 features were equally responsible for generating the appropriate output (Fig. 2).
Figure 2. Diagram representing the feature wise distribution of inputs to SVM. F-pocket features and shell features being fed to the SVM along with kernel parameters. Hypothesis will be generated after computational validations.
Classification
I machine learning classification means a supervised procedure in which individual items are placed into groups based on quantitative information of one or more characteristics inherent in those items and based on a training set of previously labeled items. Classification can be done successfully with the use of LIBSVM tool. SVM takes the data in numerical form (which actually is the output of another program written by us) as an input file for its classification. After analyzing this input file it produced the cross-validation accuracy on the basis of different sets of kernels and parameters given to it. Sequentially, for the improvement of the accuracy, we proceeded with WEKA for feature selection and then tried running the SVM with those selected features.
Information gain attribute evaluator suggested that all 37 features have equal weightage in determining accuracy for fpocket features (with a linear kernel) which is 82.63%.
But as we will see, among all the features i.e. FPOCKET and shell features, shell features came out to be more useful. These are basically 14 features for each shell. And there were 6 shells for each protein. This sums to 84 features (14* 6) in all for one particular protein.
But as we will see, among all the features i.e. FPOCKET and shell features, shell features came out to be more useful. These are basically 14 features for each shell. And there were 6 shells for each protein. This sums to 84 features (14* 6) in all for one particular protein.
As it can be clearly seen from table 3, the result obtained with 10 fold cross validation were taken into consideration. Moreover we came across the best accuracy so far, which is 89.34% (with linear kernel). Finally establishing the top 10 features as the most important features due to their higher accuracy. Hence, in shell features best accuracy i.e. 89.34% comes out with top 10 features in linear kernel. The top 10 ranked features, obtained using the InfoGain feature of WEKA are listed in the table 4, which thus concludes that the results obtained with the Shell features were the best so far.
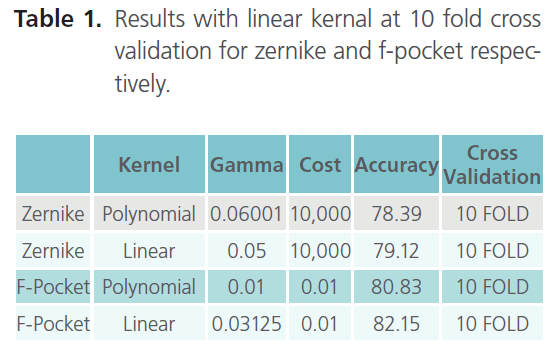
Table 1. Results with linear kernal at 10 fold cross validation for zernike and f-pocket respectively.
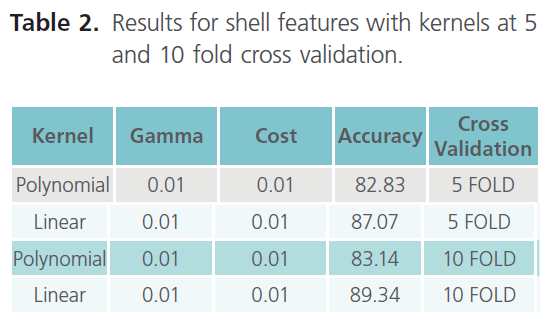
Table 2. Results for shell features with kernels at 5 and 10 fold cross validation.
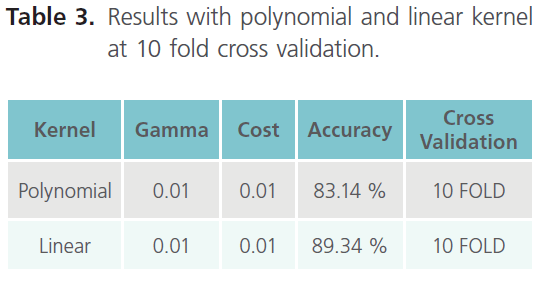
Table 3. Results with polynomial and linear kernel at 10 fold cross validation.
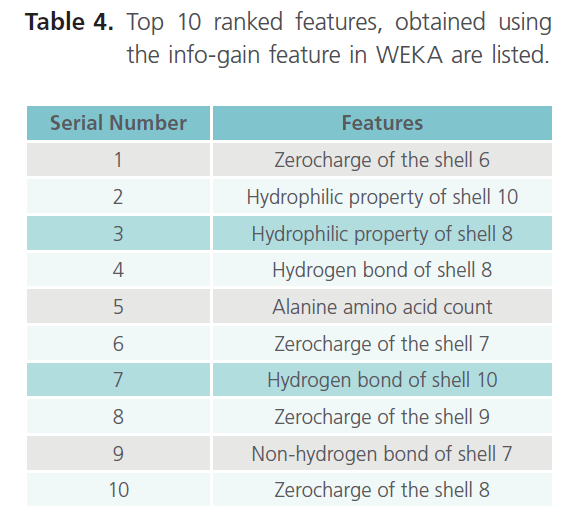
Table 4. Top 10 ranked features, obtained using the info-gain feature in WEKA are listed.
There are few other methods developed for the prediction of RNA bindidng residues [14,15], while none of them applied the features that we applied for the prediciton. To further justify our result we tried to get the result using the combination of the fpocket and shell features, but we found that the accuracy comes out to be 86.85 % and after the feature selection we got the same top 10 ranking as we got for the shell features in table 13. So, by this we concluded that the results obtained with the Shell features are significant.
Conclusion
We came to know the importance of the buried properties of the protein, which was done by formation of shells within the protein. Also it’s evident that ligand binding sites can be successfully identified in RNA binding protein using their pocket information. To find the ligand, a combined approach of FPOCKET and PDBSUM was used which gave better information. Some of the very useful and informative features visible to us like charge, hydrophilic nature, hydrogen bonding (which also happen to be one of the top 10 ranked features) proved out to be the best features for classification through the SVM. By the use of FPOCKET, some additional features were discovered which have never been employed in previous studies. These features give us information about the nature of the interaction between a pocket and ligand. Therefore, our approach got the fruitful directions for the prediction of ligand binding sites in RNA binding protein pockets with the use and application of SVM through which successful classification of our dataset was done. A classification of 89.34 % accuracy was achieved using 10 fold cross validation. Thus bringing into focus, RNA based applications like study of point mutation, transcription etc and hence throwing some light on the necessary preparation of therapeutic tools in the medical field. A further extension of our work could involve the incorporation of certain biochemical properties as well. Other features and descriptors for instance Zernike can also be brought into the focus by making use of some other proteins in dataset.
1844
References
- Peters,pP., Fauck, KL., Fro¨mmel, C.“The Automatic Search for Ligand Binding Sites in Proteins of Known. Three-dimensional Structure Using only Geometric Criteri . J Mol Biology. 1996; 256: 201-213.]
- Kumar, M., Gromiha, .M., Raghava, .P.”Prediction of RNA binding sites in a protein using SVM and PSSM, Proteins 2008; 71: 18–-19).]
- Chih-Wei,uH., Chih-Chung, Cd., Chih-Jen, ,.“A Practical Guide to Support Vector Classificatio,;(200).
- Boser, E., Guyon, M., Vapnik, N,“A training algorithm for optimal margin classifier . In D. Haussler editor 5th Annual ACM Workshop on COLT, 1992; 5: 144-15).
- Bobadilla, L., Nino, F , Narasimhan, “. Predicting and characterizing metal-binding sites using support vector machine,. Proc ICBA 2009 8- 30–-31).
- Rayan, Ch. Protein surface descriptors for binding sites comparison and ligand prediction.[Onlinl: perso.eleves. bretagne.ens-achan.fr/~chikhi/Report07RayanChikhi.pdf..
- Lee, S., Daisuke, ,.”Binding Ligand Prediction for Proteins Using Partial Matching of Local Surface Patche . JlMol. 2010; 12: 5009-502).
- Laskowski, A,“SURFNET: A program for visualizing molecular surfaces, cavities, and intermolecular interactions.,. Mo. Graphics, 1995; 13: 32–-33).
- Bin, Li., Srinivasan,eT., Manish,lA., La Karthik, D., Kihara, D.“Characterization of local geometry of protein surfaces with the visibility criteri . Proteins-structure Function and Bioinformatics- PROTEIN 2008; 71: 670-683.
- Bagley, .C., Wei, L., Cheng, C.d Altman, .B.“Characterizing oriented protein structural sites using biochemical propertie . Proc Int Conf Intell Syst Mol Bio . 1995; 3: 12-20..
- Liangjiang, W., Brow., S.“BIND : A server used for predicting DNA/RNA using amino acid sequenc”. Nucleic Acids Research 2006; 24: 243-24).
- Bagley, C., Altman, B,“Recognizing protein binding sites using statistical descriptors of their 3D environment . SympBiocomputaional. 1995; 497-508.
- Terribilin , M., Sander, J., Jae-Hyung, Le, Zaback, P., Jernigan, R., Honavar, V., Dobb:, D.“RNAbindR. Nucleic Acid Research 2007; 35: 578-58)
- Cheng-Wei,gCh., Chia-Yu, E., Jenn-Kang,gH., Ting Yi, S., Wen-Lian, u. Predicting RNA-binding sites of proteins using support vector machines and evolutionary information. BMC Bioinformatics 2008; 9 (Suppl. 12): S).