Keywords
PDE5; cGMP; MLR; QSAR; Regression analysis
Introduction
There are two important secondary messengers that regulate many physiological processes i.e., 3′,5′-cyclic adenosine monophosphate (cAMP) and 3′,5′-cyclic guanosine monophosphate (cGMP). Any extracellular stimulation causes a rapid change in the level of cyclic nucleotide, producing the physiological responses elicited by the stimulus. The levels of these intracellular cyclic nucleotides are regulated by the cyclases that synthesize and phosphodiesterases (PDEs) that degrades them into inactive metabolite [1]. According to their specificity toward hydrolysis of cyclic AMP (CAMP) or cyclic GMP (cGMP) can be grouped into 11 families [2]. PDE5, cGMPspecific PDE, is distributed in various tissues such as lung, kidney, spleen, endothelial cells, heart and smooth muscle cells, etc. and plays a very important role in the regulation of the cellular level of cGMP. PDE5 inhibitors elevate the level of cGMP which mediated various vascular functions so today it is an attractive target for the treatment of hypertension [3]. The binding site of cGMP on PDE5 is present on the N-terminal regulatory GAF-A domain [4] of the enzyme. Both protein kinase A (PKA) or PKG can phosphorylate PDE5, and this causes a significant increase in PDE5 activity. PDE5 inhibitors compete with the substrate cGMP for binding to the protein at the catalytic site. Even though cGMP binding to the catalytic site stimulates cyclic-nucleotide binding to the allosteric [5] sites, inhibitors do not elicit the same function. Currently there are three (Sildenafil, vardenafil and tadalafil) Phosphodiesterase type-5 inhibitors (PDE5-i) used in the treatment of male ED [6]. Recently FDA approved sildenafil for the treatment of pulmonary hypertension due to its vasodilatory and antiproliferative effect on the pulmonary [7] vasculature. QSAR (quantitative structure activity relationship) [8] provides the guidelines about the important properties of chemical compounds so that drugs of higher potency can be obtained. A successful QSAR model for tetracyclic guanine reported for PDE5 inhibition was generated to understand the relationships between chemical structure and biological activity. Comprehensive literature review reveals that very few attempts has been made to build QSAR model in the field of PDE5 as an antihypertensive agent. In the present study, QSAR model was developed by using linear and nonlinear methodology that may be helpful in development of potent antihypertensive agents.
Materials and Methods
QSAR analysis and statistical analysis were carried out by using TSAR 3.3 and chemical structures were sketched by using Chem draw ultra (8.0).
Data set
In the present study, a data set 38 compounds of tetracyclic guanine [9] derivatives (Table 1) has been taken from the literature for QSAR studies. The reported IC50 values (nM) for PDE-5 have been changed to the logarithmic scale [log IC50], for QSAR study.
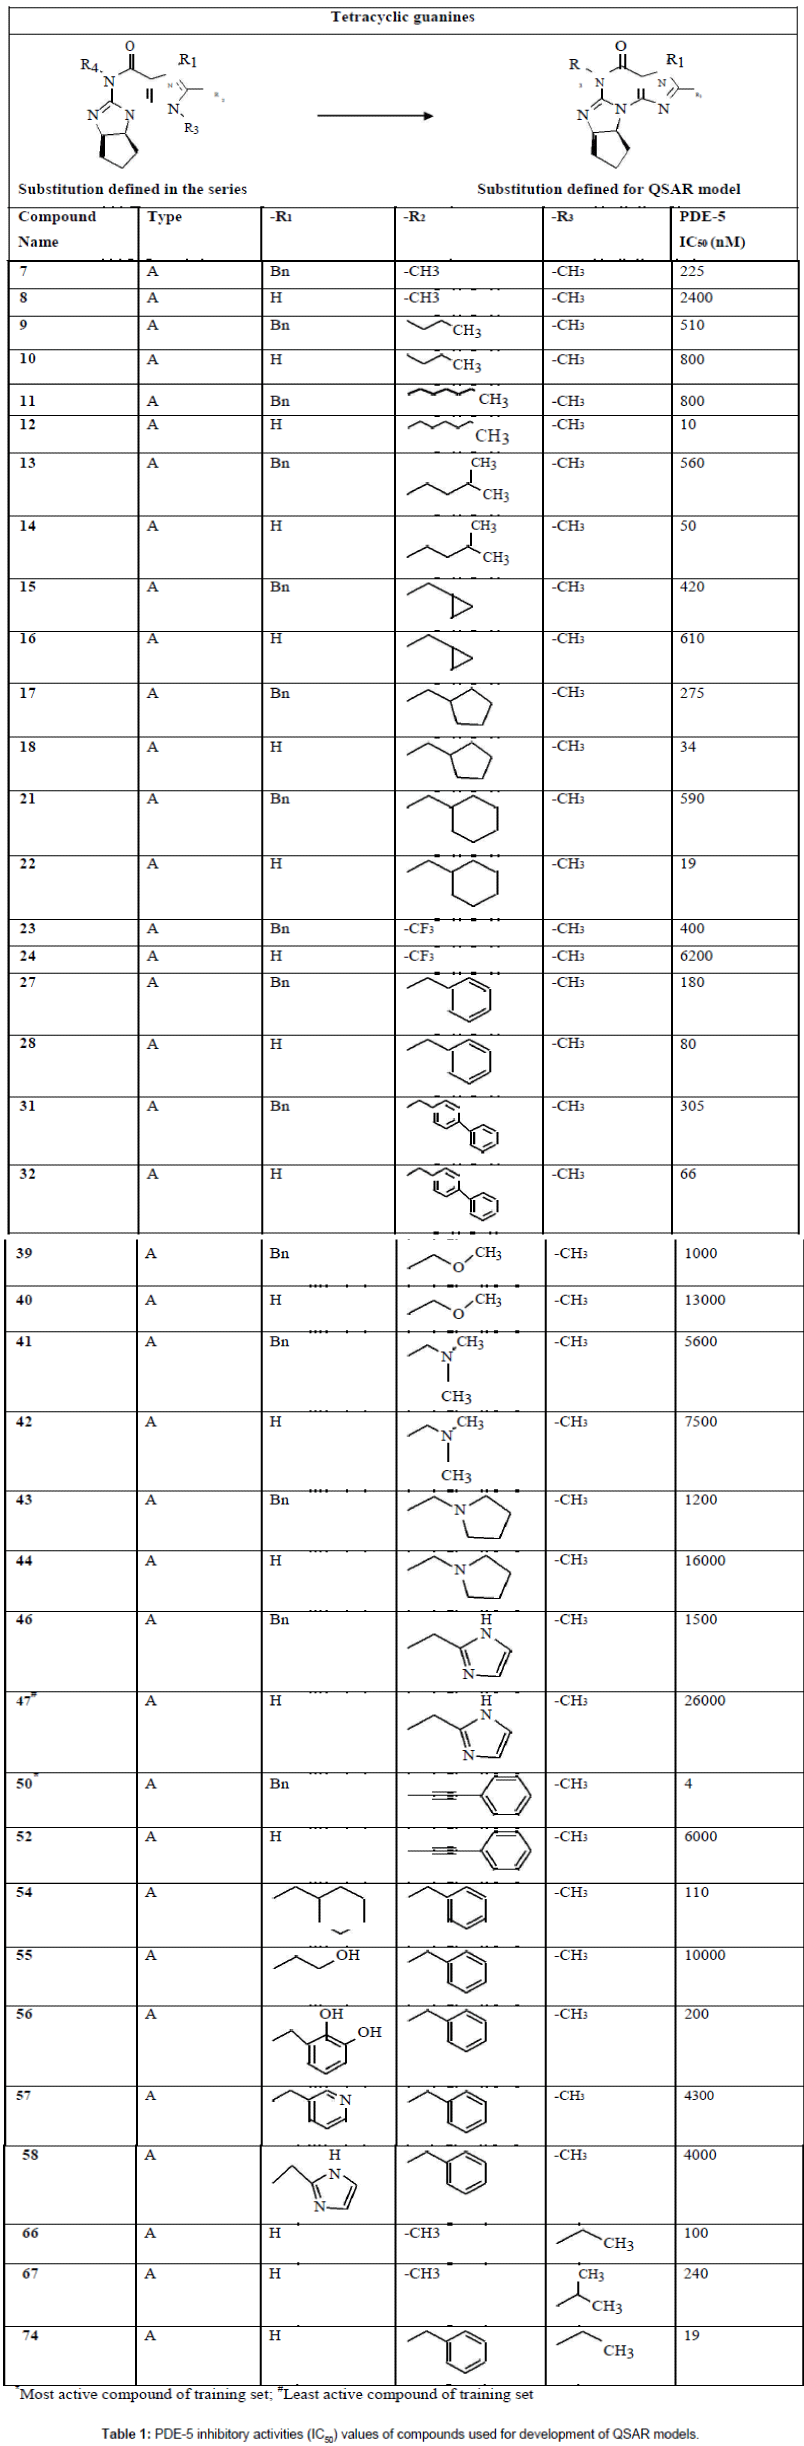
Table 1: PDE-5 inhibitory activities (IC50) values of compounds used for development of QSAR models.
Structure preparation and descriptor calculation
The 2-D Structures were drawn by using the Chemdraw ultra 8.0 software and imported to the Tsar window. The structures were cleaned up and subjected to charge calculation. The Charge-2 CORINA 3D package in TSAR 3.3 was used to calculate partial charge, and their geometries were optimized using its Cosmic [10] Module. Molecular descriptors for the whole molecule and their substituents were calculated, which vary in common points of the generic structure. Several Topological, steric, electronic, Connectivity, shape indices, hydrophobic descriptors were generated to describe their physicochemical [11] properties and altogether more than 250 descriptors (independent variables) were calculated. However, generation of large pool of descriptors could increase the risk of over fitting of the data, in order to evade this problem pruning of data was carried out which helped in reducing data redundancy. Descriptors with the zero values for all the compounds were discarded. To reduce the pool of descriptors a correlation matrix [12] was generated to study the data pattern. Data was reduced by pair wise correlation in which the correlation was analyzed between biological activity and descriptor and between intercorrelated descriptors. Amongst the highly intercorrelated descriptors, the one that had a high correlation with biological activity [13] were retained for the development of QSAR model and the other was discarded. Through the data reduction processes, eventually 22 descriptors were chosen, which were not correlated with each other. This process of data reduction was repeated number of times to get descriptors which were highly correlated with biological activity. Finally, the QSAR model consisted of three descriptors without any intercorrelation.
Model development and statistical analysis
Multiple linear regressions analysis [14] was performed to quantify the relationship between physiochemical parameters and biological activities. Stepwise MLR analysis with leave-one-out (LOO) was used for the development of QSAR model. The dataset was randomly split into a training set of 26 and a test set of 6 compounds. It was divided in such a way that both contained the compounds with diverse chemical structures and biological activity. The generated model was analyzed by statistical parameters such as correlation coefficient (r2), cross validated coefficient (r2cv it is the key measure of the predictive power of the model), lowest s value (s’ signifies the standard error of the regression model) and high f value [15]. The predictive capability of the 2D-QSAR models was determined with the help of an internal test set of 6 compounds that were not included in the model development. Structure generation, optimization, charge derivation, and all other steps of test sets were done in the same way as in the case of training set as described above, and their activities were calculated using the model generated by the training set. MLR produced the best model with three descriptors. Partial least square analysis was also carried out to get stable, correct and highly predictive models even for correlated descriptors. This regression technique is especially useful when the number of descriptors (independent variables) is comparable to or greater than the number of compounds (data points) [16].
Neural network analysis
Neural network analysis is also called as forward feed neural network (FFNN). It is a computer based programme in which a number of processing elements, also called neurons, units, or nodes are interconnected by links in a netlike [17] structure forming ‘‘layers.’’ A certain variable value is consigned to every neuron. The input neurons gather their values from independent variables signifying the input layer [18]. The hidden neurons assemble values from other neurons, giving a result that is passed to a successor [19] neuron. The output neurons receive values from other units and correspond to different dependent variables, forming the output layer [20]. The whole neural network represented as I–H–O, where I, H, and O are the number of neurons in the input, hidden, and output layers, respectively. FFNN analysis was performed by using the same descriptors that were used to develop MLR and PLS regression model to assess the relative predictivity of the linear and non-linear methods. The results of FFNN were visualized on a 2D plot of output node against input (dependency graphs).
Results and Discussion
QSAR analysis is one of the most useful technique for optimizing lead compounds and designing a new drug. Best equation derived from QSAR model should use the minimum number of descriptors to obtain the best fit. The molecular structural schemes of 38 compounds have been taken from the published article. The structure and biological activity of Tetracyclic Guanine inhibitors are shown in Table 1. The inhibitory activity of PDE5 inhibitors was shown in IC50 (nM) (where IC50 is the effective concentration (in nM) required to inhibit PDE- 5 enzyme by 50%) The data sets of 38 molecules were divided into a training set of 26 compounds and the rest of 6 compounds were included in the test set. In this series nucleus represented in Figure 1 was excluded because of structural diversity so as to avoid any obstruction in the development of the model.
| Descriptor |
Total dipole (whole molecule) |
Lipole Z Component (whole molecule) |
Ipso atom E-state index (subst. 3) |
Number of H-bond Acceptors |
Biological Activity |
| Total dipole (whole molecule) |
1 |
0.19172 |
0.21754 |
-0.042868 |
-3.0855 |
| LipoleZ Component (whole molecule) |
0.19172 |
1 |
0.054791 |
0.068609 |
-0.45335 |
| Ipso atom E-state index (subst. 3) |
0.21754 |
0.054791 |
1 |
0.017916 |
0.24714 |
| Number of H-bond Acceptors |
-0.042868 |
0.068609 |
0.017916 |
1 |
-0.70999 |
| Biological Activity |
-0.30855 |
-0.45335 |
0.24714 |
-0.70999 |
1 |
Table 2: Correlation matrix to analyse the correlation between molecular descriptors and biological activity.
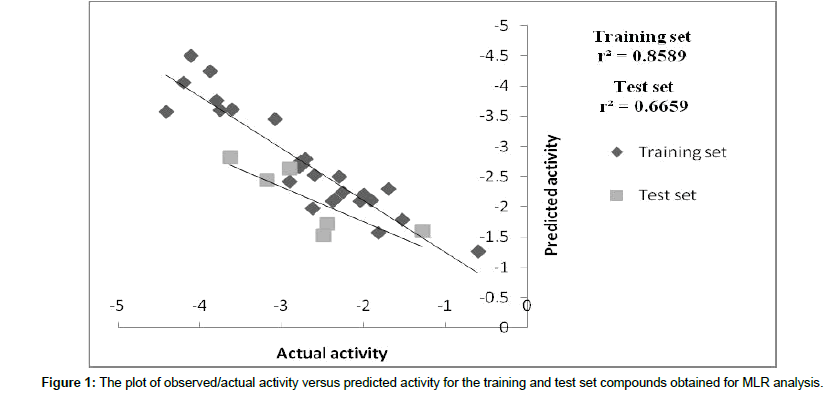
Figure 1: The plot of observed/actual activity versus predicted activity for the training and test set compounds obtained for MLR analysis.
Linear regression analysis
The multivariate analysis was performed using the leave one out row method with the whole data set with insignificant predictive power r2cv MLR=0. 278; r2cv PLS=0.578. The statistical significance of the model was improved by reducing the pool of descriptors as described in above section. Finally, four descriptors were selected for the development of the model, which were independent of each other and well correlated with biological activity. The relationship between generated molecular descriptors and biological activity is represented through correlation matrix (Table 2).
In equation 1, 2 and 3 (Table 3) the value of standard error was quite high and the value of cross validation and F-test is quite low. In order to improve the predictivity of the model and to gradually improve the statistical significance, outliers were deleted. Outliers [21] are the data points that are fitted far apart from the linear model as well as act on some different mode of binding. In this study, 6 outliers such as 12, 22, 39, 52, 55 and 8 with different predictions were detected by using a training set deleting one by one as shown in equation. After removing outliers and number of descriptors the MLR model showed an improved statistical value and predictivity as shown in equation 1
| MLR Model |
r |
r2 |
r2 cv |
s-value |
F-value |
Outlier |
| 1) Y=-0.214 × X1-0.121 × X2+3.299 × X3-1.316 × X4-0.001 × X5-7.132 |
0.78 |
0.61 |
0.44 |
0.66 |
8.47 |
ND |
| 2) Y=-0.217 × X1-0.114 × X2+3.238 × X3-1.267 × X4-0.0009 × X5-7.0713 |
0.79 |
0.63 |
0.43 |
0.62 |
8.53 |
12 |
| 3) Y=-0.199 × X1-0.120 × X2+3.078 × X3-1.223 × X4-0.0005 × X5-6.963 |
0.80 |
0.65 |
0.45 |
0.59 |
9.14 |
12, 22 |
| 4) Y=-0.235 × X1-0.113 × X2+3.122 × X3-1.343 × X4-0.0004 × X5-6.893 |
0.82 |
0.67 |
0.47 |
0.58 |
9.74 |
12, 22, 39 |
| 5) Y=-0.419 × X1-0.098 × X2+3.180 × X3-1.452 × X4-6.190 |
0.89 |
0.80 |
0.68 |
0.45 |
23.10 |
12, 22, 39, 52 |
| 6) Y=-0.342 × X1-0.105 × X2+2.976 × X3-1.488 × X4-6.119 |
0/91 |
0.83 |
0.73 |
0.40 |
28.38 |
12, 22, 39, 52, 55 |
| 7) Y=-0.354 × X1-0.0987 × X2+2.919 × X3-1.527 × X4-5.933 |
0.92 |
0.85 |
0.75 |
0.38 |
31.94 |
12, 22, 39, 52, 55, 8 |
Table 3: MLR analysis of training set which generated various QSAR equations.
Y=-0.35434085 × X1-0.098792322 × X2+2.9191632 × X3- 1.5278097 × X4-5.9336643 (1)
X1=Total dipole moment (whole molecule), X2=Lipole Z component (whole molecule), X3=Ipso atom estate index (subst. 3), X4=Number of H-bond acceptors (subst. 2)
s=0.38, f=31.94, r=0.92, r2=0.85, r2cv=0.75
• r2 cv>0.6: The model is fairly good.
• 0.42cv<0.6: The model is questionable.
• r2 cv<0.4: The model is poor.
The above equation shows good correlation coefficient (r) of 0.92 between descriptors and PDE-5 inhibitors. Squared correlation coefficient (r2) of 0.85 explains 85% variance in biological activity. Cross validated squared correlation coefficient of this model was 0.75 which shows the good internal prediction power of the model. Low value of standard deviation 0.38 indicates the accuracy of statistical fit. To assess the significance of individual descriptor t-test was performed. Hydrogen bond acceptor (subst. 2) has high t-(-8.5829) value showing significance of this descriptor in the developed model. The calculated t-values for all descriptors are given in Table 4. The predictive ability of the model was also further validated by using the test set of 6 compounds. The test set was not included during the development of the model. The value of r2 for test set was found to be 0.66 which predicted the robustness of the model. Plot between actual and predicted biological activity of training and test set of MLR is depicted in Figure 1.
| Descriptor Name |
Jacknife SE |
Covariance SE |
t-value |
| Total dipole (whole molecule) |
0.16423 |
0.087308 |
-4.0585 |
| LipoleZ Component (whole molecule) |
0.024258 |
0.023143 |
-4.2688 |
| Ipso atom E-state index (subst. 3) |
0.39903 |
0.691 |
4.2246 |
| Number of H-bond Acceptors |
0.25861 |
0.17801 |
-8.5829 |
Table 4: The t-test values, Jacknife SE and Covariance SE values of the descriptors used for regression analysis.
The best linear model developed by MLR was subjected to a PLS analysis to get model interpretability. The r2 value of test set of MLR and PLS is comparable 0.66 and 0.65 respectively, which represents the predictive ability of the model. Graph between actual and predicted value of training and test set of PLS is shown in Figure 2. Equation generated by PLS analysis is shown in equation 2.
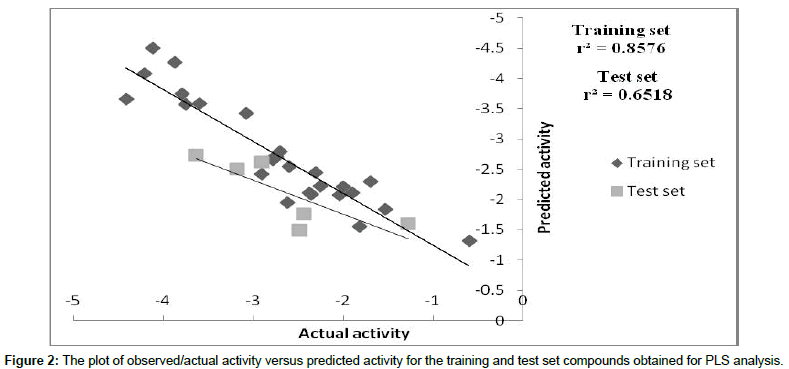
Figure 2: The plot of observed/actual activity versus predicted activity for the training and test set compounds obtained for PLS analysis.
Y=-0.31858131 × X1-0.10244234 × X2+2.9151349 × X3- 1.5390098 × X4-6.0701838 (2)
Where X1=Total dipole moment (whole molecule), X2=Lipole Z component (whole molecule), X3=Ipso atom E-state index(subst.3), X4=Number of H-bond Acceptors (subst.2)
Statistical significant=1.1644, Residual sum of square=3.5602, Predictive sum of squares=5.4425, r2cv=0.78, r2=0.85
We employed the forward feed neural network (FFNN) functionality, which undergoes a supervised training by the back propagation error. In this study, 2 inputs for the neural network were used, while the outputs were the log 1/IC50 values. The number of hidden nodes represents the training and test patterns (in this case 50% was used for training, 50% for test purposes). The statistics obtained from the FFNN PDE-5 inhibitors data included net configuration=4-2-1 (4 input nodes, 2 processing nodes, 1 output node), with r2=0.89 for training set and r2=0. 63 for the test set. Plot between 1/IC50 and the predicted value of training and test set of ANN as shown in Figure 3. The dependencies plot of ANN revealed that Total dipole moment (whole molecule) and Lipole Z component (whole molecule) correlated negatively with the biological activity, Ipso atom E-state index (subst.3) correlated positively with the biological activity and Number of H-bond Acceptors (subst.2) correlated negatively with biological activity as shown in Figure 4. The difference between actual and predicted value of training and test set of MLR, PLS and ANN is shown in Tables 5 and 6.
Figure 3: The plot of observed/actual activity versus predicted activity for the training and test set compounds obtained for ANN.
| S. No. |
Actual activity
-log IC50 (nM) |
Predicted activity(nM) |
| MLR |
PLS |
NN |
| 7 |
-2.35218 |
-2.1155 |
-2.08952 |
-2.2751 |
| 9 |
-2.70757 |
-2.79439 |
-2.79541 |
-2.847 |
| 10 |
-2.90309 |
-2.41099 |
-2.41833 |
-2.32035 |
| 13 |
-2.74819 |
-2.70401 |
-2.70316 |
-2.70852 |
| 14 |
-1.69897 |
-2.28962 |
-2.29374 |
-2.16467 |
| 15 |
-2.62325 |
-1.97294 |
-1.94473 |
-2.18138 |
| 16 |
-2.78533 |
-2.65694 |
-2.6512 |
-2.66312 |
| 18 |
-1.53148 |
-1.78087 |
-1.83473 |
-1.55891 |
| 21 |
-2.77085 |
-2.75288 |
-2.69442 |
-2.81698 |
| 23 |
-2.60206 |
-2.51691 |
-2.54927 |
-2.63196 |
| 24 |
-3.79239 |
-3.75327 |
-3.74547 |
-3.91776 |
| 27 |
-2.25527 |
-2.23512 |
-2.21977 |
-2.23028 |
| 28 |
-1.90309 |
-2.10829 |
-2.10965 |
-1.98195 |
| 32 |
-1.81954 |
-1.5695 |
-1.55186 |
-1.83861 |
| 40 |
-4.11394 |
-4.50376 |
-4.50658 |
-3.67317 |
| 41 |
-3.74819 |
-3.6038 |
-3.57843 |
-3.08524 |
| 42 |
-3.87506 |
-4.24481 |
-4.26667 |
-3.8697 |
| 43 |
-3.07918 |
-3.45189 |
-3.42755 |
-3.07001 |
| 44 |
-4.20412 |
-4.0581 |
-4.07629 |
-3.6975 |
| 47 |
-4.41497 |
-3.57311 |
-3.65577 |
-4.41352 |
| 50 |
-0.60206 |
-1.25884 |
-1.32248 |
-1.07435 |
| 54 |
-2.04139 |
-2.08956 |
-2.07175 |
-2.09358 |
| 56 |
-2.30103 |
-2.50192 |
-2.44482 |
-2.75747 |
| 58 |
-3.60206 |
-3.61607 |
-3.58436 |
-3.5861 |
| 66 |
-2 |
-2.1965 |
-2.20884 |
-1.95013 |
| 67 |
-2.38021 |
-2.0959 |
-2.11067 |
-1.78434 |
Table 5: Actual and predicted IC50 values of training dataset of MLR, PLS and ANN.
| Compound Name |
Actual activity
-log IC50 (nM) |
Predicted activity(nM) |
| MLR |
PLS |
NN |
| 11 |
-2.90309 |
-2.62523 |
-2.61615 |
-2.59964 |
| 17 |
-2.43933 |
-1.72008 |
-1.76003 |
-1.35829 |
| 31 |
-2.4843 |
-1.53184 |
-1.4908 |
-2.19569 |
| 46 |
-3.17609 |
-2.43878 |
-2.51216 |
-3.49899 |
| 57 |
-3.63347 |
-2.81384 |
-2.73486 |
-2.88402 |
| 74 |
-1.27875 |
-1.60071 |
-1.60129 |
-1.41886 |
Table 6: Actual and predicted IC50 values of test set of MLR, PLS and ANN.
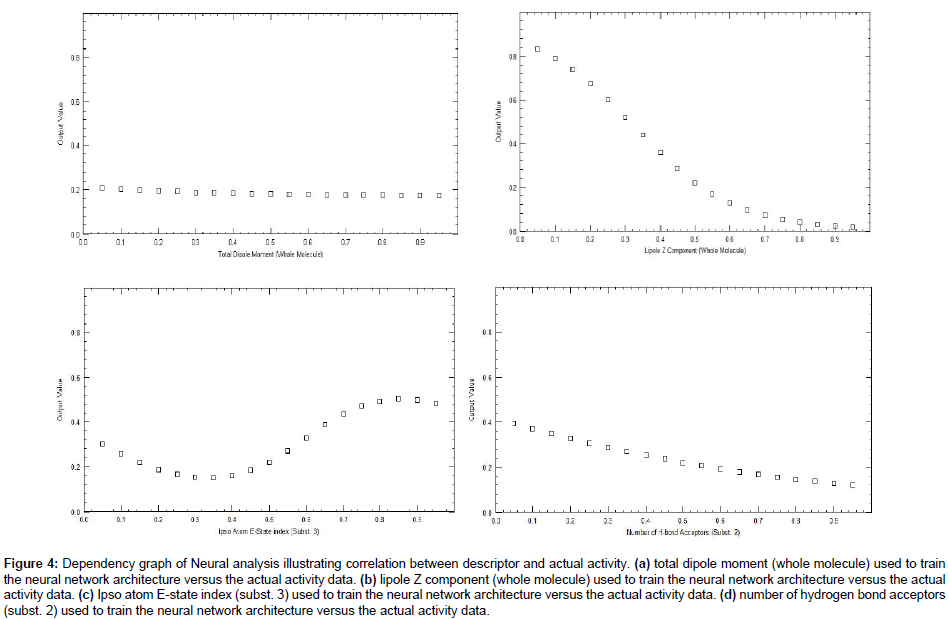
Figure 4: Dependency graph of Neural analysis illustrating correlation between descriptor and actual activity. (a) total dipole moment (whole molecule) used to train the neural network architecture versus the actual activity data. (b) lipole Z component (whole molecule) used to train the neural network architecture versus the actual activity data. (c) Ipso atom E-state index (subst. 3) used to train the neural network architecture versus the actual activity data. (d) number of hydrogen bond acceptors (subst. 2) used to train the neural network architecture versus the actual activity data.
Descriptor Importance
This study revealed that descriptor such as Total dipole moment (whole molecule), Lipole z component of the whole molecule and hydrogen bond acceptor (subst. 2) is negatively correlated with biological activity and Ipso atom E-state index (subst. 3) is positively correlated with biological activity (Table 7).
| |
Name of Compound |
Biological activity (IC50 (µM)) |
Total dipole moment (Whole molecule) |
Lipole z component (whole molecule) |
Ipso atom E-state (sust.3) |
Hydrogen bond acceptor (subst. 2) |
| Active Compounds |
50 |
-0.60206 |
1.8011 |
-4.1738 |
1.6788 |
0 |
| Inactive Compounds |
47 |
-4.415 |
2.1342 |
1.2811 |
1.6344 |
1 |
Table 7: Correlation of biological activity of active and inactive molecules with all four descriptors.
Total dipole moment (whole molecule)
Total dipole moment describes favorable electronic interactions of the drug molecule and active site [22]. Biological activity increases as the total dipole moment of whole molecule decreases. It was explained by the values of most active compound 50 and least active compound 47. The value of the total dipole moment decreases in most active compound (1.80) as compared to the value (2.13) of least active compound 47. This result concludes that the biological activity is increasing as the total dipole moment of whole molecule decreases.
Lipole z component (whole molecule)
Lipole z component measures the lipophilic distribution along the axis defined by the bond to the point of attachment [23]. Biological activity increases as the lipophilic distribution of whole molecule decreases. The small value of lipole z values indicates a less distribution of lipophilic groups distant from the point of attachment. The present study revealed that the most active compound 50 with showed minimum value (-4.17) of the lipole z component as compared to the value (1.28) of least active 47 compound.
Ipso atom E-state (subst. 3)
Ipso atom of E-state is topological descriptor which explains the steric property of molecule and non-covalent intermolecular interactions [24]. Biological activity increases, as the ipso atom of E-state (subst. 3) increases. The value of most active compound (50) is more (1.67) as compared to the value (1.63) of least active (47) compound.
Hydrogen bond acceptor (subst. 2)
Hydrogen bond acceptor [25] (subst. 2) is negatively correlated with biological activity. So as we increase the number of hydrogen bond acceptor group on subst. 2 the biological activity of PDE-5 decreases.
Conclusions
The QSAR model MLR, PLS and ANN were employed to study the PDE-5 inhibitory activity of Tetracyclic Guanine inhibitor derivatives. The aim of the present study was to build QSAR models, which provide good intercorreleation between biological activity and physiochemical parameters with good predictive ability. The linear regression model was found to be statistically valid, and the PLS technique investigated the effects of each descriptor in the model. The nonlinear ANN models confirmed the importance of descriptors. The model described that the overall PDE-5 inhibition can be achieved by decreasing the total dipole moment of the whole molecule, lipophilicity of whole molecule and hydrogen bond acceptor of substitution 2. Better PDE-5 inhibition can also be achieved by increasing the steric property of substitution 3 which may enhance the binding affinity of PDE-5 inhibitor to their receptor. may be helpful in the design of the potent and selective PDE-5 inhibitors which may be potent compounds of clinical utility. In summary, the findings of the present study may be helpful in identifying druggable potent PDE-5 inhibitors which could be raised into potential antihypertensive drugs.
Acknowledgements
We are grateful to Prof. Aditya Shastri, Vice Chancellor, Banasthali University, India for providing necessary computational facilities for the study.
16113
References
- Zaccolo M, Movsesian MA (2007) cAMP and cGMP Signaling Cross-Talk: Role of Phosphodiesterases and Implications for Cardiac Pathophysiology. Circ Res 100: 1569-1578.
- Kotera J, Sasaki T, Kobayashi T, Fujishige K, Yamashita Y, et al. (2004) Subcellular Localization of Cyclic Nucleotide Phosphodiesterase Type 10A Variants, and Alteration of the Localization by cAMP-dependent Protein Kinase-dependent Phosphorylation. The Journal of Biological Chemistry 279: 4366-4375.
- Kukreja RC, Salloum FN, Das A, Koka S, Ockaili RA, et al. (2011) Emerging new uses of phosphodiesterase-5 inhibitors in cardiovascular diseases. Experimental and Clinical Cardiology 16: e30-e35.
- Sopory S, Balaji S, Srinivasan N, Visweswariah SS (2003) Modeling and mutational analysis of the GAF domain of the cGMP-binding, cGMP-specific phosphodiesterase, PDE5. FEBS Letters 539: 161-166.
- Kukreja RC (2007) Cardiovascular protection with sildenafil following chronic inhibition of nitric oxide synthase. British Journal of Pharmacology 150: 538-540.
- Ferguson JE, Carson CC (2013) Phosphodiesterase type 5 inhibitors as a treatment for erectile dysfunction: Current information and new horizons. Arab Journal of Urology 11: 222-229.
- Barnett CF, Machado RF (2006) Sildenafil in the treatment of pulmonary hypertension. Vascular Health and Risk Management 2: 411-422.
- Cumming JG, Davis AM, Muresan S, Haeberlein M, Chen H (2013) Chemical predictive modelling to improve compound quality. Nature Reviews Drug Discovery 12: 948-962.
- Ahn HS, Bercovici A, Boykow G, Bronnenkant A, Chackalamannil S, et al. (1997) Potent Tetracyclic Guanine Inhibitors of PDE1 and PDE5 Cyclic Guanosine Monophosphate Phosphodiesterases with Oral Antihypertensive Activity. Journal of Medicinal Chemistry 40: 2196-2210.
- Gandhi N (2006) 3D QSAR analysis of oxazolidinone antibacterials: can we predict? ARKIVOC 16: 109-121.
- Kajle S, Sikarwar AK, Sharma RK, Dixit S, Rodge D (2012) A QSAR Study of 2-Amino Acetic Acid & Its Derivatives with Randic Connectivity & Balaban Index. Asian Journal of Biochemical and Pharmaceutical Research Issue 2: 80-89.
- Paliwal SK, Pandey A, Paliwal S (2011) Quantitative Structure Activity Relationship Analysis of N-(mercaptoalkanoyl)- and [(acylthio)alkanoyl] Glycine Derivatives as ACE Inhibitors. American Journal of Drug Discovery and Development 1: 85-104.
- Paliwal S, Narayan A, Paliwal S (2009) Quantitative Structure Activity Relationship Analysis of Dicationic Diphenylisoxazole as Potent Anti-Trypanosomal Agents. QSAR Combinatorial Science 28: 1367-1375.
- Ojha LK, Chaturvedi AM, Bhardwaj A, Thakur M, Thakur A (2013) QSAR Analysis of Some TIBO Derivatives as HIV-1 Reverse Transcriptase Inhibitors. International Research Journal of Pure & Applied Chemistry 3: 417-427.
- Sen S, Sarker K (2012) 2D QSAR Study of Some Inhibitors of Ehrlich Ascites Carcinoma. International Journal Pharmaceutical Sciences Review and Research 15: 102-107.
- Ghasemi G, Arshadi S, Nemati A (2013) QSAR Investigation on Quinolizidinyl Derivatives in Alzheimer’s Disease. Journal of Computational Medicine 2013: 1-8.
- Nejad ZG, Saneie F (2010) QSAR Study of Benzimidazole Derivatives Inhibition On Escherichia Coli Methionine Aminopeptidase. Bulletin of the Chemical Society of Ethiopia 24: 317-325.
- Sutariyaa VK, Grosheva A, Sadanab P, Bhatia D, Pathaka Y (2013) Artificial Neural Network in Drug Delivery and Pharmaceutical Research. The Open Bioinformatics Journal 7: 49-62.
- Zou C, Zhou L (2007) QSAR study of oxazolidinone antibacterial agents using artificial neural networks. Molecular Simulation 33: 517-530.
- Hmammouchia R, Taghkia AI, Larifb M, Adada A, Abdellaouic A, et al. (2013) Combining DFT and QSAR result for predicting the biological activity of the phenylsuccinimide derivatives. Journal of Chemical and Pharmaceutical Research 5: 45-56.
- Dooil K, Suk-In H, Dae-Sil L (2006) Triazoloquinazolines as Human A3 Adenosine Receptor Antagonists: A QSAR Study. International Journal of Molecular Sciences 7: 485-496.
- Ding XH (2009) 2D-QSAR studies on the norcantharidin analogues as protein phosphatase 1 and 2a inhibitors. Chinese Journal of Structural Chemistry 28: 621-627.
- Paliwal S, Sharma J, Paliwal S (2012) Quantitative structure activity relationship analysis of bisbenzofuran cations as antimalarial agents employing multivariate statistical approach. Indian Journal of Chemistry 51B: 617-630.
- Osoda T, Miyano S (2011) 2D-Qsar for 450 types of amino acid induction peptides with a novel substructure pair descriptor having wider scope. Journal of Cheminformatics 3: 2-9.
- Katritzky AR, Fara DC, Petrukhin RO, Tatham DB, Maran U, et al. (2002) The present utility and future potential for medicinal chemistry of QSAR/QSPR with whole molecule descriptors. Current Topics in Medicinal Chemistry 2: 1333-1356.


