Keywords
Dengue virus; DENV D etection; PCR; SYBR Green; Serotyping
Introduction
Dengue fever arthropod-borne disease is transmitted by Aedes and caused by dengue virus (DENV), a member of the Flavivirus genus and Flaviviridae family. Dengue fever is currently one of the most important epidemics since it threatens 40% of the world's population who live in high risk areas. Every year, 50 to 100 million cases of Dengue fever are reported worldwide, with 12,500 deaths [1-5].
At present, Brazil faces 3 simultaneous epidemics caused by the Zika virus (ZIKV), Chikungunya virus (CHIKV) and DENV, in addition to some cases of sylvan yellow fever virus (YFV) infections, all of which are transmitted by the Aedes aegypti mosquito. In this context, the clinical and epidemiological diagnoses of these diseases are difficult since their symptoms are very much alike [6].
A definitive diagnosis of DENV infection depends on isolating the virus and detecting antigens or viral RNA [11]. There are 4 dengue serotypes (DENV1-4), which are genetically similar and share approximately 65% of their genomes. This diagnostic test takes time, making medical decisions difficult. An accurateand urgent dengue diagnosis is also essential for adequate epidemiological control by the Disease Control Measures Program [7,8]. The most efficient approach to confirm the presence of arboviruses is through molecular diagnostics. The World Health Organization recommends the use of genomic detection methods for DENVs for laboratory confirmation of the virus during the five to six days after the onset of symptoms [9,10]. PCR-based techniques, such as polymerase chain reaction (PCR) and reverse transcription PCR (RT-PCR) are suitable tools for the identification and determination of different dengue serotypes during the acute period of the disease [11,12]. In general, accurate PCR results using this protocol are incompatible with inexpensive enzyme kits, which led to a search for cheaper ways to detect DENV 1-4 since Brazil faces a scarcity of economic resources and the dengue outbreak cannot be ignored.
Chien et al. [13] reported assessing the performances and advantages of 4 standard semi-quantitative PCR assays for the detection of dengue virus RNA in clinical samples. They upgraded a C-prM protocol, first described by Lanciotti, et al. [14] through the modification of the DENV consensus D1 (mD1) and serotypespecific TS2 (mTS2) primers and redesigned the serotype-specific TS1 (rTS1) and TS4 (rTS4) primers. The authors concluded that the newly established C-prM protocol was the most sensitive method to detect and quantify dengue serotypes [15].
Our work establishes a new method and alternative approach for serotyping dengue virus with more specific set of oligonucleotides designed near the region described by the Chien et al. [16]. We propose an experimental procedure using semi-quantitative nested PCR using a less expensive enzyme and a quantitative PCR (qPCR) method using SYBR Green. To validate the DENV detection method, assays were performed to ensure specificity and sensitivity with regard to five amplicons of standard virus samples obtained from infected Vero cell cultures.
Material and Methods
Oligonucleotide design
A representative sequence in NCBI from each virus was used for the development of the primers; specifically, DENV-1 (Hawaii), DENV-2 (16681), DENV-3 (H87), DENV- 4 (H241), Japanese encephalitis virus (Sa14-14-2), St. Louis encephalitis virus (MSI- 7), West Nilevirus (NY99), YFV (17D) and ZIKV (MR766) were used. These sequences were aligned using the Clustal W tool on the website (https://www.genome.jp/tools/clustalw/) to design adequate DENV primers. This step was followed by a second alignment using only DENV sequence regions similar to those described by Lanciotti et al. [17] to design general and specific primers. Based on the DENV1-4 alignment, it was possible to determine the best primer sequences following the guidelines described by Thornton and Basu, (2011). In order to check if designed primer positions are conserved in DENV virus sequences in C-prM region, we first searched the nucleotide NCBI database using keyword expression: "Dengue virus"[porgn: _txid12637] AND genome NOT partial NOT nearl”. It was found 4,089 complete genome sequences of DENV1-4. These sequences were joined in a file named dengue_genomes.fasta. As a second step, we used the emboss primersearch tool locally to search the DNA database (dengue_genomes.fasta) for match with the sets of specific primers for DENV1-4, separately. Primers (DENV1=STD1/rTS1; DENV2= STD2/mTS2; DENV3=STD3/TS3 and DENV4=STD4/rTS4)
Preparation of viruses
In this work, the four DENV serotypes, as well as ZIKV and YFV were used. All viruses (MOI=0.02) were grown in African green monkey kidney (Vero) epithelial cells that were initially grown in 25 cm2 plastic culture bottles, followed by passaging in a 750 cm2 roller bottle system and were incubated at 37°C for 7 days until observation of cytopathic effects. The supernatants of each DENV serotype were removed, centrifuged, aliquoted and stored at -80°C. Subsequently, viruses were titrated by the plaque method as described and by Putnak et al. (1998) with modifications and were cultured at 37°C with 5% CO2 in Dulbecco's modified Eagle's medium (DMEM; Invitrogen Carlsbad, CA, USA), supplemented with 2.5% fetal bovine serum (Gibco-Invitrogen, Carlsbad, CA, USA), 100 units/mL penicillin and 100μg/mL streptomycin [18]. These DENV (1-4) samples were used for the positive standards.
Viral RNA extraction and cDNA synthesis
Total RNA was extracted from 200 μL of viral supernatants using the TRIzol method (Invitrogen, Carlsbad, CA, USA) according to the manufacturer's instructions, followed by elution in 25 μL of nuclease-free water. The viral RNA concentrations were estimated at 260 nm using a SmartSpec spectrophotometer (Bio- Rad, Hercules, CA, USA). For the DNase treatment, 8 μL of the viral RNA sample, 1 μLof DNase I 10x buffer and 1 μM RNase-free DNase (Fermentas, Burling, Canada) were incubated for 30 min at 37°C following the manufacturer’s instructions. The reactions were stopped with 50 nmol of ethylenediaminetetraacetic acid at 65°C for 10 min. The cDNA was then synthesized from the DNase-treated mRNA using a High-Capacity cDNA Reverse Transcription Kit (AppliedBiosystems, Foster City, CA, USA) according to the manufacturer's protocol. Afterwards, the cDNA concentrations were estimated at 260 nm [19] using a SmartSpec spectrophotometer (Bio-Rad, Hercules, CA, USA).
Semi-quantitative nested PCR
DENV serotyping by semi-quantitative nested PCR involves two amplification reactions of the target sequence, similar to that described by Lanciotti et al. [7] In the first step, a 10 μL reaction mix containing 1 μL of cDNA, 100 nmol of the STD and D2 primers and Phusion high-fidelity DNA polymerase Kit reagents (ThermoFisher, Waltham, MA, USA) were added according to the manufacturer's protocol. Amplification involved the following steps: an initial denaturation and activation of the Phusion DNA polymerase at 98°C for 3 min, followed by 35 cycles of 98°C for 5 s, 55°C for 5 s, 72°C for 20 s, and a final extension for 10 min at 72°C. In the second step, the high efficiency Phusion high-fidelity DNA polymerase (ThermoFisher, Waltham, MA, USA) was used with HF buffer containing 1μL of the above reaction product and 50 nmol of one set of primers (STD1/rTS1; STD2/mTS2; STD3/TS3 and STD4/rTS4) in a 20 μL reaction volume. Amplification involved the following steps: an initial denaturation and activation of the Phusion DNA polymerase at 98°C for 3 min; followed by 25 cycles of 98°C for 10 s, 55°C for 10 s, 72°C for 30 s; and a final extension for 10 min at 72°C. Following the amplification, a 10μL aliquot of each amplicon product was analyzed by 1.5% agarose gel electrophoresis and the DENV serotypes were determined by the specific size amplicon as presented in Table 1.
| Name of Primers and gene region |
SequencePRIMERSa |
Specific viral |
Set of primers |
Size (pb) |
| C-prM |
|
|
|
|
| STDc |
TTTATTTAGAGAGCAGATCTCTG |
DENV-all (F) |
STD-D2 |
572 |
| D2b |
TTGCACCAACAGTCAATGTCTTCAGGTTC |
DENV-all (R) |
| STD1c |
ACGGGTCGACCGTCTTTCAA |
DENV-1 (F) |
STD1-rTS1 |
225 |
| rTS1b |
CCCGTAACACTTTGATCGCT |
DENV-1 (R) |
| STD2c |
GCGAAAAACACGCCTTTCAA |
DENV-2 (F) |
STD2-mTS2 |
140 |
| mTS2b |
CGCCACAAGGGCCATGAACAGTTT |
DENV-2(R) |
| STD3c |
ACGGGAAACCGTCTATCAA |
DENV-3 (F) |
STD3-TS3 |
302 |
| TS3b |
TAACATCATCATGAGACAGAGC |
DENV-3 (R) |
| STD4c |
GTGGTTAGACCACCTTTCAA |
DENV-4 (F) |
STD4-rTS4 |
282 |
| rTS4b |
TTCTCCCGTTCAGGATGTTC |
DENV-4 (R) |
| C-prM |
|
|
|
|
| STDc |
TTTATTTAGAGAGCAGATCTCTG |
DENV-all (F) |
STD-rmD1 |
89 |
| rmD1c |
CGGTTTCTCTCGCGTTTCAGCATATTGA |
DENV-all (R) |
a. The position of the genome is based on Dengue virus type 3.
b. Primers developed by Lanciotti et al.1992 and Chien et al. 2006.
c. Primers developed in this study.
Table 1 Characteristic of Dengue virus primers in the C-prM gene for the SYBR Green assay protocol.
Synthesis and extraction of plasmids
Amplicons generated with the STD and D2 primers for each DENV serotype, all of which were 572 bp, were cloned using the pGEM-T Easy I vector system (Promega, Fitchburg, WI, USA) following the manufacturer’s instructions. The plasmid containing each amplicon product was transformed into the bacterium Escherichia coli (E. coli) strain DH5-α by heat shock, incubating the cells with plasmids for 30 min at 4°C, followed by a 90 s heat shock at 42°C, then a 10 min rest at 4°C. Then, the transformed E. coli was placed in 800 μL of Luria-Bertani (LB) broth (LB Broth Ultrapure, Affymetrix Inc., Cleveland, OH, USA) made according to the manufacturer's protocol and incubated in a shaker for 1 hour at 37°C at 100 rpm. After this incubation, the bacterial suspension was plated onto solid LB agar (Ultrapure, Affymetrix Inc., Cleveland, OH, USA) containing 100 μg/mL ampicillin and made according to the manufacturer's protocol. The resulting colonies were screened by colony PCR using the T7 and SP6 primers. Positive colonies were grown in liquid lysogeny broth containing 100 μg/mL ampicillin at 37°C overnight, as described by Figueira-Mansur et al. [20].
Quantitative PCR (qPCR)
For the qPCR amplification, the viral cDNA of each serotype and the primer sets (STD1/rTS1; STD2/mTS2; STD3/TS3 and STD4/rTS4) were separately used for the identification of DENV serotypes. In each protocol, the Power SYBR Green Mix (Applied Biosystems, Foster City, CA, USA) was used following the reaction conditions and post-amplification analysis recommended by the manufacturer. Primers for the four serotypes (DENV1=STD1/ rTS1; DENV2=STD2/mTS2; DENV3= STD3/TS3 and DENV4=STD4/ rTS4) were used separately in each well of a qPCR plate. The reactions had final volumes of 15 μL, and contained 5 μL of cDNA in several dilutions, 2.5 μL of each primer set (400 nmol) and 7.5 μL of reaction mixture. Amplification involved the following steps: 50°C for 2 min; 95°C for 10 min; and 40 cycles of 94°C for 30 s, 50°C for 30 s, 72°C for 60 s. Since the SYBR Green may nonspecifically intercalate into double-stranded DNA during PCR, a melting temperature (Tm) curve analysis was performed to confirm the identity of the amplified product through its specific Tm profile (Morrison et al., 1999). The analyses of the Tm curves included in the qPCR utilized the following steps: a denaturation at 94°C for 1 m followed by 78.5°C for 10 s and a ramp to 94°C at a rate of 0.1°C/10 s with continuous fluorescence measurement.
Data analysis (absolute quantification)
After amplification by the qPCR assay, data acquisition from a CFX96 Touch Real-Time PCR Detection System (Bio-Rad Laboratories, Hercules, Calif., USA) was performed. A standard curve using cDNA obtained from infected cells (DENV1-4) and others with cloned plasmid DNA sequences (copy number) were correlated to threshold cycle (CT). The CT is defined as the cycle at which a statistically significant increase in Rn (normalized reporter signal) is first detected. The target cDNA or copy number of the cloned plasmid and the CT value are inversely related [21]. The calibration curves of the copy number obtained from plasmid samples were correlated with the CT values, and then these values were used with the cDNA samples of each corresponding virus to quantify the genetic material, thus relating the number of copies of DENV1-4 present in the cDNA to the CT value.
For the statistical analyses, the CT values were exported to a Microsoft Excel worksheet. Regression analyses of the CT values of the cDNA samples or cloned plasmid serial dilutions were used to determine the amplification efficiencies and sensitivity of the method [22].
Results
Standard nested PCR normalization
To standardize the PCR, the primers were first designed according toinitial criteria. Then, the C-prM gene region of each DENV serotype was selected because it shows points of genomic consensus inside a large region of low similarity [23]. An alignment of some Flaviviruses was performed to check the design of the primers to ensure that only DENV1-4 and no other Flaviviruses would be amplified (data not shown). For the conserved region of the DENVs, one pair of primers was designed to identify a region that was common to all DENVs to be used for a semi-quantitative nested PCR. Four pairs of primers were designed inside of the common region of each DENV1-4 sequence for the detection of viral genomic material. In Figure 1, the alignment of partial sequences of DENV serotypes is shown, with forward and reverse primers highlighted, the last of which were also used by Chien et al. [24] to identify common and specific regions of DENV 1-4. Aiming to check if the designed primer positions are conserved in DENV1-4 sequences, we used primersearch tool as described in Material and Methods. In theoretical match analysis, all DENV serotypes primer sets were specific until an error rate of at least 20%. DENV 1 and 4 with sequences of dengue genome fasta database (4,089 complete sequences), matched only with DENV1 and 4, respectively, and their genetic variants with an error of 20% (data not shown). This result suggests that these sets of primers are specific to detect of DENV 1 and 4. In the analysis for the set of primers to detect DENV 2 and 3, the results were even better, only DENV2 and 3, respectively, and their genetic variants were matched considering an error of 30% (data not shown). The matching analysis above showed that the set of primers designed, in this work, was accurate to detect DENV1-4. The Table 1 shows the sets of primers with all the characteristics of each DENV serotype.
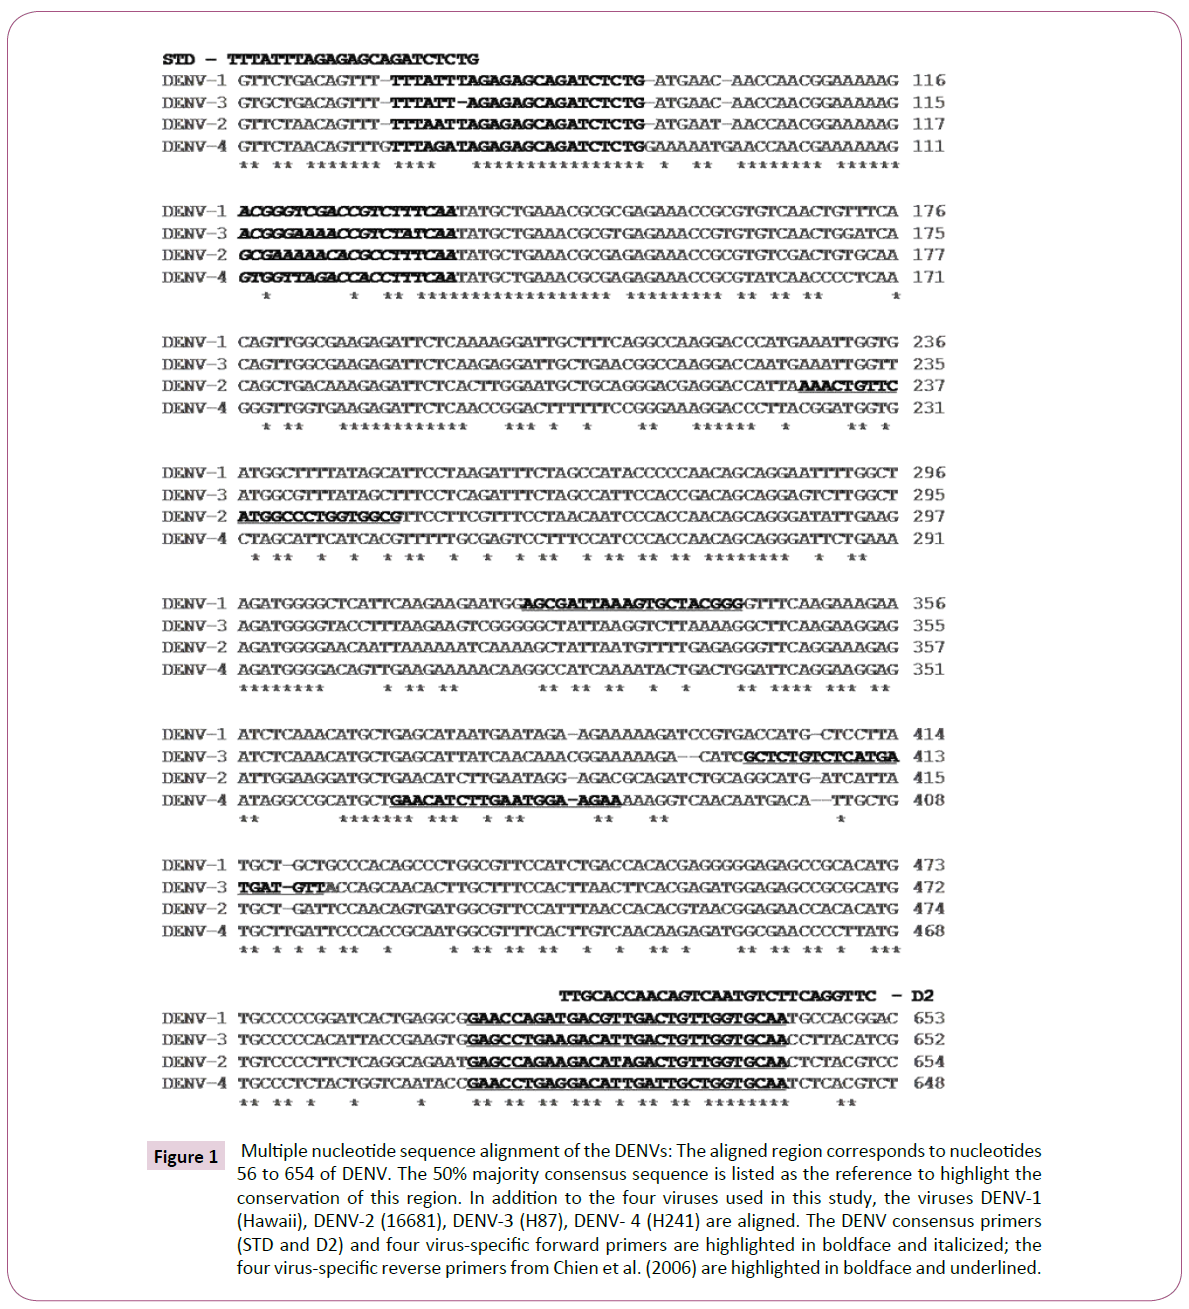
Figure 1: Multiple nucleotide sequence alignment of the DENVs: The aligned region corresponds to nucleotides 56 to 654 of DENV. The 50% majority consensus sequence is listed as the reference to highlight the conservation of this region. In addition to the four viruses used in this study, the viruses DENV-1 (Hawaii), DENV-2 (16681), DENV-3 (H87), DENV- 4 (H241) are aligned. The DENV consensus primers (STD and D2) and four virus-specific forward primers are highlighted in boldface and italicized; the four virus-specific reverse primers from Chien et al. (2006) are highlighted in boldface and underlined.
Upon determination of the viral titer, aliquots containing 200 μL of each DENV serotype were subjected to viral RNA extraction, from which cDNA was subsequently synthesized and used for conventional nested PCR using the primers in Table 1, as described in Material and Methods. Figure 2 shows that each specific pair of primers for the DENV serotypes amplified one single PCR product corresponding to each viral serotype cDNA using this semi-quantitative method.
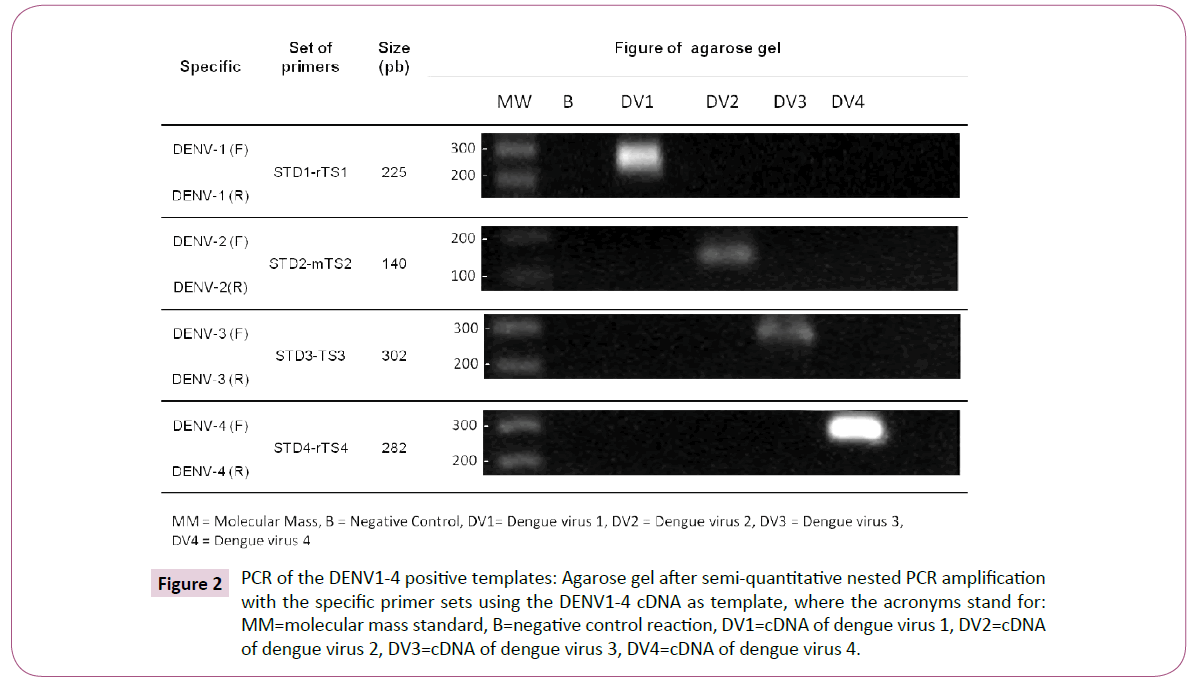
Figure 2: PCR of the DENV1-4 positive templates: Agarose gel after semi-quantitative nested PCR amplification with the specific primer sets using the DENV1-4 cDNA as template, where the acronyms stand for: MM=molecular mass standard, B=negative control reaction, DV1=cDNA of dengue virus 1, DV2=cDNA of dengue virus 2, DV3=cDNA of dengue virus 3, DV4=cDNA of dengue virus 4.
Quantification and analytical sensitivity of SYBR green using plasmid DNA as template
For sensitivity analyses and PCR quantification using SYBR Green, the serially diluted plasmids of DENV1-4 were used as template and amplified using each specific primer set (STD1/rTS1; STD2/ mTS2; STD3/TS3 and STD4/rTS4). Dilution series of the plasmid standards contained 4.54 × 10⁶ copies of DENV-1, 7.29 × 10⁶ copies of DENV-2, 3.38 × 10⁶ copies of DENV-3 and 3.62 × 10⁶ copies of DENV-4. The linear relationship between the starting plasmid DNA and the CT values formed the regression coefficients (R2), which were greater than 0.99 for almost all viruses. The mean values of triplicate CTs ranged from: 11.03 ± 0.045 (4.54 × 10⁶ copies) to 30.73 ± 0.045 (4.54 copies) of DENV-1; 14.87 ± 0.078 (7.29 × 10⁶ copies) 32.79 ± 0.078 (7.29 copies) of DENV-2; 11.58 ± 0.134 (7.29 × 10⁶ copies) 32.75 ± 0.135 (7.29 copies) of DENV-3; and 14.87 ± 0.098 (7.29 × 10⁶ copies) 35.74 ± 0.098 (7.29 copies) of DENV-4, as shown in Figure 3A and Table 2A. Thus, the coefficient of variation was less than 4.0% for DENV1-4, similar to what was described by Dhar et al. [22].
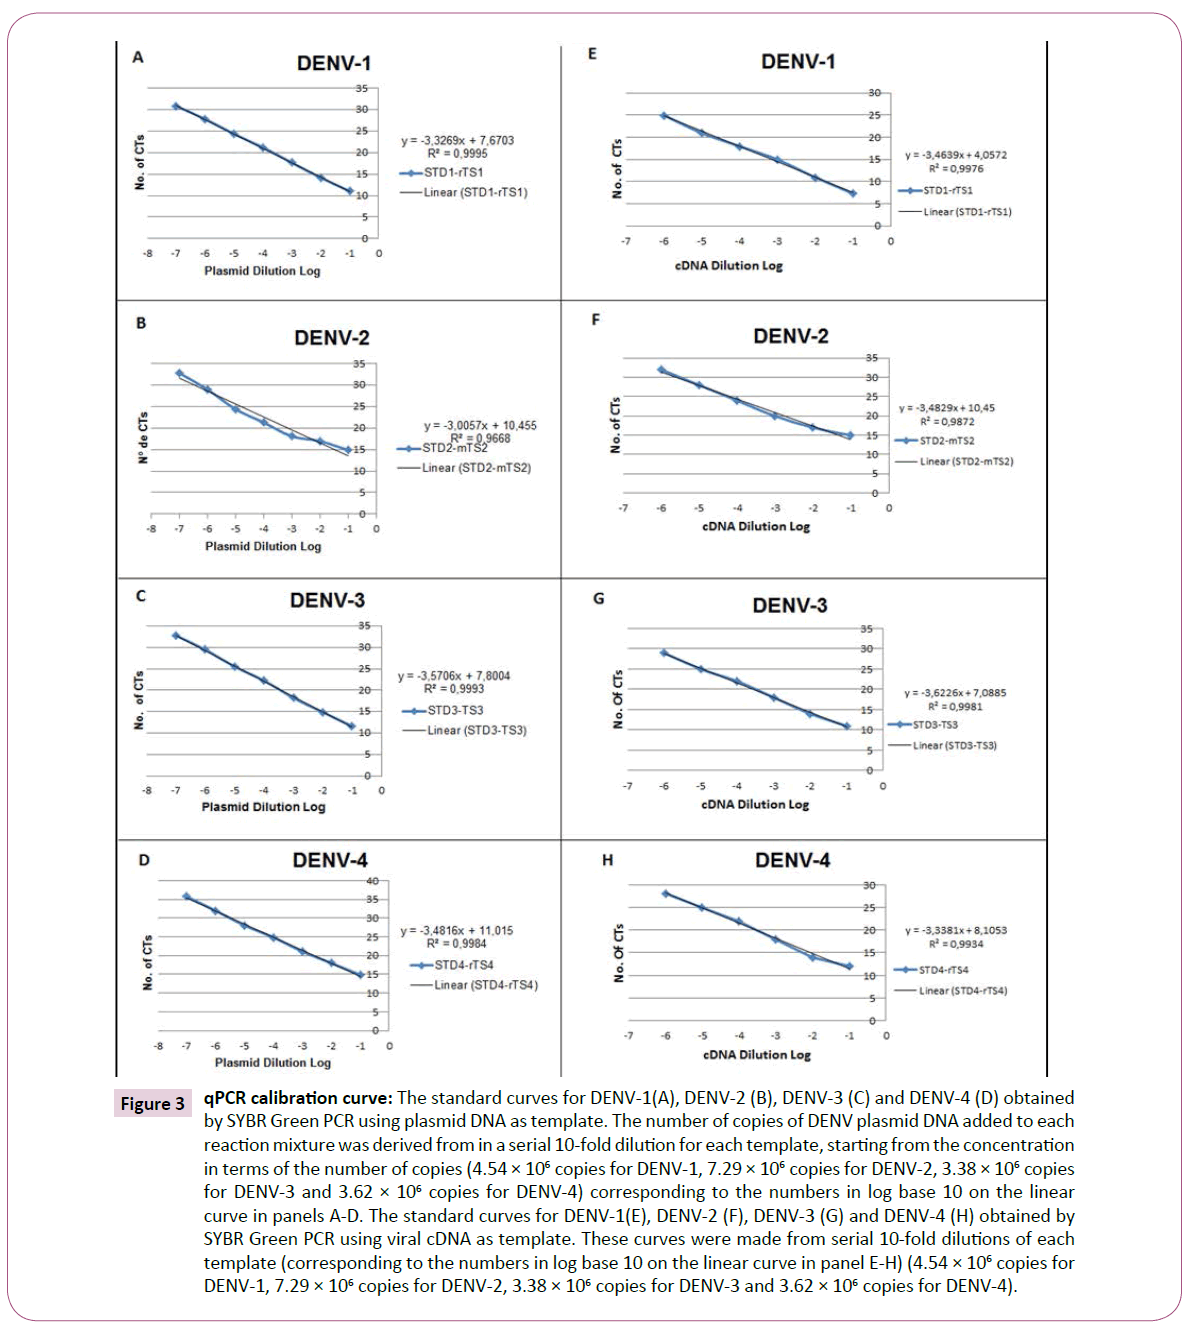
Figure 3: qPCR calibration curve: The standard curves for DENV-1(A), DENV-2 (B), DENV-3 (C) and DENV-4 (D) obtained by SYBR Green PCR using plasmid DNA as template. The number of copies of DENV plasmid DNA added to each reaction mixture was derived from in a serial 10-fold dilution for each template, starting from the concentration in terms of the number of copies (4.54 × 10⁶ copies for DENV-1, 7.29 × 10⁶ copies for DENV-2, 3.38 × 10⁶ copies for DENV-3 and 3.62 × 10⁶ copies for DENV-4) corresponding to the numbers in log base 10 on the linear curve in panels A-D. The standard curves for DENV-1(E), DENV-2 (F), DENV-3 (G) and DENV-4 (H) obtained by SYBR Green PCR using viral cDNA as template. These curves were made from serial 10-fold dilutions of each template (corresponding to the numbers in log base 10 on the linear curve in panel E-H) (4.54 × 10⁶ copies for DENV-1, 7.29 × 10⁶ copies for DENV-2, 3.38 × 10⁶ copies for DENV-3 and 3.62 × 10⁶ copies for DENV-4).
| Dilution positive Viral§ |
Ct mean of the triplicate reaction indicating the serotype and pair of primers used |
No. of copies* |
| DENV-1 |
DENV-2 |
DENV-3 |
DENV-4 |
|
| STD1-rTS1 |
STD2-mTS2 |
STD3-TS3 |
STD4-rTS4 |
| 1:10 |
11.03 |
14.87 |
11.58 |
14.87 |
106 |
| 1:100 |
14.14 |
16.94 |
14.86 |
18.02 |
105 |
| 1:1.000 |
17.64 |
18.09 |
18.21 |
21.09 |
104 |
| 1:10.000 |
21.19 |
21.28 |
22.23 |
24.85 |
103 |
| 1:100.000 |
24.31 |
24.39 |
25.49 |
28.04 |
102 |
| 1:1.000.000 |
27.78 |
28.99 |
29.46 |
32.00 |
101 |
| 1:10.000.000 |
30.76 |
32.79 |
32.75 |
35.72 |
100 |
| H2O |
N/A |
N/A |
N/A |
N/A |
N/A |
*Only values (log) of dilution are presented, because o number copy is calculated from size in nucleotide base Pairs.
§ The viral plasmid was used as a template
Table 2A Performance for the SYBR Green assay using DENV1-4 plasmid fragment and the serotype-specific primers.
Standardization of SYBR green-based qPCR using cDNA
To determine the efficiency of the qPCR assay, cDNAs from the viral serotypes and the specific primers described in Table 1 were used. First, the cDNA was tested using the primers in concentrations ranging from 100-500 nmol for each primer set (STD1/rTS1; STD2/mTS2; STD3/TS3 and STD4/ rTS4), with viral serotype cDNAs diluted 1:10. The primers were used at a concentration of 400 nM, and the cDNAs were used in 10-fold serial dilutions, as described in Table 2B. Then, the analytical sensitivity of the SYBR Green PCR was determined through assessing the linear relationship between the dilutions of the viral cDNA and the CT values presented in Figure 3B. In this analysis, we obtained the regression coefficients (R2), which were greater than 0.99 for almost all viruses. The equations of the lines were calculated, and the slopes obtained were used to determine the efficiency of the SYBR Green reaction using the formula:  where α is the angular coefficient of the line [25]. In this way, the values of amplification efficiencies with the primers sets in the SYBR Green assays were determined, with all values being higher than 90% for all DENV serotypes, as shown in Table 3.
| Dilution of the viral sample |
Ct mean of the triplicate reaction indicating the serotype and pair of primers used |
| DENV-1 |
DENV-2 |
DENV-3 |
DENV-4 |
| STD1/rTS1 |
STD2/mTS2 |
STD3/TS3 |
STD4/rTS4 |
| 1:10 |
7.36 |
14.99 |
10.95 |
11.97 |
| 1:100 |
10.96 |
16.98 |
13.93 |
13.95 |
| 1:1.000 |
14.96 |
19.96 |
17.94 |
17.96 |
| 1:10.000 |
17.97 |
23.96 |
21.94 |
21.95 |
| 1:100.000 |
20.94 |
27.97 |
24.92 |
24.95 |
| 1:1.000.000 |
24.95 |
31.98 |
28.92 |
27.94 |
| H2O |
N/A |
N/A |
N/A |
N/A |
Table 2B Performance for the SYBR Green assay using DENV 1-4 cDNA and the serotype-specific primers.
Specificity of amplification against control viruses
| Viral samples |
Coefficient of angular |
PCR efficiency values (%) |
| DENV-1 |
|
|
| cDNA |
0.996 |
92.6 |
| Plasmid |
0.999 |
100.0 |
| DENV-2 |
|
|
| cDNA |
0.987 |
93.7 |
| Plasmid |
0.974 |
101.1 |
| DENV-3 |
|
|
| cDNA |
0.998 |
91.1 |
| Plasmid |
0.999 |
91.0 |
| DENV-4 |
|
|
| cDNA |
0.989 |
99.3 |
| Plasmid |
0.998 |
94.0 |
Table 3 Coefficient of angular and PCR efficiency values for the SYBR green assay using the primers-specific in the viral cDNA samples and plasmid viral.
To confirm the specificity of each set of primers in the SYBR Green PCR assay, viral cDNA of DENV1-4 from a newly passaged of cultures cell was used with their specific and non-specific sets of primers for detection. Samples of viral ZIKV and YFV cDNA, both also belonging to the Flaviviridae family, were included in the assay. Table 4 shows the means of triplicate CT values corresponding to assays using viral cDNA (1:100) with specific and non-specific primer sets. When amplification was undertaken for DENV1, the DENV1 cDNA sample significantly increased in SYBR Green fluorescence, with a mean CT value of 28.18, where as SYBR Green fluorescence was not detected in the other viral cDNA samples. Likewise, the use of cDNA from DENV2-4 significantly increased in SYBR Green fluorescence, with mean CT valuesof 32.79, 32.90 and 31.28, respectively, for specific viral cDNAs, with no SYBR Green fluorescence detected when other cDNA was tested.
| Sample Viral* |
Ct mean of the triplicate reaction indicating the serotype of DENVs and other Flaviviruses and pair of primers used |
| DENV-1 |
DENV-2 |
DENV-3 |
DENV-4 |
| STD1-rTS1 |
STD2-mTS2 |
STD3-TS3 |
STD4-rTS4 |
| DENV-1 |
28.18 |
N/A |
N/A |
N/A |
| DENV-2 |
N/A |
32.79 |
N/A |
N/A |
| DENV-3 |
N/A |
N/A |
32.90 |
N/A |
| DENV-4 |
N/A |
N/A |
N/A |
31.28 |
| ZIKV |
N/A |
N/A |
N/A |
N/A |
| YFV |
N/A |
N/A |
N/A |
N/A |
| H2O |
N/A |
N/A |
N/A |
N/A |
Table 4 Performance of specificity of the serotype-specific primers in the SYBR Green assay using Dengue Virus 1-4 and other Flavi viruses.
Since the SYBR Green PCR involves no post-PCR analysis, the amplification of specific vs. non-specific products was confirmed by an analysis of the dissociation curves of the target amplicons. The amplification profiles and the dissociation curves for DENV-1, DENV-2, DENV-3, DENV-4, together with negative viral controls of YFV and ZIKV, are shown in Figure 4. In a specific reaction to detect DENV-1, cDNA from the DENV-2, DENV-3 and DENV-4 serotypes was used as a negative control, and a similar strategy was used for all serotypes, as determined for each specific reaction.
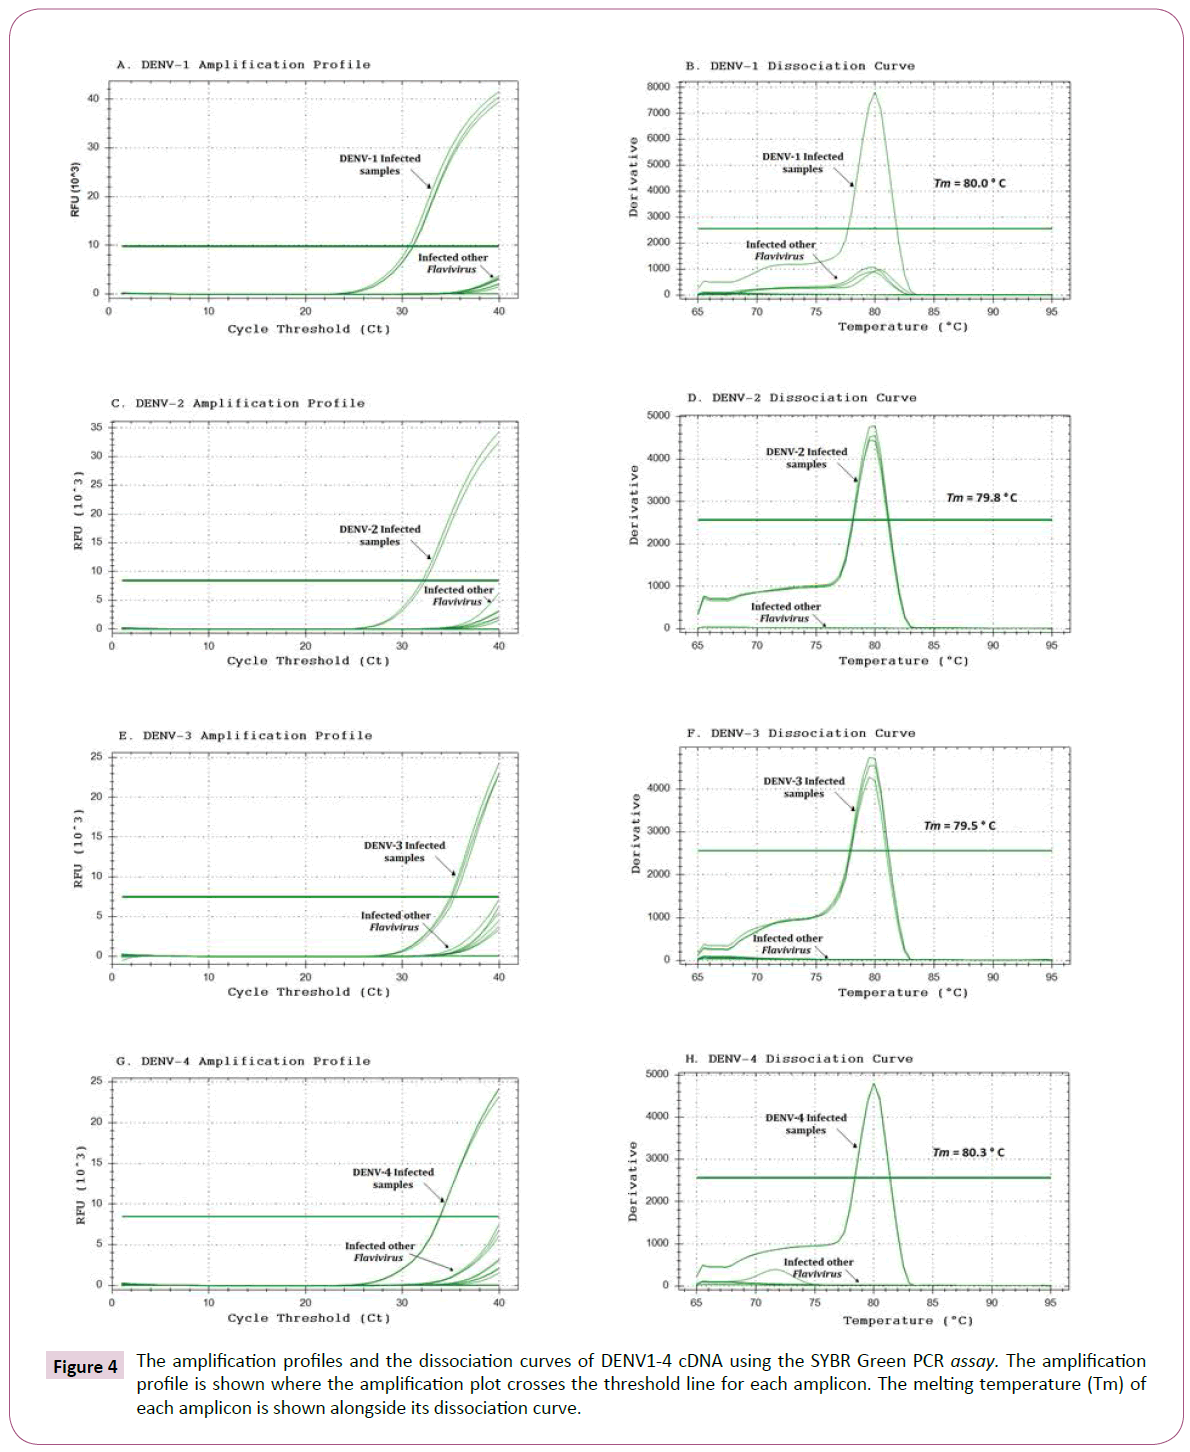
Figure 4: The amplification profiles and the dissociation curves of DENV1-4 cDNA using the SYBR Green PCR assay. The amplification profile is shown where the amplification plot crosses the threshold line for each amplicon. The melting temperature (Tm) of each amplicon is shown alongside its dissociation curve.
In the SYBR Green qPCR analysis to detect DENV-1, the DENV-1 cDNA exhibited a significant increase in the fluorescence of SYBR Green, with a mean CT value of 28.18 (Table 4 and Figure 4A). In addition, the amplification of DENV-2, DENV-3, DENV-4, YFV and ZIKV cDNA did not yield any significant increase in fluorescence, indicating an absence of the specific DENV-1 target. When amplification was performed to detect DENV-2, the DENV-2 cDNA exhibited a significant increase in the fluorescence of SYBR Green, with a mean CT value of 32.79 (Table 4 and Figure 4C). The amplification of DENV-1, DENV-3, DENV-4, YFV and ZIKV cDNA did not significantly increase fluorescence, indicating an absence of the DENV-2 target. When amplification was performed to detect DENV-3, the DENV-3 cDNA recorded a significant increase in the fluorescence of SYBR Green, with a mean CT value of 32.90 (Table 4 and Figure 4E) of DENV-1, DENV-2, DENV-4, YFV and ZIKV cDNA did not generate any significant increase in fluorescence, indicating an absence of the specific DENV-3 target. Likewise, in the amplification performed to detect DENV-4, the DENV-4 cDNA showed a significant increase in the fluorescence of SYBR Green with a mean CT of 31.28 (Table 4 and Figure 4F). Similarly, the amplification of DENV-1, DENV-2, DENV-3, YFV and ZIKV cDNA did not generate any significant increase in fluorescence, indicating the absence of the specific DENV-4 target.
The dissociation curves showed only a single peak at the melting temperature (Tm=80.0°C) expected for the DENV-1 amplicon using the DENV-1 cDNA, but not in the other cDNA samples (Figure 4B). Additionally, only a single peak at the melting temperature (Tm=79.8°C) was found for the DENV-2 amplicon using DENV-2 cDNA, but not in the othercDNA samples (Figure 4D). Similarly, only a single peak at the melting temperature (Tm=79.5°C) was found for the DENV-3 amplicon using DENV-3 cDNA, but no peaks were present in the negative samples (Figure 4F). A single peak was observed at the melting temperature (Tm= 80.3°C) as expected for the DENV-4 amplicon using in the DENV-4 cDNA, but no peaks were present in the negative cDNA samples (Figure 4H).
Discussion
Currently, commercial kits to DENV detection has been used, CDC DENV-1-4-RT-PCR Assay for Detection and Serotype Identification of Dengue Virus kit (CDC DENV1-4 RT-PCR assay kit) to detect DENV was based on the article of Johnson et al. [26]. These authors use for serotype-specific detection of dengue in a four plex Real-Time Reverse Transcriptase PCR Assay. The use CDC DENV-1-4-RT-PCR kit has some good advantage, such as four serotypes can be identified, simultaneously, using 4 different probes and each serotype can be also identified separately using the same probe. But some disadvantages are also observed: first, the cost of the kit is elevated; it needs 3 oligonucleotide primers and 2 of them are fluorogenic probes used in the serotype-specific DENV by RT-qPCR assay. The oligonucleotide primers to identify DENV1-4 were designed in different regions of the genome of each DENV, this fact makes impossible the use of PCR-nested technique. Furthermore, the DENV serotyping is done using Invitrogen 2X PCR Master Mix and Superscript III RT/ Platinum Taq enzyme mix, with elevated cost. In the CDC DENV1- 4 RT-PCR assay kit instruction highlights the sensitivity of the test is another important issue. It was observed that only elevated plaque-forming unit (PFU), approximately 1× 10³- 107, could be correlated with CT values. Although, CT value correlation to 103 pfu/mL of serum is at 36.36, 36.58 and 36.68 for DENV 1, 3 and 4, respectively. According to Johnson et al. [27], a sample determined empirically to be negative if the CT value was >36, allowing the conclusion that the CDC DENV-1-4-RT-PCR kit test has low sensitivity.
Najioullah et al. [28] evaluated four commercial RT-qPCR kits and compared to Lanciotti's gold-standard protocol [18]. All commercial kits use 6-carboxyfluorescein (FAM) probe in TaqMan system. For three of them namely Geno-sen's, Liferiver, Realstar, the target region of virus is not specified and these kits cannot be used for DENV serotyping. Only for the Simplexa kit, the target region of DENV1-4 is known and can be used for serotyping. The authors utilized a panel with 162 laboratory-confirmed samples: 46 DENV-1, 37 DENV-2, 33 DENV-3 and 46 DENV-4. The results showed that no commercial RT-qPCR kits tested showed 100% sensitivity in the detection of all DENV, Geno-sen's sensitivity is 85.2%, Realstar 83.3% and Simplexa 93.2%. On the other hand, Lanciotti's gold-standard protocol is indicated for DENV1-4 serotyping with primers designed in C-prM region [29] redesigned primers to detect DENV1-4 in the same region and showed that C-prM region is indeed more sensitive (100%) than the NS5 (91%) or the 3’NC (91%) protocols to detect DENV.
In recent years, quantitative PCR based on the TaqMan system or SYBR Green assays have been used to detect several RNA viruses in infected plants [30,31], animals [3,7,16,22,27,32,33], human fluids [1,2,4,5,8,10,14,19,20,34,35] among other applications.
Quantitative PCR methods such as the SYBR Green assay and TaqMan detection system have been traditionally used for DENV serotyping to provide a compatible dynamic range and sensitivity. SYBR Green detection was more accurate and yielded a more linear decay graph than the TaqMan detection system [36,37]. In addition to the sensitivity and specificity of the technique described in this work, SYBR Green PCR assay is very fast and robust in nature. The 96-well plate in this work can be used to analyze between 6-10 samples with 2 or 3 replicates if DENV1-4 serotypes were tested on the same plate, using positive and negative controls. It takes about 2 hours to perform a 96- well plate. After amplification, data analysis may take several minutes. In contrast, the TaqMan system detection can be used with multiple fluorogenic probes to detect more than one DENV serotype in the same reaction [15]. Although, the TaqMan assay is much more expensive than the SYBR Green trial [6,7], which corroborates to the use of SYBR Green for testing assays in research laboratories and serological diagnosis in developing countries.
The DENV serotyping protocol adopted by Chien et al. [8] included an expensive approach, a one-step RT-PCR master mix kit and a second reaction with a HotStarTaq master mix, both kits supplied by QIAGEN. Reductions in the operational costs by using a cheaper DNA polymerase enzyme and an increase in the assay sensitivity to detect DENV1-4 were the main motivations for redesigning or modifying the previously established C-prM primer sets [6,18].
In this study, we also chose the C-prM gene region and novel primers were designed to be compatible to cheaper polymerase enzymes for the use in routine of laboratory. We modified the amplicons from an existing protocol for the C-prM junction [6], designing 5 new forward primers to form sets for DENV serotyping. This newly established protocol uses a semi-quantitative nested PCR detection method and a quantitative PCR SYBR Green assay.
To detect all DENVs, we performed a semi-quantitative nested PCR technique (Figure 2). We replaced the forward primer mD1 [6] with the STD primer in the first reaction of the assay. In the second reaction, we also replaced the mD1 [6] forward consensus primer with the more specific forward primers STD1, STD2, STD3 and STD4, one for each DENV sequence, creating a nested PCR assay using Phusion DNA polymerase, a cheaper enzyme than the enzymes described in the literature [6,18,33], thereby increasing the efficiency and reducing the costs of the protocol for DENV serotyping.
To obtain accurate and reproducible results with the new specific forward primers (STD1, STD2, STD3 and STD4) and the reverse primers adopted by Chien et al. [5] to detect DENV1-4, the SYBR Green PCR efficiency was determined, its range should be 90- 110% indicating a doubling of the amplicon at each cycle. Table 3 shows that the PCR efficiency values with the new primer sets (STD1/rTS1; STD2/mTS2; STD3/TS3 and STD4/rTS4) using both viral plasmid and cDNA as templates were higher than the values found in the literature [6], except for DENV2 cDNA, confirming the appropriate design of the new primers for DENV serotyping.
The specificity of the new primer sets to detect DENV1-4 was determined through an analysis of melting temperature curves post-amplification using a SYBR Green assay. A dissociation curve with a single peak at the temperature expected for each amplicon indicated a specific amplification. In Figure 4, the presence of a single peak can be observed for each DENV1-4 cDNA tested, with no peaks appearing using cDNAs from others control flaviviruses. The specificity of the DENV primer set was also confirmed by amplification profiles of the melting dissociation curves of the target products (Figure 4). In a SYBR Green PCR, a sample is considered positive when the amplification plot crosses the threshold line. In the example of (Figure 4A), the amplification profile of the sample infected with DENV-1 can be observed to exceed the threshold line, whereas the amplification profiles of the other viral samples do not reach this threshold line. This parameter represents the baseline of fluorescence detection, that is, the minimum number of cycles for amplification. This value is determined by the software analysis system used. The point at which the sample fluorescence signal is higher than the fluorescence detection/quantification limit, indicates the number of cycles required to initiate the amplification of the gene target sequence present in the DNA of each sample to be determined. This value is called Cycle Threshold (Ct) and allows the relative DNA quantification of each sample after being corrected by the Ct of the gene endogenous control and/or the sample control. The Ct is proportional to the logarithm of the initial amount of expression of the target gene in a given sample. The smaller the initial number of Ct obtained from the target gene in the sample compared to another gene indicates the greater expression.
The real-time RT-PCR described in this study is highly sensitive, and able to detect up to a little above one copy of DENV genome (Figure 4). In SYBR Green PCR, a maximum of 40 cycles (CT=40) is required to detect a single copy of a viral genome (CFX96 Touch Real-Time PCR Detection System, Bio-Rad Laboratories, Hercules, California, USA). A linear relationship between plasmid DNA copies and CT values from 106 up to 3 copies of DENV could be observed. Due to high sensitivity of SYBR Green PCR, it is susceptible to PCR carry over or other contamination. Therefore, good laboratory practices should be followed very strictly to prevent any potential contamination that may give false positive result. In addition, any negative result as well as samples with Ct values close to 36 should be tested at least twice for confirmation. The SYBR Green PCR protocol described here was not only very highly efficient and sensitive, but also showed specificity for the detection of DENV1-4, better than described by Chien et al. [22]. Its specificity was determined by monitoring the amplification profile on the melting dissociation curve of the target products. In SYBR Green PCR reaction, a sample is considered positive when the amplification plot crosses the linear threshold line. As we can see, in the example (Figure 4A) the amplification plot of the sample infected with DENV-1 exceeds the threshold line in the cycle (28.18), whereas the graph of amplification of the negative sample does not. The dissociation curve profile depends on CG bases composition and amplified sequence length, the nonspecific product must be differentiated by examination of the dissociation curve. The fragment amplified for DENV-1 produced a specific dissociation curve exhibiting a single peak at 80.0°C, which is expected for the DENV-1 specific amplification product. Aiming to determine the specificity, quality and efficiency of the reaction, cDNAs from both viral samples were amplified in parallel for each target virus. Using this method, we were able to discriminate each target by its dissociation curve, according to the predicted melting temperature (Tm for DENV-2 was of 79.8°C, Tm for DENV-3 was of 79.5°C and Tm for DENV-4 was of 80.3°C, (Figure 4D, F and H).
The protocols established in this work using the semi-quantitative nested detection method and the quantitative PCR SYBR Green assay with the new primer sets (STD1/rTS1; STD2/mTS2; STD3/TS3 and STD4/rTS4) can be used, independently or concomitantly, for the identification of the DENV serotypes. Therefore, this present manuscript is an upgrade of the Chien et al. [22] paper.
Conclusion
The semi-quantitative nested PCR and SYBR Green PCR techniques described above are important tools in the detection and quantification of the four serotypes of Dengue virus and can be used for detection in mosquito vectors, serum or other human fluids, as well as in tests for dose-responses of antivirals in cell cultures or the determination of viral loads in other types of studies. The SYBR Green quantitative method is fast, highly sensitive, robust, low cost, and easy to reproduce. It is also applicable to routine high-performance testing, making it a powerful tool suitable for third world countries trying to prevent the propagation of DENV by monitoring the epidemiological movement between countries and continents. There is a growing and urgent need to develop more accessible and highly sensitive DENV detection methods such as the methodology described in this study.
Compliance with ethical standards
Conflict of interest
The authors declare that they have no conflict of interest.
Ethical approval
This article does not contain any studies with human participants or animals performed by any of the authors.
Author Contributions
T.S.S., M.R.S., D.F.F and M.F.M designed the experiments. T.S.S., T.E.S.G and D.F.F preparation of viruses. T.S.S, T.E.S.G., D.F.S.S, S.G.L., T.A.F. performed PCR assays. T.S.S., T.E.S.G., E.S.L.A., A.C.A.M., M.R.S. and M.F.M performed database searches, sequence and data analyses. T.S.S., M.R.S. and MFM. wrote the main manuscript. All authors reviewed the manuscript.
Acknowledgements
This study was supported financially by the Conselho Nacional de Desenvolvimento Científico e Tecnológico (CNPq), Instituto Nacional de Ciência e Tecnologia em Entomologia Molecular (INCT-EM/CNPq), Fundação Carlos Chagas Filho de Amparo à Pesquisa do Estado do Rio de Janeiro (FAPERJ) and Coordenação de Aperfeiçoamento de Pessoal de Nível Superior (CAPES). The authors are grateful to Dr. Rafael Dias Mesquita for providing assistance to accomplish this work.
19956
References
- Alm E, Lesko B, Lindegren G, Ahlm C, Soderholm S, et al. (2014) Universal single-probe RT-PCR assay for diagnosis of dengue virus infections. PLoSNegl Trop Dis 8: e3416.
- Alm E, Lindegren G, Falkand KI, Lagerqvist N (2015) One-step real-time RT-PCR assays for serotyping dengue virus in clinical samples. BMC Infectious Diseases 15: 493.
- Boletim Ministério da Saúde Brasil (2016) https://portalarquivos.saude.gov.br/images/pdf/-2017/fevereiro/10/Dengue-classica-ate-2016.pdf
- Bonaldo MC, Ribeiro IP, Lima NS, Menezes LSR, da Cruz SOD, et al. (2016) Isolation of Infective Zika Virus from Urine and Saliva of Patients in Brazil. PLoS Negl Trop Dis 10: e0004816.
- Chao DY, Davis BS, Chang G (2007) Development of Multiplex Real-Time Reverse Transcriptase PCR Assays for Detecting Eight Medically Important Flaviviruses in Mosquitoes. Journal of Clinical Microbiology 45: 584-589.
- Chien LJ, Liao TL, Shu PY, Huang JH, Gubler DJ, et al. (2006) Development of Real-Time Reverse Transcriptase PCR Assays To Detect and Serotype Dengue Viruses. Journal of clinical microbiology 44: 1295-1304. 0095-1137/06/$08.000.
- Dhar AK, Roux MM, Klimpel KR (2002) Quantitative assay for measuring the Taura syndrome virus and yellow head virus load in shrimp by real-time RT-PCR using SYBR Green chemistry. Journal of Virological Methods 104: 69-82.
- Drosten C, Gottig S, Schilling S, Asper M, Panning M, et al.(2002) Rapid detection and quantification of RNA of Ebola and Marburg viruses, Lassa virus, Crimean-Congo hemorrhagic fever virus, Rift valley fever virus, dengue virus, and yellow fever virus by real-time reverse transcription-PCR. J Clin Microbiol 40: 2323-233.
- Figueira MJ, Ferreira PA, Mansur JF, Franco TA, Alvarenga ESL et al. (2013). Silencing of Pâ€ÂÂÂÃÂglycoprotein increases mortality in temephosâ€ÂÂÂÃÂtreated Aedes aegypti larvae. Insect molecular biology 22: 648-658.
- Grywna K, Kupfer B, Panning M, Drexler JF, Emmerich P et al. (2010) Detection of All Species of the Genus Alphavirus by Reverse Transcription-PCR with Diagnostic Sensitivity. Journal of Clinical Microbiology 48: 3386-3387.
- Gubler DJ (1998) Dengue and dengue hemorrhagic fever. Clin Microbio 11: 480-496.
- Harris E, Roberts TG, Smith L, Selle J, Kramer LD et al. (1998) Typing of dengue viruses in clinical specimens and mosquitoes by single-tube multiplex reverse transcriptase PCR. J Clin Microbiol 36: 2634-2639.
- Holmes EC, Twiddy SS (2003) The Origin Emergence and Evolution Genetics of Dengue Virus. Infection Genetics and Evolution 3: 19-28 www.elsevier.com/locate/meegid.
- Houng HS, Chen RCM, Vaughn DW, Kanesa TN (2001) Development of a fluorogenic RT-PCR system for quantitative identification of dengue virus serotypes 1–4 using conserved and serotype-specific 3’ noncoding sequences. J Virol Methods 95:19-32.
- Johnson BW, Russell BJ, Lanciotti RS (2005) Serotype-specific detection of dengue viruses in a fourplex real-time reverse transcriptase PCR assay. J Clin Microbiol 43: 4977-83.
- Komurian PF, Paranhos BG, Sodoyer M, Chevallier P, Mandrand B, et al. (2001) Quantitation of HCV RNA using real-time PCR and fluorimetry. J Virol Meth 95: 111-119.
- Kuno G, Chang GJJ, Tsuchiya KR, Karabatsos N, Cropp CB (1998) Phylogeny of the genus Flavivirus. J Virol 72: 73-83.
- Lanciotti RS, Calisher CH, Gubler DJ, Chang GJ, Vorndam AV (1992) Rapid detection and typing of dengue viruses from clinical samples by using reverse transcriptase-polymerase chain reaction. J Clin Microbiol 30: 545-551.
- Lanciotti RS, Kosoy OL, Laven JJ, Velez JO, Lambert AJ, et al. (2008) Genetic and Serologic Properties of Zika Virus Associated with an Epidemic, Yap State, Micronesia, 2007. Emerging Infectious Diseases 14: 1232-1239.
- Lanciotti RS, Lambert AJ, Holodniy M, Saavedra S, Signor LC (2016) Phylogeny of Zika virus in Western Hemisphere. Emerg Infect Dis 22: 933-935.
- Lee E, Schmittgen TD (2006) Comparison of RNA assay methods used to normalize cDNA for quantitative real-time PCR. Anal Biochem357: 299-301.
- Moody A, Sellers S, Bumstead N (2000) Measuring infectious bursal disease virus RNA in blood by multiplex real-time quantitative RT-PCR. J Virol Meth 85: 55-64.
- Morrison TB, Ma Y, Weis JH, Weis JJ (1999) Rapid and sensitive quantification of Borreliaburgdorferi-infected mouse tissues by continuous fluorescent monitoring of PCR. J Clin Microbiol 37: 987-992.
- Mourão MPG, Bastos MS, Figueiredo RP, Gimaque JBL, Galusso ES (2012) Mayaro Fever in the City of Manaus, Brazil, 2007-2008. Vector-borne and zoonotic diseases 12: 42-46.
- Mukhopadhyay S, Kuhn RJ, Rossmann EMG (2005) A structural perspective of the flavivirus life cycle. Nat Rev Microbiol 3:13-22.
- Najioullah F, Viron F, Cesaire R (2014) Evaluation of four commercial real-time RT-PCR kits for the detection of dengue viruses in clinical samples. Virol J 11: 164.
- Oleksiewicz MB, Donaldson AI, Alexandersen S (2001) Development of a novel real-time RT-PCR assay for quantitation of foot-and-mouth disease virus in diverse porcine tissues. J Virol Meth 92: 25-35.
- Putnak R, Barvir DA, Burrous JM, Dubois DR, D'Andrea VM, et al. (1996) Development of a purified, inactivated, dengue-2 virus vaccine prototype in Vero cells: immunogenicity and protection in mice and rhesus monkeys. The Journal of Infectious Diseases 174: 1176-1184.
- Raengsakulrach B, Nisalak A, Maneekarn N, Yenchitsomanus PT, Limsomwong C, et al. (2002) Comparison of four reverse transcription-polymerase chain reaction procedures for the detection of dengue virus in clinical specimens. J. Virol Methods 105: 219-232.
- Reynes JM, Ong S, Mey C, Ngan C, Hoyer S, et al. (2003) Improved molecular detection of dengue virus serotype 1 variants. J Clin Microbiol 41: 3864-3867.
- Roberts CA., Dietzgen RG, Heelan LA, Maclean DJ (2000) Real-time RT-PCR fluorescent detection of tomato spotted wilt virus. J Virol Meth 88:1-8.
- Shu, PY, Huang JH (2004) Current advances in dengue diagnosis. Clin Diagn Lab Immunol 11: 642-650.
- Thongrungkiat S, Maneekan P, Wasinpiyamongkol L, Prummongkol S (2011) Prospective field study of transovarial dengue-virus transmission by two different forms of Aedes aegypti in an urban area of Bangkok, Thailand. Journal of Vector Ecology 36: 147-152
- Thornton B and Basu C (2011) Real-time PCR (qPCR) primer design using free online software. Biochemistry and molecular biology education 39: 145-154.
- Wang WK, Sung TL, Tsai YC, Kao CL, Chang SM, et al. (2002) Detection of dengue virus replication in peripheral blood mononuclear cells from dengue virus type 2-infected patients by a reverse transcription– real-time PCR assay. J Clin Microbiol 40: 4472-4478.
- WHO. Dengue (2016) Guidlines for Diagnosis, Treatment, Prevention and Control.New edn Geneva WHO 22: 189.
- Zammarchia L, Stella G, Mantellaa A, Bartolozzib D, Tappec D, et al. (2015) Zika virus infections imported to Italy: Clinical, immunological and virological findings, and public health implications. Journal of Clinical Virology 63: 32-35.