Keywords
Bone turnover markers; GGT; Iron metabolism; Fracture; Elderly
Introduction
The interest in gamma-glutamyltransferase (GGT; E.C. 2.3.2.2), a heterodimeric glycosylated protein embedded into outer surface of the plasma membrane of numerous cells and strongly associated with many major non-skeletal diseases[1], in osteology has recently increased considerably owing to several reports. GGT-deficient (GGT-/-) mice exhibit severe osteoporosis caused by decreased osteoblast activity and increased osteoclast number and activity [2]. GGT induces osteoclast formation in vitro [3], accelerates bone resorption causing osteopenia/osteoporosis in transgenic mice [4,5], and increases in urinary excretion of GGT correlate with urinary bone resorption markers in osteoprotegerin (OPG)-deficient osteoporotic mice as well as in postmenopausal osteoporotic women [6]. In older Korean men (>50 years) higher serum GGT levels were associated with incident osteoporotic fractures over a mean 3-year follow-up period [7].
Iron, an essential trace element in all three kingdoms of living organisms, is recognized as an important determinant of bone metabolism [8-10]. However, there is disagreement as to whether iron overload or iron deficiency lead to osteopenia/ osteoporosis and whether the iron-related bone loss is due to reduced bone formation or to increased resorption of bone.
Studies in humans without haematological disorders on relationship between markers of iron metabolism and bone status are scarce and controversial. A significant association between higher serum ferritin level and lower bone mineral density (BMD) was reported in healthy Koreans aged >40 years [11], especially in women ≥45 years of age [12], in postmenopausal Chinese women with fragility fractures [13], and in astronauts during space flights [14], whereas in other studies, increased serum ferritin levels were inversely correlated with BMD (of lumbar spine) only in premenopausal women, but not in postmenopausal women (either at the femur or lumber spine) [15]. No significant association between ferritin levels and osteoporosis has been observed in Turkish postmenopausal women [16]. Italian postmenopausal women with osteoporotic fractures were found to have higher transferrin levels and lower ferritin levels than controls [17] and a positive association between serum ferritin and BMD (in both femoral neck and lumbar spine). A positive ferritin-BMD correlation was also observed in adolescent girls [18] and in elderly Korean men (>65 years) [19]. Furthermore, numerous nutritional studies suggested that iron deficiency, rather than excess, may lead to osteoporosis [10].
Both GGT [20] and iron [21] are implicated in generating oxidative stress, which plays a significant role in bone pathophysiology [22,23], but these relationships remain unclear.
Despite accumulating data suggesting importance of both GGT and iron in bone health, and the central role of liver in iron storage and regulation, no analysis of the potential links between serum GGT activity, markers of iron and bonemineral metabolism in humans has been reported to date. The aim of this study was to examine serum levels of GGT and biomarkers of iron metabolism in relation to parameters of bone and mineral metabolism in elderly patients with and without osteoporotic bone fractures in the absence of overt liver diseases. We simultaneously measured serum levels of two bone formation markers (osteocalcin, OC, and N-terminal propeptide type 1 collagen, P1NP), bone resorption marker (β- isomerised C-terminal cross-linking telopeptide of type I collagen, βCTX), and their ratios (PINP/OC, PINP/βCTX, OC/ βCTX), 25-hydroxyvitamin D (25(OH)D), intact parathyroid hormone (PTH), calcium, phosphate, magnesium in relation to serum GGT activity (and other liver function parameters) and indices of iron metabolism (serum ferritin, iron, transferrin and transferrin saturation).
Materials and Methods
Patients
We conducted a cross-sectional study of 493 older (>60 years) patients admitted to the orthopaedic unit of our hospital between 1 January 2010 and August 2011. After excluding patients with high-trauma fracture, acute or known chronic hepatobiliary diseases, iron metabolism-related diseases (hemochromatosis, thalassemia), acute infection, primary hyperparathyroidism, and Paget’s disease, or who lacked adequate laboratory data, 416 patients (282 women, 134 men) were evaluated for the study.
The study was conducted according to the standards of the Declaration of Helsinki and was approved by the local Health Human Research Ethical Committee. Informed consent from each patient or carer was obtained.
Laboratory measurements
In each patient venous blood samples were collected in the morning following an overnight fast, usually within 24 h after arrival.
Markers of bone and mineral metabolism
The following serum indicators of bone and mineral metabolism were measured: bone formation markers (P1NP and OC), bone resorption marker (βCTX), PTH, 25(OH)D, calcium, phosphate and magnesium concentrations. The serum concentrations of P1NP, OC and βCTX were measured using an electrochemiluminescent immunoassay (Elecsys 2010, Roche Diagnostics, Ltd Corp., IN, USA). Intra- and interassay coefficients of variation (CV) for P1NP were 2.6% and 4.1%, respectively; for OC 3.6% and 6.6%, respectively, and for βCTX 3.2% and 6.5%, respectively. Serum 25(OH)D level was measured by a radioimmunoassay (Dia Sorin, Stillwater, MN, USA) and intact PTH was determined by a two-site chemiluminescent enzyme-linked immunoassay on DPC Immulite 2000 (Diagnostic Products Corp., Los Angeles, CA, USA); the intra- and inter-assay CV ranged from 2.1% to 12.7%. Serum calcium concentrations were corrected for serum albumin. For bone turnover markers, we used reference ranges and data provided by the manufacturers. Vitamin D status was defined as deficient for circulating 25(OH)D concentration<25 nmol/L, and as insufficient for 25–50 nmol/L. Secondary hyperparathyroidism (SHPT) was defined as elevated serum PTH (>6.8 pmol/L, the upper limit of the laboratory reference range).
Liver function tests
The serum levels of GGT, alanine aminotransferase (ALT) and alkaline phosphatase (ALP) were measured enzymatically using the Abbott Architect CI16200 automatic analyser, total bilirubin was measured using diazonium salt, albumin was analysed using bromcresol green, and total protein by a Biuret method. The mean inter–assay and intra-assay CV for these tests were within 1.1% – 6.6%. For liver enzymes two times upper normal limit (UNL) cut-offs were used to define abnormal tests.
Indicators of iron status
Serum indices of iron metabolism were analysed on the Abbot Architect CI16200 (Abbott Laboratories, IL 60064, USA). Serum iron was assessed by direct colorimetric determination, serum ferritin concentration was measured by a two-step chemiluminiscent microparticle immunoassay and transferrin was measured using an immunoturbidimetric procedure. The mean inter–assay and intra-assay CV for these tests were between 1.6% and 3.7%. Transferrin saturation (TSAT) was calculated using the IFCC protein standards (1 mg of transferrin carries 1.49 μg of iron) as follows: TSAT (%) = iron (μmol/L) × 3.8 / transferrin (g/L); reference range 18-46%.
In addition, in all patients routine hematological and biochemical assessments (complete blood count, urea, creatinine, fasting blood glucose, haemoglobin A1c (HbA1c, only in diabetic patients), thyroid function tests (thyroidstimulating hormone, TSH, and thyroxine, T4), C-reactive protein (CRP) were also performed by standardized methods on autoanalyzers. Estimated glomerular filtration rate (eGFR) was determined using the serum creatinine equation. Chronic kidney disease (CKD) was defined as eGFR<60 ml/1.73 m² (CKD ≥ 3 stage).
Statistics
Statistical analyses were performed using Stata software version10 (StataCorp., College Station, TX, USA). For summary statistics, data were untransformed and presented as mean ± standard deviation (SD) for continuous variables and as numbers (or percentages) for categorical variables. For Pearson correlations and regressions, values of all laboratory parameters were logarithmically transformed to account for the skewed nature of most of these variables. Sidak adjustments for multiplicity were performed. Linear regressions involving the predictive value of GGT, and indices of iron metabolism on bone turnover markers were performed accounting for age, sex, other liver function tests, 25(OH)D, PTH, eGFR, T4, TSH, CRP, white cell count (WCC), alcohol consumption, smoking status, presence of diabetes mellitus (DM), cardiovascular disease (CVD), hip fracture (HF) or any fracture. Similar models were used to assess independent determinants of GGT, ferritin, TSAT, HF or any fracture. When the dependent parameter was stratified by level, odds ratios with 95% confidence intervals (CI) were measured in multivariate logistic regression models. The significance of multicollinearity phenomena in multivariate regression analyses was assessed by the variance inflation factor. Two tailed tests were used and results were considered statistically significant if P<0.05.
Results
Patient demographic, clinical and laboratory characteristics
Among 416 studied patients there were 168 subjects with a HF (52.2% cervical, 44.1% trochanteric and 3.7% subtrochanteric), 89 patients with a non-HF fracture of the peripheral skeleton and 160 subjects without any fracture; 67.8% of the entire cohort were women. Hypertension was diagnosed in 62.7%, coronary artery disease (CAD) in 18.3%, atrial fibrillation (AF) in 17.1%, history of stroke or transient ischemic attack in 12.3%, peripheral vascular disease in 5.0%, chronic cardiac failure (CCF) in 10.8%, DM in 19.5%, CKD (eGFR<60 ml/min/1.73 m²) in 19.2%, dementia in 17.6%, Parkinson’s disease in 3.6%, chronic obstructive airway disease (COPD) in 11.1%, and osteoarthritis in 46.8%. At least one CVD and/or DM was found in 76.0% of the cohort; 18.9% of the patients consumed alcohol >3 times a week, 19.3% were exsmokers and 9.1% were current smokers, 19.9% of the patients were admitted from long-term residential care facilities.
The demographic and biochemical characteristics of the study cohort are shown in Table 1. Patients with fractures, as could be expected, were older, had significantly lower mean levels of P1NP, transferrin, hemoglobin, serum calcium (corrected for albumin) and magnesium, and higher concentrations of PTH, βCTX, and ferritin than patients without fractures; accordingly, P1NP/βCTX and OC/βCTX ratios were also significantly lower in the fracture group. In addition, patients with HF compared to the non-fracture subjects had lower serum phosphate and iron concentrations. Patients with fractures had a higher prevalence of vitamin D deficiency (11.7% vs.5.7%, p=0.043) and SHPT (43.1% vs. 34.2%, p=0.044).
| Characteristic |
Total, n=416 |
Without fracture, n=160 (1) |
With hip fracture, n=168 (2) |
With any fracture, n=256(3) |
P Value |
P Value |
| (2 -1) |
(3-1) |
| Age, years |
78.9±8.7 |
75.6±8.1 |
82.8±7.9 |
81.0±8.5 |
0 |
0 |
| Women, n (%) |
282 (67.8) |
101(63.1) |
116(69.1) |
181(70.0) |
0.257 |
0.108 |
| GGT, U/L |
50.3±57.7 |
53.4±64.3 |
43.1±42.6 |
48.4±53.2 |
0.088 |
0.391 |
| *Calcium, mmol/L |
2.35±0.13 |
2.38±0.12 |
2.33±0.13 |
2.34±0.14 |
0.001 |
0.001 |
| Phosphate, mmol/L |
0.92±0.24 |
0.96±0.21 |
0.90±0.28 |
0.91±0.26 |
0.039 |
0.067 |
| Magnesium, mmol/L |
0. 77±0.11 |
0.79±0.10 |
0.75±0.13 |
0.76±0.12 |
0.004 |
0.023 |
| 25(OH)D, nmol/l |
60.2±26.4 |
60.9±24.1 |
60.5±28.9 |
59.7±27.8 |
0.878 |
0.645 |
| PTH, pmol/L |
7.0±4.7 |
6.4±3.5 |
8.0±6.0 |
7.4±5.3 |
0.004 |
0.036 |
| OC, µg/L |
7.3±4.3 |
7.5±4.4 |
7.1±4.5 |
7.1±4.3 |
0.37 |
0.372 |
| P1NP, µg/L |
57.6±61.1 |
65.4±70.1 |
55.1±57.5 |
52.7±54.3 |
0.144 |
0.039 |
| βCTX, µg/L |
0.50±0.33 |
0.44±0.26 |
0.58±0.39 |
0.53±0.36 |
0 |
0.006 |
| OC/ βCTX ratio |
18.9±16.6 |
21.2±19.9 |
15.3±9.5 |
17.4±14.1 |
0 |
0.023 |
| P1NP/ βCTX ratio |
130.0±102.5 |
156.3±117.3 |
112.4±94.5 |
113.8±88.6 |
0 |
0 |
| P1NP/OC ratio |
9.3±11.7 |
10.3±12.3 |
9.5±13.4 |
8.7±11.3 |
0.589 |
0.178 |
| Haemoglobin, g/L |
106.5±16.9 |
108.6±15.3 |
103.7±17.3 |
105.1±17.8 |
0.007 |
0.04 |
| Iron, µmol/L |
5.8±4.7 |
6.1±4.1 |
4.9±5.0 |
5.6±5.0 |
0.018 |
0.333 |
| Ferritin, µg/L |
436.1±572.9 |
334.8±404.3 |
592.0±405.8 |
499.3±526.6 |
0.001 |
0.019 |
| Transferrin, g/L |
1.7±0.43 |
1.8±0.43 |
1.6±0.41 |
1.7±0.42 |
0 |
0 |
| Transferrin sat, % |
12.5±9.5 |
12.5±8.2 |
11.6±9.6 |
12.6±10.2 |
0.377 |
0.919 |
| Urea, mmol/L |
6.3±3.6 |
6.2±2.8 |
6.8±4.5 |
6.4±4.0 |
0.11 |
0.489 |
| Creatinine,µmol/L |
79.1±49.5 |
78.5±31.3 |
84.7±69.5 |
79.5±58.1 |
0.306 |
0.848 |
| eGFR, ml/min/1.73m² |
80.3±26.4 |
79.0±25.5 |
79.8±28.7 |
81.1±26.9 |
0.801 |
0.437 |
| T4, pmol/L |
16.2±3.1 |
16.3±3.0 |
16.0±3.2 |
16.1±3.2 |
0.34 |
0.379 |
| TSH, mU/l |
1.7±3.1 |
1.7±3.7 |
1.7±2.9 |
1.7±2.6 |
0.99 |
0.891 |
Values are means ± SD.GGT:Gamma-GlutamylTransferase; 25(OH)D: 25 HydroxyvitaminD; PTH: Parathyroid Hormone; OC:Osteocalcin; P1NP: Amino-Terminal Propeptideof Type 1 Procollagen; Βctx:CrosslinkedCarboxy-Terminal TelopeptideofType I Collagen; TSAT: Transferrin Saturation; Egfr: Estimated Glomerular Filtration Rate; T4: Free Thyroxine; TSH: Thyroid Stimulating Hormone.*Albumin-corrected.
Table 1: Demographic and biochemical characteristics of the study patients overall and according to the presence of fracture.
Low hemoglobin levels (<120 g/L) were present in 331 (79.6%) patients. Both serum ferritin level and TSAT were in the normal range in 14.6% of our patients. High serum ferritin (>370 μg/L, upper limit of reference range) was found in 32.5% of patients, low TSAT (<18%, lower limit of reference range) in 78.9%, including 52.9% with ferritin in the normal range and 26.0% with a “paradoxical” combination ( i.e. relatively high serum ferritin but low TSAT); only 4 (0.96%) patients demonstrated TSAT>46% (upper limit of reference range). Compared to the rest of the cohort, patients with low TSAT (<18%) had significantly lower mean P1NP/OC (8.5 ± 8.9 vs. 12.2 ± 18.5, p=0.009) and P1NP/βCTX (123.4 ± 96.9 vs. 156.5 ± 118.7, p=0.007) ratios, while subjects with elevated serum ferritin levels (>370 μg/L) had lower OC concentrations (6.5±3.8 vs. 7.7 ± 4.5 μg/L, p= 0.009) and higher P1NP/OC ratios (11.2 ± 16.2 vs. 8.3 ± 8.4, p=0.018).
Relationship between serum GGT activity and indices of bone-mineral and iron metabolism
When the subjects were grouped according to the GGT tertiles patients with lower GGT activity tended to be older (80.4 ± 8.4 years in the first tertile vs.77.6 ± 9.3 years in the third tertile, p for trend 0.027). Increasing tertile of GGT was significantly associated with higher P1NP (46.1 ± 39.5 vs. 64.0 ± 70.7 μg/L, p=0.028), ferritin (262.6 ± 218.0 vs. 522.5 ± 542.1 μg/L, p=0.000), and calcium levels (2.31 ± 0.13 vs. 2.37 ± 0.13 mmol/L, p=0.001), while 25(OH)D concentrations showed a downward trend (64.4 ± 27.3 vs. 55.9 ± 24.4 nmol/L, p=0.029).
Pearson’s correlation coefficients of logarithmically transformed variables adjusted for age and sex revealed that logGGT correlated positively with logP1NP (r=0.136, p=0.006), P1NP/OC ratio (r=0.181, p=0.000), P1NP/βCTX ratio (r=0.096, p=0.052), logPTH (r=0.119, p=0.015), logcalcium (r=0.194, p=0.000), logphosphate (r=0.108, p=0.028), as well as with logferritin (r=0.182, p=0.000), logiron (r=0.103, p=0.037) and logTSAT (r=0.107, p=0.030), and negatively with log25(OH)D (r=-0.126, p=0.010). Although logP1NP, as expected, correlated with both logOC (r=0.424, p=0.000) and logβCTX (r=0.484, p=0.000), and logOC correlated with logβCTX (r=0.353, p=0.000), no significant correlation between logGGT and logOC or logβCTX was observed.
Serum GGT activity and indices of iron metabolism as predictors of bone turnover markers
Stepwise multivariate linear regression analyses (Table 2) showed that both logGGT and logTSAT were significant independent determinants of logP1NP, logβCTX (negatively by logTSAT), P1NP/OC and PINP/βCTX (borderline significant by GGT, p=0.068) ratios. Logferritin was inversely associated with both logOC and logβCTX, and positively with P1NP/OC ratio independently of multiple potential confounders.
| |
Log P1NP |
Log OC |
Log βCTX |
P1NP/OC |
P1NP/ βCTX |
OC/ βCTX |
| Log GGT |
0.095 (0.019) |
|
0.073 |
1.829 |
10.809 |
|
| -0.043 |
-0.008 |
-0.068 |
| *Log Cac |
|
0.588 |
|
|
|
|
| -0.003 |
| Log PO4 |
0.421 |
0.154 |
0.358 |
2.695 (0.099) |
|
-4.537 (0.057) |
| 0 |
-0.047 |
0 |
| Log Mg |
-0.489 |
|
|
-17.63 |
|
|
| -0.048 |
0 |
| Log PTH |
-0.198 |
|
|
|
-22.532 |
|
| -0.004 |
-0.014 |
| Log Ferritin |
|
-0.116 |
-0.086 |
1.533 |
|
|
| 0 |
-0.036 |
-0.016 |
| Log Fe |
|
|
0.347 |
|
|
|
| -0.033 |
| Log Transferrin |
|
|
-0.740 (0.001) |
|
|
8.501 (0.010) |
| Log TSAT |
0.136 |
|
-0.356 |
3.237 |
27.535 |
|
| -0.012 |
-0.027 |
0 |
0 |
| Log eGFR |
-0.344 (0.000) |
-0.303 (0.000) |
-0.349 (0.000) |
|
|
|
| HF |
|
|
0.185 (0.004) |
|
-20.749 (0.044) |
-5.476 (0.002) |
| Any fracture |
-0.145 |
|
|
-2.312 |
-41.184 |
|
| -0.038 |
-0.045 |
0 |
| R² |
0.371 |
0.185 |
0.27 |
0.269 |
0,186 |
0.07 |
Data represented as the regression coefficient and associated significance level (in brackets) if p<0.100.The R-squared value for the overall regressions are also shown. Bold values are statistically significant.
Abbreviations: GGT: Gamma-GlutamylTransferase; P1NP: Amino-Terminal Propeptideof Type I Procollagen; OC: Osteocalcin; Βctx: CrosslinkedCarboxy-Terminal Telopeptide ofType 1 Collagen; PO4: Phosphate; Mg: Magnesium; 25(OH) D: 25-Hydroxyvitamin D; PTH : Parathyroid Hormone; Fe: Iron; EGFR: Estimated Glomerular Filtration Rate; HF: Hip Fracture. *Calcium: Corrected for Albumin.
Table 2: Serum GGT activity and indices of iron metabolism as independent determinants of bone turnover markers (stepwise multivariate linear regression analyses).
Besides, logβCTX was also predicted by logiron (positively) and logtrasferrin (negatively). All three bone turnover markers were also independently predicted by logPO4 (positively) and logeGFR (negatively). LogPTH was inversely associated with logP1NP and P1NP/βCTX ratio, while logMg was inversely associated with logP1NP and P1NP/OC ratio.
Presence of any fracture demonstrated significant negative correlations with logP1NP, P1NP/OC and P1NP/βCTX ratios, while presence of HF was an independent indicator for logβCTX, P1NP/βCTX and OC/βCTX ratios (negative associations with both ratios).
Taken together, these findings show that both serum GGT activity and indices of iron metabolism are specific and important factors influencing bone turnover, which is highly relevant to the mechanical properties of bone and fractures.
Parameters of bone-mineral and iron metabolism as indicators of serum GGT activity
Multivariate logistic regression analysis (Table 3) revealed the following factors as independently and significantly associated with GGT activity: logP1NP, P1NP/OC ratio, logferritin (all positively), log25(OH)D and age (both inversely); logPTH levels demonstrated borderline significance (p=0.059).
| |
β |
95%CI |
P value |
| LogP1NP |
0.131 |
0.026; 0.235 |
0.015 |
| P1NP/OC¹ |
0.01 |
0.003; 0.016 |
0.003 |
| Logferritin |
0.331 |
0.226; 0,435 |
0 |
| Logtransferrin |
0.359 |
-0.039; 0.757 |
0.077 |
| Logiron |
0.112 |
-0.009; 0.233 |
0.069 |
| Log25(OH)D |
-0.207 |
-0.367; -0.046 |
0.012 |
| LogPTH |
0.139 |
-0.005; 0.283 |
0.059 |
| Age |
-0.019 |
-0.029; -0.009 |
0 |
| HF |
-0.147 |
-0.320; 0,026 |
0.096 |
| R² |
0.195 |
|
|
Results with p < 0.100 are shown. Bold values are statistically significant.
Abbreviations: P1NP: Amino-Terminal Propeptideof Type 1 Procollagen; 25(OH) D: 25-Hydroxyvitamin D; PTH: Parathyroid Hormone; HF: Hip Fracture.
Logggt was the Dependent Variable and the Independent Variables Were: Age: Gender: Logp1np : Logoc: Log Βctx : P1NP/OC : P1NP/Βctx : OC/Βctx: Log25(OH)D:Logpth: Logcalcium(Corrected for Albumin):Logphosphate:Logmagnesium:Logalt:Logalp:Logbilirubin:Logalbumin:Logegfr:Logcrp:Logwcc: Alcohol Overuse (>3 Drinks/Week): Smoking Status ( Current Smoker: Ex-Smoker): Presence of Hip Fracture or Any Fracture: Diabetes Mellitus and Cardiovascular Diseases.
¹P1NP and OC (as independent variables) were not included in the model examining P1NP/OC ratio; similarly, P1NP and βCTX were not included in the model examining P1NP/βCTX ratio and OC and βCTX were not included in the model examining OC/βCTX ratio.
Table 3: Parameters of bone - mineral and iron metabolism and related variables as independent determinants of serum logGGT activity (stepwise multivariate linear regression analysis).
In other words, increasing age and higher 25(OH)D are independently associated with lower GGT, whereas higher P1NP, P1NP/ OC ratio, ferritin and possible PTH are indicators of higher GGT.
Serum bone-mineral parameters and GGT activity as indicators of iron metabolism
Both ferritin and TSAT, the two most informative and commonly used indices of iron metabolism, were independently positively predicted by logP1NP and logALT, and negatively by logOC and eGFR (Table 4). In addition, higher logGGT, CRP, male gender and presence of HF or any fracture correlated positively and DM correlated negatively with logferritin levels.
| |
Log ferritin |
Log TSAT |
| |
β |
95%CI |
P value |
Β |
95%CI |
P value |
| LogOC |
-0.328 |
-0.487; -0.169 |
0 |
-0.143 |
-0.256;-0.032 |
0.012 |
| LogP1NP |
0.173 |
0.053; 0.294 |
0.005 |
0.126 |
0.045; 0.207 |
0.002 |
| LogGGT |
0.171 |
0.066; 0.277 |
0.002 |
|
|
|
| LogALT |
0.217 |
0.093; 0.340 |
0.001 |
0.137 |
0.064; 0.210 |
0 |
| CRP |
0.003 |
0.002; 0.004 |
0 |
-0.003 |
-0.004; -0.002 |
0 |
| WCC |
|
|
|
-0.014 |
-0.029; 0.001 |
0.076 |
| LogeGFR |
-0.26 |
-0.424;-033 |
0.022 |
-0.2 |
-0.336; -0.64 |
0.004 |
| DM |
-0.229 |
-0.451; -0.046 |
0.016 |
|
|
|
| HF |
0.328 |
0.166; 0.489 |
0 |
|
|
|
| Any fracture |
0.202 |
0.032;0.372 |
0.02 |
|
|
|
| Sex(m) |
0.306 |
0.143; 0.469 |
0 |
|
|
|
| R² |
|
0.293 |
|
|
0.398 |
|
Results with p<0.100 are presented. The dependent variables were logferritin and TSAT and the independent variables were age, gender, logP1NP, logOC, log βCTX, log25(OH)D, PTH, logcalcium (corrected for albumin), logphosphate, logmagnesium, logGGT, logALT, logALP, logbilirubin, logalbumin, logeGFR, CRP, WCC, alcohol overuse (>3 drinks/week), smoking status ( current smoker, ex-smoker), presence of hip fracture or any fracture, DM, cardiovascular diseases. Bold values are statistically significant.
Abbreviations: TSAT: Transferrin Saturation; P1NP: Amino-Terminal Propeptideof Type 1 Procollagen; OC:Osteocalcin; Βctx:CrosslinkedCarboxy-Terminal TelopeptideofType 1 Collagen; PTH: Parathyroid Hormone; Mg: Magnesium; GGT:ALT: Alanine Aminotransferase; ALP: Alkaline Phosphatase; EGFR: Estimated Glomerular Filtration Rate; HF: Hip Fracture; DM: Diabetes Mellitus; CRP:C-Reactive Protein; WCC: White Cell Count.
Table 4: Serum bone-mineral parameters, GGT activity and related variables as independent determinants of indices of iron metabolism (stepwise multivariate linear regression analyses).
CRP correlated negatively with TSAT, and there was an inverse correlation between blood white cell count (WCC) and TSAT of marginal statistical significance (p=0.076).
The divergent results regarding inflammatory markers (CRP and WCC) are in line with the well known fact that serum ferritin is as a positive acute phase reactant, whereas transferrin is considered a negative one.
Variables independently associated with hip fracture or any fracture
The following 6 variables were independently associated with presence of any fracture (Table 5): logβCTX, logferritin and age (all three positively), logP1NP, P1NP/βCTX ratio and logMg (the last three variables inversely).
| |
Hip fracture |
Any fracture |
| |
OR |
95%CI |
P value |
OR |
95%CI |
P value |
| Log P1NP |
0.59 |
0.39; 0.92 |
0.019 |
0.51 |
0.36; 0.73 |
0 |
| *P1NP/βCTX |
0.43 |
0.29; 0.82 |
0.008 |
0.44 |
0.33; 0.71 |
0 |
| Log βCTX |
2.27 |
1.36; 3.79 |
0.002 |
1.91 |
1.25; 2.91 |
0.003 |
| Log PO4 |
0.29 |
0.94; 0.89 |
0.03 |
|
|
|
| Log Mg |
0.08 |
0.01; 0.48 |
0.006 |
0.17 |
0.03; 0.81 |
0.027 |
| Logferritin |
1.67 |
1.20; 2.31 |
0.002 |
1.3 |
1.01; 1.68 |
0.04 |
| LogGGT |
0.6 |
0.40; 0.88 |
0.01 |
|
|
|
| Age |
1.13 |
1.09; 1.17 |
0 |
1.08 |
1.05; 1.11 |
0 |
| R² |
0.311 |
|
|
0.176 |
|
|
Multivariate linear regression analyses of the dependent variables (hip fracture or any fracture – top row) and the significant (p<0.05) independent variables (left column) shown. Adjustments: age, sex, logP1NP, logOC, log βCTX, P1NP/βCTX (in a model without logP1NP and log βCTX), log25(OH)D, logPTH, logcalcium (corrected for albumin), logphosphate, logmagnesium, logGGT, logALT, logALP, logbilirubin, logalbumin, logeGFR, alcohol overuse (>3 drinks/week), smoking status(current smoker, ex-smoker), presence of diabetes mellitus and/or cardiovasculardiseases.
Table 5: Associations between serum markers of bone-mineral and iron metabolism and GGT activity with hip fracture or any fracture.
When HF patients were considered alone, the statistically significant independent associates were also logGGT and logPO4 (both inverse).
In other words, the risk of HF increases with every increment of one unit of log βCTX by 127%, of one unit of logferritin by 67%, and with one year of age by 13%, while increases in logP1NP, PINP/βCTX ratio, logGGT, logPO4 and logMg have significant protective effects.
Similarly, the risk of any fracture increases with an increase in one unit of log βCTX by 91%, in one unit of logferritin by 30%, with one year of age by 8%, whereas increases in logP1NP, PINP/βCTX ratio and logMg demonstrate protective effects.
Discussion
Main findings
Our data shows a complex interplay between serum GGT activity, iron status and bone metabolism (Figure 1). Bone remodelling is regulated by GGT and iron status, and specific bone-derived molecules (P1NP and OC) affect both the GGT activity and iron homeostasis, while GGT and ferritin are also interrelated.
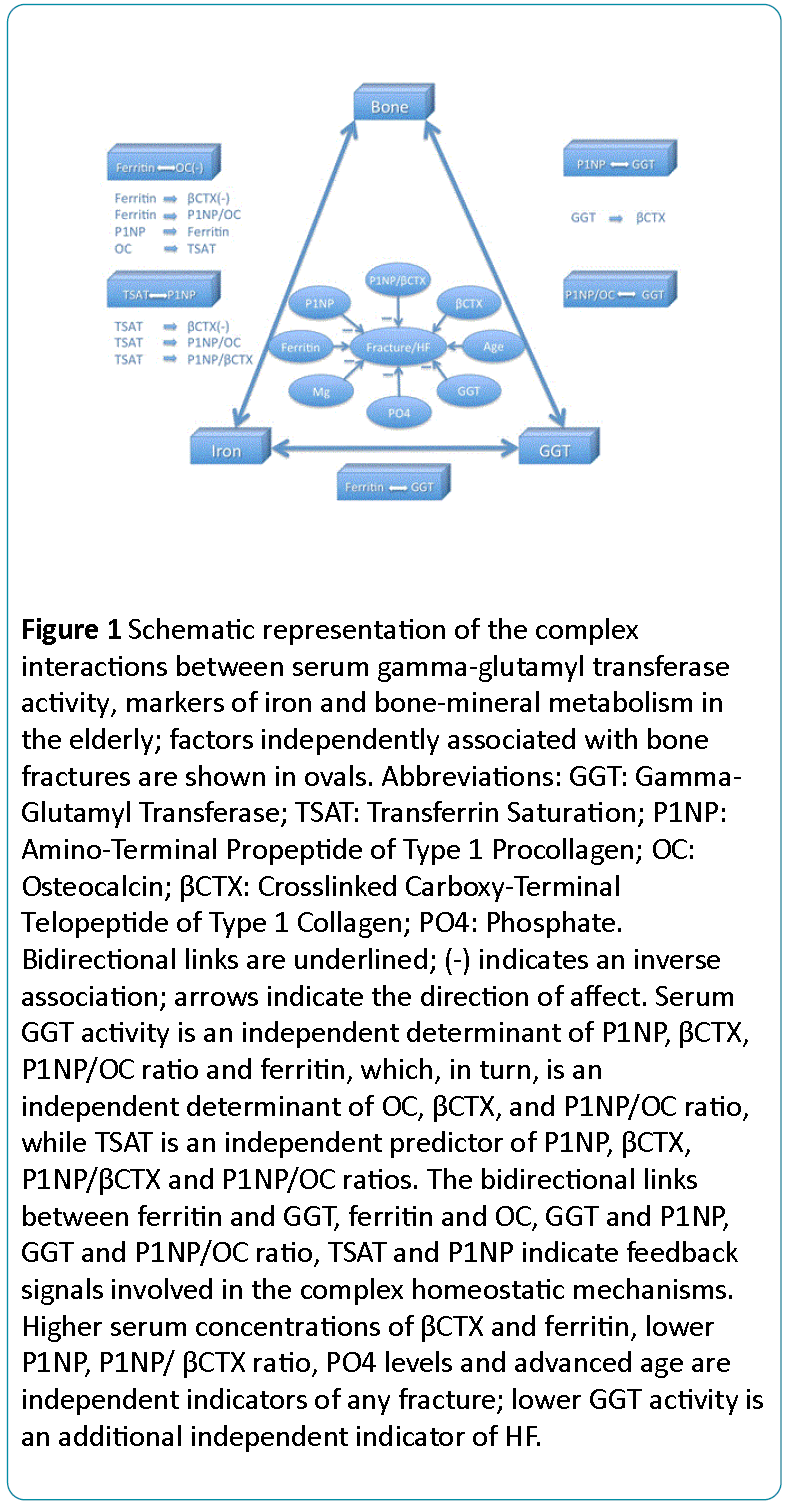
Figure 1: Schematic representation of the complex interactions between serum gamma-glutamyl transferase activity, markers of iron and bone-mineral metabolism in the elderly; factors independently associated with bone fractures are shown in ovals. Abbreviations: GGT: Gamma- Glutamyl Transferase; TSAT: Transferrin Saturation; P1NP: Amino-Terminal Propeptide of Type 1 Procollagen; OC: Osteocalcin; CTX: Crosslinked Carboxy-Terminal Telopeptide of Type 1 Collagen; PO4: Phosphate. Bidirectional links are underlined; (-) indicates an inverse association; arrows indicate the direction of affect. Serum GGT activity is an independent determinant of P1NP, CTX, P1NP/OC ratio and ferritin, which, in turn, is an independent determinant of OC, CTX, and P1NP/OC ratio, while TSAT is an independent predictor of P1NP, CTX, P1NP CTX and P1NP/OC ratios. The bidirectional links between ferritin and GGT, ferritin and OC, GGT and P1NP, GGT and P1NP/OC ratio, TSAT and P1NP indicate feedback signals involved in the complex homeostatic mechanisms. Higher serum concentrations of CTX and ferritin, lower P1NP, P1NP CTX ratio, PO4 levels and advanced age are independent indicators of any fracture; lower GGT activity is an additional independent indicator of HF.
The bidirectional links between P1NP and GGT (1), P1NP/OC ratio and GGT (2), P1NP and TSAT (3), OC and ferritin (4), GGT and ferritin (5) suggest that these molecules and factors act as feedback loop signals participating in the complex homeostatic, adaptive and compensatory mechanisms.
Furthermore, serum GGT activity, ferritin and TSAT are independent indicators of βCTX, while ferritin and TSAT are also independent predictors of the P1NP/OC ratio, and TSAT is an independent predictor of the P1NP/βCTX ratio.
The study provides evidence that GGT and iron status indices (even within normal or mildly-moderately abnormal range) act as independent determinants of different aspects of bone metabolism, and are, in turn, regulated by bone-derived peptides. Remarkably, both osteoblast-specific secreted molecules - OC (well documented previously [24,25]) and P1NP (as described, for the first time, in this study) – exert multiple extra-skeletal metabolic functions. The biological and clinical relevance of our results, which confirm and extend a n uzCmber of previous studies are further discussed.
Serum GGT activity
In our multivariate adjusted models serum GGT activity was an independent determinant of P1NP and βCTX levels, as well as the P1NP/OC ratio. On the other hand, higher serum GGT activity was independently predicted by higher P1NP, P1NP/OC ratio, ferritin levels, lower 25(OH)D concentrations and younger age.
These results are consistent with:
• Hxperimental data indicating important (patho)physiological role of GGT in bone turnover state involving both bone formation and bone resorption [2-6].
• Human studies which reported as (?) Increased urinary excretion of bone resorption markers in parallel with urinary GGT levels in postmenopausal women [6], (??) Correlation between serum GGT and ferritin levels in the adult population [26], as well as in patients with chronic hepatitis C [27] and DM [28], and (???) An inverse association between 25(OH)D and GGT activity [29].
The results from the present study show that age-related decreases in GGT activity, a well known phenomenon [30,31], is associated with suppression of bone formation (indicated by lower P1NP and P1NP/OC ratio), as well as bone resorption (lower βCTX), but more affecting the former process.
On the other hand, both lower serum GGT and P1NP levels are associated with lower ferritin concentrations which, in turn, correlate inversely with markers of bone differentiation (higher OC) and bone resorption (higher βCTX).
Lower GGT activity is also a significant independent indicator of HF.
These findings suggest a complex/dual effect of lower GGT on bone turnover, and indicate that GGT and iron operate as integral components of a complex homeostatic network that regulates bone metabolism.
Iron metabolism
Our logistic regression analyses after adjusting for demographics, liver, renal, mineral and inflammatory markers, smoking and alcohol consumption status, presence of DM, CVD and fracture indicated independent positive associations of TSAT with P1NP, P1NP/OC and P1NP/βCTX ratios, and negative with βCTX, while ferritin was a negative regulator of both OC and βCTX and a positive determinant of the P1NP/OC ratio. On the other hand, both P1NP and OC independently predicted TSAT, as well as ferritin.
These findings suggest that:
• Higher iron status (as indicated by higher TSAT and/or ferritin levels) is associated with suppression of osteoclast function and bone resorption (lower βCTX).
• Bone formation (P1NP) increases when TSAT is higher, but higher ferritin suppresses the process of bone differentiation (lower OC and higher P1NP/OC ratio).
• Iron-related markers have different effects on specific aspects of osteoblast function; feedback signals between molecules involved in iron and bone metabolism generate a positive loop with osteoblast formation (TSAT – P1NP) and a negative loop with osteoblast differentiation (ferritin – OC).
Thus, the bidirectional links TSAT-P1NP and ferritin-OC, as well as the effects of both ferritin and TSAT on βCTX, of TSAT on P1NP/OC and P1NP/βCTX ratios should be considered as components of homeostatic systems that maintain structural and functional integrity in the bone (as well as in different other tissues).
Experimental studies linked osteoporosis/osteopenia with both iron overload [32-34] and iron deficiency [35-37]. Few studies in humans that examined the relation between parameters of iron status and bone turnover markers have produced inconclusive results.
An inverse association between serum ferritin and OC was reported in subjects aged 55-80 years with CVD [38]. In postmenopausal women with HF, serum ferritin correlated positively and transferrin correlated negatively with both P1NP and βCTX [13].
In young women negative correlations were found between log-ferritin and a urinary bone resorption marker (log-NTx), and between transferrin and P1NP [10], while serum ferritin concentration was not correlated with serum bone resorption marker (tartrate-resistant acid phosphatase type 5b) in patients with sickle cell disease [39]. In astronauts, both ferritin and TSAT positively correlated with biochemical markers of bone resorption [14].
Clearly, contradicting results on associations between indices of iron and bone metabolism at least in part may be explained by the heterogeneity of the study populations, effects of age, gender, ethnicity, hormonal and environmental factors, different definitions of iron status, analytical variability of assays and adjustments only for some confounding factors.
Our observation of the inverse relationship between ferritin and OC as well as between ferritin and βCTX concur with some previous clinical observations [10,38] and is in line with animal studies which showed lower serum OC concentration in irondeficient rats [36]. The positive associations of TSAT with P1NP and P1NP/OC ratio in this study is consistent with lower P1NP levels in premenopausal women with iron deficient anemia [10] and decreased bone matrix formation in anemic rats [35]. Notably, in our study, three iron indices - TSAT, ferritin and transferrin - were independently and inversely associated with βCTX, suggesting that iron deficiency results not only in decreased bone formation but also in increased bone resorption, a finding consistent with significantly elevated levels of urinary resorption marker in iron deficient women [10], and data of increased bone resorption in anaemic rats [35]. Other researchers found both reduced bone formation and resorption in iron-deficient anaemic rats but bone resorption remained greater than bone formation, resulting in overall bone loss [36].
An important point to note is that ferritin demonstrated a bidirectional inverse link with OC, whereas TSAT showed a bidirectional positive association with P1NP, despite the fact that P1NP is correlated with OC. It appears, therefore, that the contribution of ferritin to bone metabolism may reflect an effect mediated by mechanism (-s) other than increased iron stores. Furthermore, despite the strong inverse bidirectional link between ferritin and OC, neither serum iron, nor TSAT (additional indicators of body iron stores, transport and availability) independently predicted OC in our and other studies [28].
These observations are in keeping with the existing evidence that elevated serum ferritin is a multifactorial metabolic marker which reflects in addition to body iron stores other conditions such as inflammation, oxidative stress, chronic kidney, liver and autoimmune disorders; elevated ferritin levels do not exclude underlying iron deficiency.
Indeed, 78.9% of our patients had low TSAT, and 26.0% demonstrated a “paradoxical” combination of elevated ferritin levels with low TSAT, indicating functional iron deficiency [40], a condition typical for anemia of chronic disease (anemia of inflammation) and chronic kidney disease. In the present study ferritin was independently predicted by CRP (positively) and eGFR (negatively).
Although hydroxylation of 25(OH)D to 1,25(OH)D requires iron [36] and low vitamin D levels were linked with iron deficient anemia in females [10], in our study, 25(OH)D was not an independent determinant of TSAT or ferritin.
Homeostatic mechanisms
Our data indicate a negative-feedback loop ferritin – OC and a positive-feedback loop TSAT – P1NP, whereas both P1NP and P1NP/OC ratio demonstrate positive-feedback loops with GGT. These observations reflect the complexity of homeostatic mechanisms and are in line with the growing body of evidence suggesting oxidative stress as an integrative (patho)physiologic mechanism that links both GGT activity and iron status with bone integrity. Higher level of GGT, the main determinant of extracellular hydrolysis of glutathione, and elevated serum ferritin concentrations leading to release of more free iron, could facilitate glutathione catabolism, increase production of reactive oxygen species and subsequent oxidative stress, which in turn, affects bone metabolism and causes bone loss [22,23,41]. The hypothesis that oxidative stress is involved in the pathogenesis of bone loss is supported by animal studies showing that treatment with the antioxidant N-acetyl-Lcysteine, precursor of glutathione, reversed osteopenia in GGT-deficient mice [2] and prevented the development of bone abnormalities in iron-overloaded mice [33]. In ours and other studies, GGT and ferritin correlated with each other. On the other hand, these variables demonstrated associations with βCTX and presence of HF, which is in line with the dual role of reactive oxygen species (positive at moderate levels and damaging at elevated levels) in bone metabolism, as in a number of other pathological conditions. Interrelated serum GGT and ferritin levels appear as an important homeostatic bridge between metabolic, oxidative and bone status.
Taken together, the existing literature (although results are mixed) and our observations provide evidence that regulation of both osteoblastic and osteoclastic differentiation and function requires an optimal iron status: iron levels should be sufficiently high to facilitate bone formation and suppress bone resorption, but not so high that they affect bone differentiation and increase GGT activity. Importantly, these factors are in a state of mutual influence: feedback mechanisms involving both osteoblast-specific proteins (P1NP and OC) participate in maintaining iron homeostasis and GGT activity.
Biomarkers of osteoporotic fractures
In multivariate regression, P1NP, βCTX, P1NP/βCTX ratio, ferritin, magnesium and age were independent indicators of HF or any fracture; GGT and phosphate levels were additional independent negative indicators of HF. Multivariate regression analyses revealed also that presence of HF was an independent positive predictor for logferritin, logβCTX, and a negative predictor for both P1NP/βCTX and OC/βCTX ratios. Interestingly, neither serum 25(OH)D, no PTH were independently associated with fractures, and no association between serum 25(OH)D and any of serum bone markers was found, but logPTH was an independent negative predictor of logP1NP and P1NP/ βCTX ratio.
The literature on the association between fracture risk and bone turnover markers, as well as serum 25(OH)D and PTH concentrations is controversial. Our data are in agreement with previous studies showing that: (1) higher serum and urinary bone resorption markers predict risk for HF, vertebral and non-vertebral fracture [42], (2) in women low serum levels of P1NP (independent of BMD) predict increased risk of HF [43], (3) serum concentrations of PTH correlated negatively with P1NP, while there was no correlation between 25(OH)D and any bone markers [43,44].
Although P1NP and CTX were recommended as osteoporotic markers by the Bone Marker Standards Working Group [45], the P1NP/βCTX ratio has not been evaluated previously. In our study, the P1NP/βCTX ratio that combines two different markers reflecting both bone formation and bone resorption appears as an independent and a better indicator of fracture than absolute P1NP and βCTX values.
Practical considerations
First, the fact that abnormal iron status, a preventable and curable factor, contributes to the occurrence of osteoporotic fractures, signifies the importance of screening for and treating all elderly persons with altered iron metabolism and/or anemia for osteoporosis and vice versa.
Second, in the elderly iron deficiency, absolute (low iron stores) or functional (impaired iron mobilization from storage and transportation to target tissues despite normal or abundant body iron stores) is prevalent and multifactorial (renal insufficiency, sex hormone deficiency, limited iron intake, blood loss). Since ferritin levels are not specific for iron overload (serum ferritin is almost equally both a measure of iron stores and an inflammatory marker), this parameter has to be interpreted with caution. Moderately elevated ferritin levels, as in our study, especially if combined with a low TSAT (an index of the amount of iron molecules available in the serum that are bound to transferrin), may reflect multiple systemic processes. Therefore, the recommendation of lowering “iron overload” (based on serum ferritin levels only) by chelation therapy [9] or by a biologically active form of hepcidin [8] for the treatment of osteoporosis seems premature if not inappropriate, specifically in the elderly, in whom osteoporosis, iron-deficiency, chronic inflammation and renal impairment are common. Therapeutic manipulation of iron balance in this population is challenging; to be effective and safe it should be based on detailed assessment of pathogenic mechanisms and individualised.
Third, because low BMD, currently the main diagnostic criterion of fracture risk, has a poor sensitivity (about half of low-trauma fractures occur in subjects with non-osteoporotic BMD), our observations together with literature reports indicate that bone turnover markers, especially the P1NP/βCTX ratio, may be useful in detection of increased risk of osteoporotic fracture and in selection of the most suitable type of antiosteoporotic treatment in a given patient (i.e., anabolic versus antiresorptive medications in individuals with low P1NP). A combined approach with both indices of bone turnover and BMD could possibly improve fracture prediction and management.
Limitations
A number of limitations of this study need to be considered. First, because it is a cross-sectional study, it cannot prove causality. Second, a single-point measurement of the biomarkers may be subject to within-individual variation, although the majority of biochemical tests, including serum GGT, ferritin, iron, OC, P1NP, indices of mineral metabolism are relatively stable and have no circadian and between-day variations. Third, although in multivariate models we attempted to adjust for a series of potential confounders (laboratory, clinical, behavioural), the possibility of residual or unknown confounding cannot be excluded. Forth, as we did not measure hepcidin, soluble transferring receptor, and undercarboxylated OC, our results should be interpreted cautiously. Finally, this study was conducted at a single centre and as the cohort was almost entirely Caucasians, our findings may not necessarily translate to other centres and be applicable to other ethnic and racial populations. The strength of this study includes comprehensive clinical and laboratory evaluations and simultaneously measuring of multiple parameters of liver, iron and bone metabolism in a moderately large sample size, whereas most of previous clinical studies assessed a limited number of variables and often did not control for important factors. In all our models the variance inflation factor ranged between 1.03 and 1.17 indicating that the amount of multicollinearity was not significant.
Conclusions
The study highlighted and specified the bidirectional interconnections between serum GGT activity, indices of iron metabolism and bone-derived factors, the role of GGT and iron homeostasis in maintaining bone health in the elderly, reinforced the need to individualize prophylactic and therapeutic strategies based on alterations in individual biochemical profiles, and identified the serum bone turnover markers, especially P1NP/βCTX ratio, as indicators for osteoporotic fractures. The clinical significance and ways of modulation of GGT and iron-related factors warrant further investigations.
Conflict of interests
The authors declare that they have no conflict of interests.
9982
References
- Whitfield JB (2001) Gamma glutamyltransferase.Crit Rev Clin Lab Sci 38: 263-355.
- Levasseur R, Barrios R, Elefteriou F, Glass DA 2nd, Lieberman MW, et al. (2003) Reversible skeletal abnormalities in gamma-glutamyltranspeptidase-deficient mice.Endocrinology 144: 2761-2764.
- Niida S, Kawahara M, Ishizuka Y, Ikeda Y, Kondo T, et al. (2004)Gamma-glutamyltranspeptidase stimulates receptor activator of nuclear factor-kappaB ligand expression independent of its enzymatic activity and serves as a pathological bone-resorbing factor. J BiolChem 279: 752-756.
- Hiramatsu K, Asaba Y, Takeshita S, Nimura Y, Tatsumi S,et al. (2007)Overexpression of gamma-glutamyltransferase in transgenic mice accelerates bone resorption and causes osteoporosis. Endocrinology 148: 2708-2715.
- Ishizuka Y,Moriwaki S, Kawahara-Hanaoka M, Uemura Y, Serizawa I, et al. (2007) Treatment with anti-gamma-glutamyltranspeptidase antibody attenuates osteolysis in collagen-induced arthritis mice. J Bone Miner Res 22: 1933-1942.
- Asaba Y, Hiramatsu K, Matsui Y, Harada A, Nimura Y, et al. (2006) Urinary gamma-glutamyltransferase (GGT) as a potential marker of bone resorption.Bone 39: 1276-1282.
- Kim BJ (2014) A higher serum gamma-glutamyltransferase level could be associated with an increased risk of incident osteoporotic fractures in Korean men aged 50 years or older. Endocr J61: 257-263.
- Chen B, Li GF, Shen Y, Huang XI, Xu YJ (2015) Reducing iron accumulation: A potential approach for the prevention and treatment of postmenopausal osteoporosis.ExpTher Med 10: 7-11.
- Li GF, Pan YZ, Sirois P, Li K, Xu YJ (2012) Iron homeostasis in osteoporosis and its clinical implications.OsteoporosInt 23: 2403-2408.
- Toxqui L, Vaquero MP (2015) Chronic iron deficiency as an emerging risk factor for osteoporosis: a hypothesis.Nutrients 7: 2324-2344.
- Kim BJ, Ahn SH, Bae SJ, Kim EH, Lee SH, et al. (2012) Iron overload accelerates bone loss in healthy postmenopausal women and middle-aged men: a 3-year retrospective longitudinal study.J Bone Miner Res 27: 2279-2290.
- Kim BJ, Lee SH, Koh JM, Kim GS (2013) The association between higher serum ferritin level and lower bone mineral density is prominent in women ≥45 years of age (KNHANES 2008-2010).OsteoporosInt 24: 2627-2637.
- Zhang LL, Jiang XF, Ai HZ, Jin ZD, Xu JX, et al. (2013) [Relationship of iron overload to bone mass density and bone turnover in postmenopausal women with fragility fractures of the hip].ZhonghuaWaiKeZaZhi 51: 518-521.
- Zwart SR, Morgan JL, Smith SM (2013) Iron status and its relations with oxidative damage and bone loss during long-duration space flight on the International Space Station.Am J ClinNutr 98: 217-223.
- Chon SJ, Choi YR, Roh YH, Yun BH, Cho S, et al. (2014) Association between levels of serum ferritin and bone mineral density in Korean premenopausal and postmenopausal women: KNHANES 2008-2010.PLoS One 9: e114972.
- Buyukbese MA, Cetinus E, Cetinkaya A, Aras S (2005) Ferritin levels in postmenopausal women do not seem to play a significant role in osteoporosis.South Med J 98: 845.
- D'Amelio P, Cristofaro MA, Tamone C, Morra E, Di Bella S, et al. (2008) Role of iron metabolism and oxidative damage in postmenopausal bone loss.Bone 43: 1010-1015.
- Ilich JZ, Skugor M, Hangartner T, Baoshe A, Matkovic V (1998) Relation of nutrition, body composition and physical activity to skeletal development: a cross-sectional study in preadolescent females. J Am CollNutr 17: 136-147.
- Lee KS, Jang JS, Lee DR, Kim YH, Nam GE, et al. (2014) Serum ferritin levels are positively associated with bone mineral density in elderly Korean men: the 2008-2010 Korea National Health and Nutrition Examination Surveys. J Bone Miner Metab 32: 683-690.
- Lee DH, Blomhoff R, Jacobs DR Jr (2004) Is serum gamma glutamyltransferase a marker of oxidative stress?Free Radic Res 38: 535-539.
- Galaris D, Pantopoulos K (2008) Oxidative stress and iron homeostasis: mechanistic and health aspects.Crit Rev Clin Lab Sci 45: 1-23.
- Filaire E, Toumi H (2012) Reactive oxygen species and exercise on bone metabolism: friend or enemy?Joint Bone Spine 79: 341-346.
- Wauquier F, Leotoing L, Coxam V, Guicheux J, Wittrant Y (2009) Oxidative stress in bone remodelling and disease.Trends Mol Med 15: 468-477.
- Fisher A, Srikusalanukul W, Davis M, Smith P (2012) Interactions between Serum Adipokines and Osteocalcin in Older Patients with Hip Fracture.Int J Endocrinol 2012: 684323.
- Lee NK, Sowa H, Hinoi E, Ferron M, Ahn JD, et al. (2007) Endocrine regulation of energy metabolism by the skeleton.Cell 130: 456-469.
- McKinnon EJ, Rossi E, Beilby JP, Trinder D, Olynyk JK (2014) Factors that affect serum levels of ferritin in Australian adults and implications for follow-up.ClinGastroenterolHepatol 12: 101-108.
- Venturini D,Simão AN, Barbosa DS, Lavado EL, Narciso VE, et al. (2010) Increased oxidative stress, decreased total antioxidant capacity, and iron overload in untreated patients with chronic hepatitis C. Dig Dis Sci 55: 1120-1127.
- Yeap BB, Divitini ML, Gunton JE, Olynyk JK, Beilby JP, et al. (2015) Higher ferritin levels, but not serum iron or transferrin saturation, are associated with Type 2 diabetes mellitus in adult men and women free of genetic haemochromatosis.ClinEndocrinol (Oxf) 82: 525-532.
- Skaaby T, Husemoen LL, Borglykke A, Jørgensen T, Thuesen BH, et al. (2014) Vitamin D status, liver enzymes, and incident liver disease and mortality: a general population study.Endocrine 47: 213-220.
- Fisher L,Srikusalanukul W, Fisher A, Smith P (2015) Liver function parameters in hip fracture patients: relations to age, adipokines, comorbidities and outcomes. Int J Med Sci 12:100-115.
- Fraser, AThinggaard M, Christensen K, Lawlor DA(2009) Alanine aminotransferase, gamma-glutamyltransferase (GGT) and all-cause mortality: results from a population-based Danish twins study alanine aminotransferase, GGT and mortality in elderly twins. Liver Int29: 1494-1499.
- Messer JG, Kilbarger AK, Erikson KM, Kipp DE (2009) Iron overload alters iron-regulatory genes and proteins, down-regulates osteoblastic phenotype, and is associated with apoptosis in fetal rat calvaria cultures. Bone 45: 972-979.
- Tsay J, Yang Z, Ross FP, Cunningham-Rundles S, Lin H, et al. (2010) Bone loss caused by iron overload in a murine model: importance of oxidative stress.Blood 116: 2582-2589.
- Zhao GY, Zhao LP, He YF, Li GF, Gao C, et al. (2012) A comparison of the biological activities of human osteoblast hFOB1.19 between iron excess and iron deficiency.Biol Trace Elem Res 150: 487-495.
- Díaz-Castro J, López-Frías MR, Campos MS, López-Frías M, Alférez MJ, et al. (2012) Severe nutritional iron-deficiency anaemia has a negative effect on some bone turnover biomarkers in rats.Eur J Nutr 51: 241-247.
- Katsumata S, Katsumata-Tsuboi R, Uehara M, Suzuki K (2009) Severe iron deficiency decreases both bone formation and bone resorption in rats.J Nutr 139: 238-243.
- Messer JG, Cooney PT, Kipp DE (2010) Iron chelatordeferoxamine alters iron-regulatory genes and proteins and suppresses osteoblast phenotype in fetal rat calvaria cells. Bone 46: 1408-1415.
- Juanola-Falgarona M,Cándido-Fernández J, Salas-Salvadó J, Martínez-González MA, Estruch R, et al. (2013) Association between serum ferritin and osteocalcin as a potential mechanism explaining the iron-induced insulin resistance. PLoS One 8:e76433.
- Nouraie M, Cheng K, Niu X, Moore-King E, Fadojutimi-Akinsi MF, et al. (2011) Predictors of osteoclast activity in patients with sickle cell disease.Haematologica 96: 1092-1098.
- Thomas DW, Hinchliffe RF, Briggs C, Macdougall IC, Littlewood T, et al. (2013) Guideline for the laboratory diagnosis of functional iron deficiency.Br J Haematol 161: 639-648.
- Callaway DA, Jiang JX (2015) Reactive oxygen species and oxidative stress in osteoclastogenesis, skeletal aging and bone diseases.J Bone Miner Metab 33: 359-370.
- Johansson H, Odén A, Kanis JA, McCloskey EV, Morris HA, et al. (2014) A meta-analysis of reference markers of bone turnover for prediction of fracture.Calcif Tissue Int 94: 560-567.
- Finnes TE, Lofthus CM, Meyer HE, Eriksen EF, Apalset EM, et al. (2014) Procollagen type 1 amino-terminal propeptide (P1NP) and risk of hip fractures in elderly Norwegian men and women. A NOREPOS study.Bone 64: 1-7.
- Iglesias P, Arrieta F, Piñera M, Botella-Carretero JI, Balsa JA (2011) Serum concentrations of osteocalcin, procollagen type 1 N-terminal propeptide and beta-CrossLaps in obese subjects with varying degrees of glucose tolerance. ClinEndocrinol (Oxf) 75: 184-188.
- Vasikaran S, Cooper C, Eastell R, Griesmacher A, Morris HA, et al. (2011) International Osteoporosis Foundation and International Federation of Clinical Chemistry and Laboratory Medicine position on bone marker standards in osteoporosis. ClinChem Lab Med 49: 1271-1274.