Keywords
Child development; Reproducibility of results; Validity; Frequency; Colombia
Introduction
Child development is determined based on physical, emotional, and social domains that together affect the immediate quality of life of the child and his or her potential for the medium and long term [1,2]. Changes in child development and welfare have a multidimensional origin related to structural problems such as poverty, low-quality education, poor health services coverage, and living in contexts of vulnerability where risks including teen pregnancy, sexually transmitted infections, addiction, and violence merge [3].
Research studies have shown that the strong correlation between nutrition and neurological-behavioral development in early infancy can be added to the factors described above [4-6]. A nutritional deficiency at the beginning of childhood alters the development of the central nervous system, affecting the integration of neural structures and, therefore, various cognitive and behavioral skills [7]. At a slightly older age, although it ,is likely that children have developed basic behavioral repertoires for the acquisition of complex psychological processes, their cultural context can limit or enhance their psycho-social development [8]. Other studies have shown the effect or predictive power of demographics, family health, and parenting practices on child development [9].
In epidemiological terms, some authors have documented a high prevalence of attention problems and low birth weight, a lack of breastfeeding, and a high risk of disability [3]. Nonetheless, there are few investigations that describe the magnitude of the problems of child development, which shows that monitoring in this area has not been exhaustive, and in the Colombian case, the information related to this issue focuses on health services provider institutions.
On the other hand, controversies related to the scales or measuring instruments of development remain; specifically, the “availability of reliable instruments, adapted and normalized to the regional culture, has been one of the most pressing needs for the various professionals involved in the evaluation and diagnosis of child development” in Colombia [10]. Nationally, during the 1990s, various institutions attempted to apply scales of development, but most presented limitations such as being the synthesis of instruments from different cultural contexts, using small samples, failing to represent the population diversity, and lacking clear classification criteria and recording. Therefore, the Maternal-Child Division of the Ministry of Health and the Mental Health Division, whose functions include “the design of operating systems for prevention, diagnosis, treatment, and rehabilitation of the health problems, growth, and development of children”, developed and validated the Abbreviated Scale of Development for the entire country [10].
Previous studies have evaluated this scale; however, they have been restricted to one of its dimensions or have conducted comparative evaluations against other diagnostic scales without validating the psychometric properties of the Abbreviated Scale of Development. In this sense, Muñoz conducted a study of 96 children and evaluated language and listening using the Abbreviated Scale of Development against the Reynell Test for assessing language, audiometry, and otoacoustic emissions to evaluate listening, finding a sensitivity of 54%, a specificity of 42%, and a positive predictive value of 87% [11]. The Hormiga group evaluated the motor skills component in comparison with the Neurosensory Motor Development Assessment test, finding an intraclass correlation coefficient greater than 0.90, indicating good reproducibility between the measurements [12].
This background research demonstrates that, in addition to the few studies available available on the magnitude of this problem in specific populations, no studies to date have been performed on research related to their reproducibility and psychometric validity.
Therefore, a study was designed with the objective of evaluating the reproducibility and validity of the Abbreviated Scale of Development and determining the frequency of abnormal child development in an area of socio-economic vulnerability in Medellin. This target was chosen because originating from areas with high levels of marginalization is a risk factor for suffering problems in child development, given the precarious provision of health services, food, and other related factors [13-15].
The relevance of this work is that the results allow the following: evaluating an instrument that is useful for designing and evaluating programs for children; identifying the children at greatest risk; detecting alterations in the process of child development; taking preventive measures or appropriate care; and orienting subsequent research, in addition to programs for screening, prioritization, and the development of child care.
Methods
Study location
The area of Nuevo Occidente originated as a city sector with a profile corresponding to “farms with agricultural production, many without any utilization, and three settlements: Pedregal Bajo, the invasion of La Aurora in the Nazareth farm, and the sector called Pajarito Central. It was fixed as urban land by Agreement 01 of 1994 and as soil expansion by Municipal Agreement 62 of 1999, defined as polygon Z2-DE4 by Decree 602 of 2002”. After starting the urbanization process, a significant proportion of the domiciles in this sector were allocated to “inhabitants of the hill of garbage from Moravia, those affected by the fire in the Oasis, the burning of Altos de la Virgen, displaced by violence and victims of the military forces as reparation” [16]. This population configuration reveals that residents of the area have a high risk for many health problems.
Type of study
A descriptive transversal study and psychometric evaluation.
Study subjects
A total of 141 healthy children who participated in other educational initiatives in the city and attended the play center of Nuevo Occidente comprised the sample. As inclusion criteria, they were required to participate in the program for a minimum of 1 month, the guardian and the head of the institution or program were required to sign an informed consent, and they were required to be treated in the E.S.E. [State Social Enterprise] Metrosalud of Medellin. Furthermore, the inclusion criteria for the validation of the Abbreviated Scale of Development of the Ministry of Health were added; these criteria included that the child was calm and accepted the presence and physical contact of the examiner. The exclusion criteria were those contained in the validation of the Abbreviated Scale of Development of the Ministry of Health, providing for the exclusion of children who were sick, frightened, or in an emotional state in which they rejected the clinical examination [10].
Measurement instrument: Abbreviated scale of development
This instrument was validated after an investigation led by the Ministry of Health of Colombia in 1999 with the objective of obtaining normative parameters in a sample of 16,180 children from multiple regions of Colombia and with the goal of overcoming certain limitations of the measurements used by some Ministry of Health programs for the psychosocial development of children under 5 years of age. The scale includes 4 areas of child development: i) Gross Motor Skills, which are an indicator of neurological maturation, control of tone and posture, and motor coordination of the head, limbs, and torso; ii) Fine Motor- Adaptive Skills, which evaluate the ability to coordinate specific movements, intersensorial eye-hand control and precision before situations that require fine apprehension, calculating distances, and visual tracking; iii) Listening and Language, which analyze the evolution and perfection of speech and language from items such as auditory orientation, communicative intention, vocalization and articulation of phonemes, word formation, vocabulary comprehension, using simple and complex sentences, nomination, comprehending instructions, and spontaneous expression; and iv) the Personal-Social area, which evaluates processes of initiation and response to social interaction, dependence-independence, the expression of feelings and emotions, and the learning and behavioral patterns associated with self-care. Each of the areas is evaluated as a dichotomous item categorized by 1 for presence and 0 for absence; the final grade is obtained from the sum of the items evaluated according to age group. Upon completion, a score for each of the 4 areas and for the total score is obtained. These 5 summations are categorized into 4 levels: Alert for scores less than 5% (5th percentile) lower than the reference group, Medium for scores between the 5th and 50th percentiles, Medium-high for scores between the 50th and 95th percentiles, and High for scores above the 95th percentile [10].
Information collection
The primary source of information consisted of a clinical evaluation and the application of the Abbreviated Scale of Development by semiology students who were supervised by their teachers at the Cooperative University of Colombia. To control for information bias, interviewers were trained, a field work manual was prepared, information on the central aspects of the project was provided to participants, and double entry and pilot tests were performed. Before data collection began, an informed consent form was signed by the facilitators of the play center institution. The clinical examination and the application of the scale were performed in a quiet, isolated place, without interruptions or distractions for the child, with mattresses, tables, and chairs that ensured the comfort of the child and the evaluator.
Information analysis
The description of the total score and the 4 areas was performed with summary measures. The floor effect was established as the proportion of individuals with the lowest score and the ceiling effect as the proportion with the highest score. Reproducibility was evaluated with criteria of reliability, internal consistency, and discriminating power, first through Cronbach’s α, taking values ≥0.70 as favorable. Internal consistency was evaluated based on Spearman’s correlations for each item with the development area to which it belongs. Discriminating power is defined as the lowest Spearman’s correlation of each item with the areas to which they do not belong in comparison to the development area to which they do belong. For internal consistency and discriminating power, the percentage of success was established, and results over 90% were considered to be satisfactory based on the following formulas:
% of internal consistency success=(# of item-area correlations that evaluate ≥0.3/# of evaluated item-area correlations)* 100
% of discriminating power success=(# of non-evaluated item-area correlations less than the evaluated item-area correlation/# of non-evaluated item-area correlations)* 100
Content validity and predictive validity were evaluated based on an exploratory factor analysis of principal components. For content validity, λ coefficients were calculated, taking values ≥0.30 as favorable, whereas the predictive validity in the percentage of explained variance for the items of each of the areas of the scale was estimated. It should be noted that, for the evaluation of the content validity of the total score, an extra-dimensional factorial analysis was performed.
Following the psychometric evaluation of the scale, the convergence between the 4 areas of development and the total score from the calculation of Spearman’s correlation coefficients were determined. Given the failure of the normality assumption evaluated based on the Lilliefors-corrected Kolmogorov-Smirnov test, this test was also used to compare the scores with age. In addition, the frequency distributions were performed for the 4 levels of development (Alert, Medium, Medium-High, and High) found in the 4 areas evaluated. They were compared according to gender and age group through the chi-square test for the linear trend.
The data were stored in a database and analyzed with the Statistical Package for Social Sciences for Windows® (IBM® SPSS® Statistics version 21.0) with a statistical significance of 0.05.
Ethical aspects
According to Resolution 8430 of the Ministry of Health of Colombia, the study was classified as a study with minimal risk. In this regard, the rights, the dignity, and the privacy of the subject of the study were respected. For children in whom abnormalities were detected, referral was made to a health services provider institution and to the entity administering benefit plans for their care and monitoring.
Results
Distribution by sex and age of the study subjects
A total of 50.4% (n=71) were female, and 49.6% (n=70) were male. In the distribution of groups, 6.4% (n=9) were between 13 and 24 months, 26.2% (n=37) between 25 and 36 months, 40.4% (n=57) between 37 and 48 months, and 27.0% (n=38) more than 48 months. The mean age was 40.9±10.1 months, ranging from 14 to 60 months, with 50% of the central values between 35 and 49 months.
Reproducibility and validity of the abbreviated scale of development
In the psychometric evaluation of the Abbreviated Scale of Development, particularly in reproducibility, Cronbach’s α of more than 0.85 was found, and the percentage of success in the internal consistency and discriminating power was higher than 90%; the evaluation of the validity of the scale found 100% success in the content validity of the dimensions related to motor skills and 91% for the total score. With regard to predictive validity, it was found that the scale items explained 52.3% of the variance in the child development results (Table 1).
| |
Gross Motor Skills |
Fine Motor-Adaptive Skills |
Listening and Language |
Personal -Social |
Total |
| DESCRIPTION |
| Mean ± SD |
28.6 ± 5.4 |
24.2 ± 4.2 |
24.8 ± 5.6 |
25.6 ± 5.0 |
103.2 ± 18.0 |
| Median (IR) |
28 (25–34) |
23 (22–27) |
25 (22–28) |
26 (22–29) |
102 (91–116) |
| Range |
17–37 |
12–37 |
8–36 |
11–36 |
55–143 |
| Floor Effect |
0.7 |
0.7 |
0.7 |
1.4 |
0.7 |
| Ceiling Effect |
7.1 |
0.7 |
1.4 |
0.7 |
0.7 |
| Reproducibility |
| Reliability |
| Cronbach’s α |
0.92 |
0.88 |
0.92 |
0.91 |
0.97 |
| Internal consistency: Item - Dimension Correlations to which it belongs |
| Range |
0.41–0.80 |
0.20–0.74 |
0.21–0.79 |
0.21–0.77 |
0.20–0.70 |
| % Success |
100 (20–20) |
96.0 (24/25) |
92.6 (25/27) |
92.0 (23–25) |
97.9 (95/97) |
| Discriminating power: Item - Dimension Correlations to which it does NOT belong |
| Range |
0.15–0.69 |
0.07–0.68 |
0.18–0.65 |
0.18–0.61 |
NA |
| % Success |
91.7 (55/60) |
97.3 (73/75) |
100 (81/81) |
97.3 (73/75) |
NA |
| VALIDITY |
| Content: λ coefficients |
| Range |
0.49–0.68 |
0.31–0.49 |
0.22–0.57 |
0.12–0.49 |
0.20–0.69 |
| % Success |
100 (20/20) |
100 (25/25) |
51.8 (14/27) |
56.0 (14/25) |
90.7 (88/97) |
| Predictive: Proportion of explained variance |
| Proportion |
26.7 |
11.9 |
8.5 |
5.2 |
52.3 |
SD: Standard Deviation. IR: Interquartile Range.
Note: In the psychometric assessment, items whose response was 1 in all of the evaluated sample are not included, which explains the difference in the denominator that appears in the internal consistency, discriminating power, and content validity of the 4 areas.
Table 1: Description and Evaluation of the Reproducibility and Validity of the Abbreviated Scale of Development.
In relation to the convergence of the 4 dimensions of the Abbreviated Scale of Development, statistically significant positive correlations of large magnitude were found, demonstrating the pertinence of the child development construct that evaluates the instrument (Figure 1).
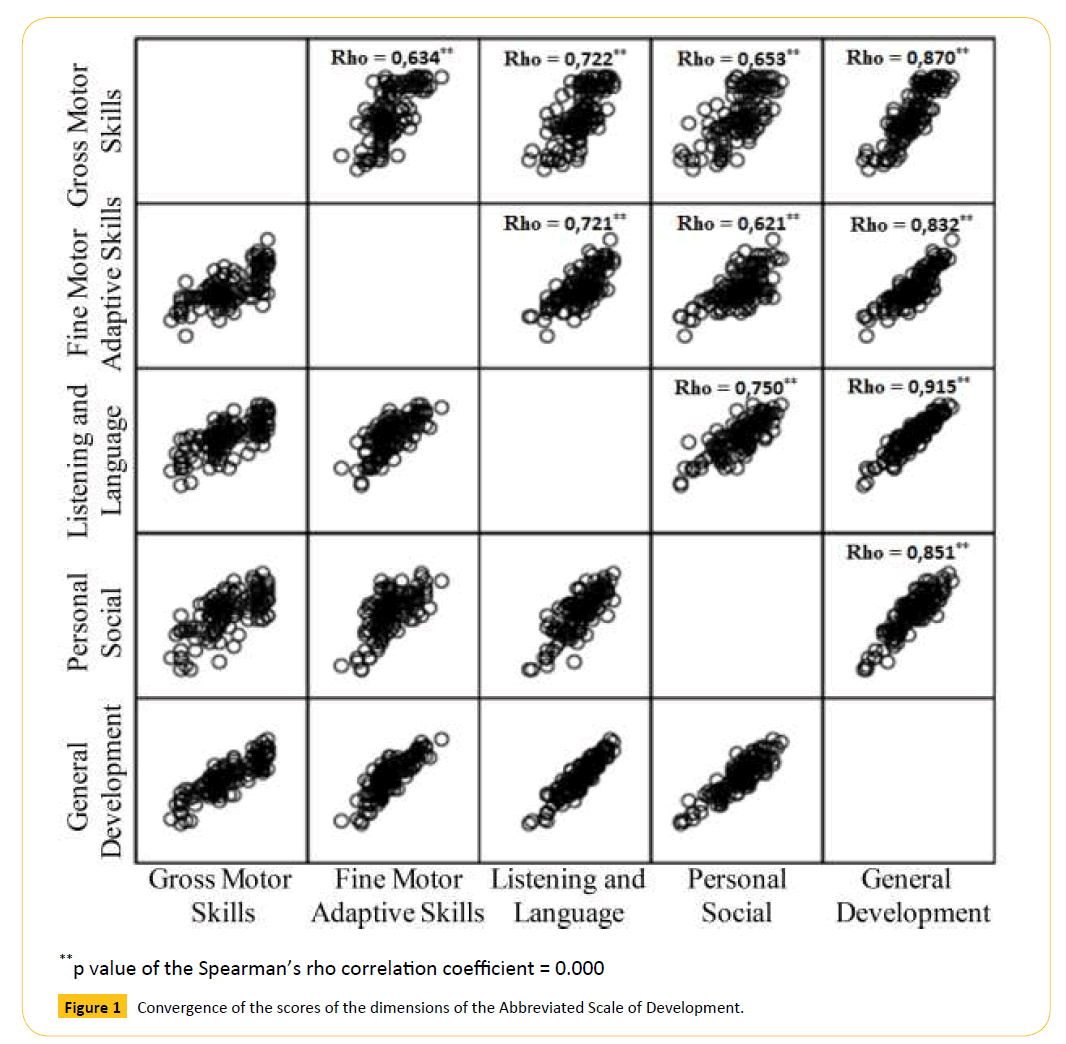
Figure 1: Convergence of the scores of the dimensions of the Abbreviated Scale of Development.
Frequency of abnormal child development
The dimensions that had the greatest number of children in the Alert level were Listening and Language and Personal-Social, with 15.6%. In the Medium level, the highest frequency was found in the Fine Motor-Adaptive Skills dimension, with 45.4%. In the High level, the dimension that had the highest frequency was Gross Motor Skills, with 24.8%. In the overall assessment of child development, 8.5% were found in the Alert level, 26.6% in the Medium level, and 48.9% in the High level (Figure 2).
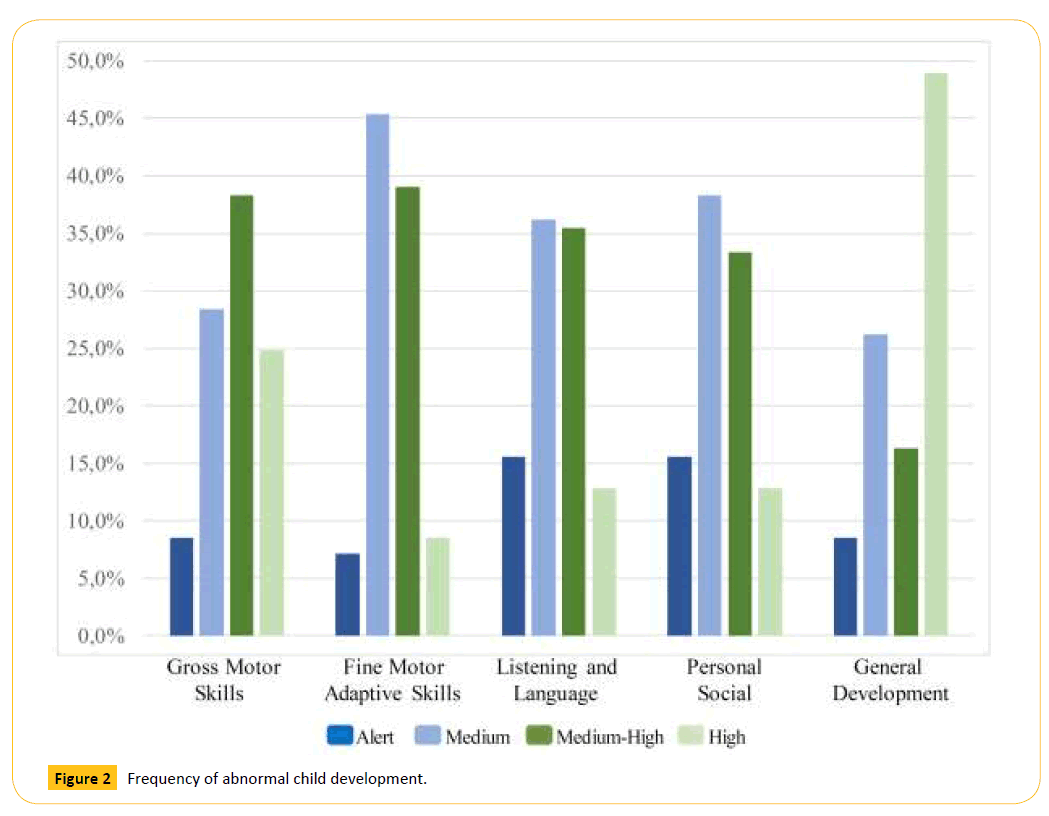
Figure 2: Frequency of abnormal child development.
Comparison of child development disorders by sex and age group
The level of child development did not differ according to gender, which is different from the analysis by age group, in which a statistical association was found in all dimensions of the Scale. In this sense, the Gross Motor Skills dimension presented a greater proportion of children in the Alert level in the group aged between 25 and 36 months (21.6%). In the Fine Motor-Adaptive Skills dimension, the highest frequency of children in the Alert level was observed in those over 48 months (10.5%) and between 13 and 24 months (11.1%). In Listening and Language and the Personal- Social dimensions, the age group with the highest frequency of children in the Alert level was between 13 and 24 months, with 22.2% and 33.3% affected, respectively. In the general evaluation of child development, the proportion of children in the Alert level was 22.2% between 13 and 24 months, 5.4% between 25 and 36 months, 10.5% between 37 and 48 months, and 5.3% in those over 48 months (Table 2).
| Dimension |
Sex % (#) |
Age group in months % (#) |
| Woman |
Man |
13–24 |
25–36 |
37–48 |
> 48 |
| Gross Motor Skills |
Alert |
8.5 (6) |
8.6 (6) |
0.0 (0) |
21.6 (8) |
5.3 (3) |
2.6 (1) |
| Medium |
31.0 (22) |
25.7 (18) |
11.1 (1) |
16.2 (6) |
49.1 (28) |
13.2 (5) |
| Medium-High |
36.6 (26) |
40.0 (28) |
33.3 (3) |
29.7 (11) |
14.0 (8) |
84.2 (32) |
| High |
23.9 (17) |
25.7 (18) |
55.6 (5) |
32.4 (12) |
31.6 (18) |
0.0 (0) |
| pVChi2 |
0.920 |
0.000** |
| Fine Motor-Adaptive Skills |
Alert |
7.0 (5) |
7.1 (5) |
11.1 (1) |
2.7 (1) |
7.0 (4) |
10.5 (4) |
| Medium |
40.8 (29) |
50.0 (35) |
22.2 (2) |
35.1 (13) |
59.6 (34) |
39.5 (15) |
| Medium-High |
39.4 (28) |
38.6 (27) |
44.4 (4) |
48.6 (18) |
24.6 (14) |
50.0 (19) |
| High |
12.7 (9) |
4.3 (3) |
22.2 (2) |
13.5 (5) |
8.8 (5) |
0.0 (0) |
| pVChi2 |
0.311 |
0.034* |
| Listening and Language |
Alert |
16.9 (12) |
14.3 (10) |
22.2 (2) |
18.9 (7) |
19.3 (11) |
5.3 (2) |
| Medium |
32.4 (23) |
40.0 (28) |
55.6 (5) |
18.9 (7) |
45.6 (26) |
34.2 (13) |
| MediumHigh |
38.0 (27) |
32.9 (23) |
11.1 (1) |
32.4 (12) |
24.6 (14) |
60.5 (23) |
| High |
12.7 (9) |
12.9 (9) |
11.1 (1) |
29.7 (11) |
10.5 (6) |
0.0 (0) |
| pVChi2 |
0.704a,b |
0.000** |
| Personal - Social |
Alert |
14.1 (10) |
17.1 (12) |
33.3 (3) |
8.1 (3) |
17.5 (10) |
15.8 (6) |
| Medium |
36.6 (26) |
40.0 (28) |
44.4 (4) |
32.4 (12) |
43.9 (25) |
34.2 (13) |
| Medium-High |
36.6 (26) |
30.0 (21) |
11.1 (1) |
35.1 (13) |
24.6 (14) |
50.0 (19) |
| High |
12.7 (9) |
12.9 (9) |
11.1 (1) |
24.3 (9) |
14.0 (8) |
0.0 (0) |
| pVChi2 |
0.854 |
0.025* |
| General Development |
Alert |
9.9 (7) |
7.1 (5) |
22.2 (2) |
5.4 (2) |
10.5 (6) |
5.3 (2) |
| Medium |
23.9 (17) |
28.6 (20) |
33.3 (3) |
27.0 (10) |
26.3 (15) |
23.7 (9) |
| Medium-High |
12.7 (9) |
20.0 (14) |
0.0 (0) |
37.8 (14) |
15.8 (9) |
0.0 (0) |
| High |
53.5 (38) |
44.3 (31) |
44.4 (4) |
29.7 (11) |
47.4 (27) |
71.1 (27) |
| pVChi2 |
0.500 |
0.001** |
pV: p Value. *pV<0.05. **pV<0.01.
Table 2: Comparison of Child Development Disorders by Sex and Age Group.
Age showed positive correlations of high magnitude with the score of Gross Motor Skills (Spearman’s rho=0.623), Fine Motor- Adaptive Skills (Spearman’s rho=0.721), Listening and Language (Spearman’s rho=0.704), Personal-Social (Spearman’s rho=0.591), and General Development (Spearman’s rho=0.745), all with p values of 0 significance.
Discussion
The psychometric properties that were evaluated indicate that the measurements generated with the scale are reproducible and valid; thus, its application is pertinent in children in Medellin with similar socioeconomic conditions.
Approximately one-third of the children had a degree of development in the Alert or Medium level, which demonstrates the high psychosocial and motor skills risk of this population. As noted above, there are no similar studies in our setting; thus, these results cannot be contrasted with those reported for other populations.
Early development is determined by the interaction of biological and social factors, which means that an elevated occurrence of psychosocial and motor skill disorders in early childhood are an indirect reflection of the degree of socioeconomic vulnerability and health not only of the children but of the general community in which they live. In this sense, the prevalence of children at the Alert level or Medium level of development is important evidence for focusing intervention and prevention programs in this population.
indirect reflection of the degree of socioeconomic vulnerability and health not only of the children but of the general community in which they live. In this sense, the prevalence of children at the Alert level or Medium level of development is important evidence for focusing intervention and prevention programs in this population. great variety in the profiles of individual development among children; therefore, in many cases, it is difficult to differentiate normal changes and maturation delays attributable to temporary or permanent disorders; and iv) the development of children unfolds along different and individual paths whose trajectories are characterized by continuities and discontinuities, in addition to a series of significant transitions [17].
Therefore, the possible extrapolation of the results of this population must be performed carefully, given the particularities of child development in each context; instead, these results should promote the development of similar studies for each particular population to evaluate whether children develop basic social and emotional skills from an early stage. This type of development becomes more relevant when we bear in mind that these skills are key to success at school age and in future life, given that a child with good psychosocial and motor skill development is selfconfident, friendly, has good relations with others, persists with challenging tasks, and has good linguistic development, among other beneficial factors for development [18].
In addition to evaluating the degree of child development, further research should evaluate the structural conditions of development, such as the poverty level of the family, parental educational level, parenting practices, lactation type, and the presence or absence of enabling environments for physical and psychological stimulation of the child [19-22]. It is important to differentiate structural causes, for which intervention by health teams is difficult, from more proximate causes that are inherent to behavior susceptible to modification in the short term. In this line of thought, it has been documented that improving the social conditions that generate family welfare, such as the provision of formal medical service and good health conditions in family members, which lead to appropriate care and practice, positively impacts the child’s skills [9,23].
With regard to age, it should be noted that the presence of malnutrition in the first 2 years of life leads to an increased risk for the development of all the capabilities of children and their survival, generating more profound bodily alterations [9,23].
Concerning the development scale, it should be clarified that it includes basic screening elements for the level of development, the detection of at-risk children, and the overall or general assessment of development. Nonetheless, the instrument cannot be taken as a facsimile of the comprehensive clinical evaluation of the development process; [10] instead it can be used as a method that transcends the checklists that apply in many health institutions in the country, which can be decisive for the detection of abnormal development in the context of primary health care and preventive medicine.
With regard to the psychometric properties evaluated in the 4 dimensions, excellent results were found for reliability, showing that the scale items are related, have a high level of consistency, and adequately describe child development. The percentage of success in the internal consistency and the discriminating power shows that the points of each dimension of development properly measure and do not interfere with or measure content related to the other areas of the scale. In regard to convergent validity, it was confirmed that the 4 dimensions are correlated, which accounts for its conceptual consistency around the development construct. Furthermore, the content validity and predictive validity show that the items of the scale measure what they were intended to do.
The study limitations should explicitly assert the need to evaluate other psychometric properties, such as sensitivity to change, discriminant validity in sick and healthy groups, and test-retest reliability. It should also be noted that the measurement can be conditioned to the degree of trust established by the doctor with the child, meaning that further training should enable educators with whom the child has more contact to apply the scale.
Conclusions
This type of research is useful for promoting decision-making based on evidence for improving quality of life and child welfare. The excellent reproducibility and validity demonstrate the availability of a scale for screening child development in Medellin. The high frequency of children with psychomotor and social development at the Medium or Alert level corroborates the need to improve clinical interventions, public health, and education policy for this group.
Acknowledgements
To the Cooperative University of Colombia and participants
Conflict of Interest
None.
Funding
Universidad Cooperativa de Colombia [Cooperative University of Colombia], Metrosalud Medellín [Medellin Metro-health].
7586
References
- Ben AA (2008) Indicators and indices of children’s well-being: Towards a more policy-oriented perspective. Eur J Educ 43: 37-50.
- Ben AA (2008) The child indicators movement: Past, present, and future. Child Ind Res 1: 3-16.
- De Castro F, Allen LB, Katz G, Salvador CL, Lazcano PE (2013)Child wellbeing and development indicators in Mexico. SaludPúblicaMéx 55:267-275.
- Pollitt E, Golub M, Grantham S, Levitsky D, Schürch B, et al. (1996) A reconceptualization of the effects of undernutrition on children’s biological, psychological, and behavioral development (Social Policy Report). Society for Research in Child Development 10:1-22.
- Sazawal S, Bentley M, Black RE, Dhingra P, George S, et al. (1996) Effect of zinc supplementation on observed activity in low socioeconomic Indian preschool children. Pediatr 98:1132-1137.
- Wachs TD (2000) Nutritional deficits and behavioural development. Int J BehavDev 24:435-441.
- Hughes D, Bryan J (2003)The assessment of cognitive performance in children: Considerations for detecting nutritional influences. Nutrition Reviews 61:413-422.
- Drewett R, Wolke D, Asefa M, Kaba M, Tessema F (2001) Malnutrition and mental development: Is there a sensitive period? A nested case-control study. J Child Psychol Psychiatry 42:181-187.
- Cortes A, Aviles A (2011)Factoresdemográficos, crianza e historia de salud: Vinculación con la nutrición y el desarrolloinfantil. UniversitasPsychol 10:789-802.
- Ministerio de SaludRepública de Colombia, Ortiz N EscalaAbreviada de Desarrollo, 1999. Available at: https://www.envigado.gov.co/ Secretarias/SecretariadeSalud/documentos/Prestacion% 20de%20servicios/ciclo%20de%20capacitaciones/crecimiento%20y%20desarrollo/ ESCALA%20ABREVIADA%20DE%20DESARROLLO%20UNICEF%20COLOMBIA.pdf (Accessed November 20, 2014).
- Muñoz A, Zapata H, Pérez L (2013)Validación de criterio de la EscalaAbreviada del Desarrollo (EAD-1) en el dominioaudición-lenguaje. Rev SaludPública 15:386-397.
- Hormiga CM, Camargo DM, Orozco LC (2008) Reliability and convergent construct validity of the abridged development scale and a Spanish translation of the Neurosensory Motor Development Assessment. Biomédica 28:327-346.
- Chopra M (2003) Risk factors for undernutrition of young children in a rural area of South Africa. Public Health Nutr 6:645-652.
- Myers R (1993)Comprensión de lasdiferenciasculturales en lasdistintasprácticas y creenciasrelativas a la crianza de los niños. En Myers R. Los docequesobreviven. Washington, DC: OrganizaciónPanamericana de la Salud.
- Peña M, Bacallao J (2002) Malnutrition and poverty. Annu Rev Nutr 22:241-253.
- Suárez H, Hernández N, Arbeláez S, Zapata L (2012)Ciudadela Nuevo Occidente: entre expansión, reubicación y territoriosevocados.
- Shonkoff J, Phillips D (2000) De lasNeuronas al vecindario: la cienciadeldesarrolloinfantiltemprano. Washington, DC: Prensa de la Academia Nacional.
- Cox M, Rimm, Pianta R (2000)Juicios de unprofesorfrente a los problemas en la transición al preescolar. Publicación Trimestral de InvestigaciónSobre la PrimeraInfancia 15:147-166.
- AvilaCA, Chávez VA, ShamahLT, Madrigal FH (1993) Child malnutrition in the Mexican rural environment: An analysis of national nutrition surveys. SaludPúblicaMéx 35:658-666.
- Black MM (2003) Micronutrient deficiencies and cognitive functioning. J Nutr 133:3927-3931.
- Hernández D, Barberena C, Camacho J, Vera H (2003)Desnutricióninfantil y pobreza en México, SerieCuadernos de DesarrolloHumano, 12. México: Secretaría de Desarrollo Social.
- Poehlmann J, Fiese BH (2001) Parent-infant interaction as a mediator of the relation between neonatal risk status and 12-month cognitive development. Infant BehavDev 24:171-188.
- Lima MC, Eickmann SH, Lima AC, Guerra MQ, Lira PI, et al. (2004) Determinants of mental and motor development at 12 months in a low income population: A cohort study in northeast Brazil. ActaPaediatr 93:969-975.