Hsi-Jen Chiang1,2, Heng-Jui Hsu1,3, Keng-Liang Ou1,2,4,5*, Han-Yi Cheng1,2,4*
1Research Center for Biomedical Devices and Prototyping Production, Taipei Medical University, Taipei 110, Taiwan
2Graduate Institute of Biomedical Materials and Tissue Engineering, College of Oral Medicine, Taipei Medical University, Taipei 110, Taiwan
3School of Dentistry, College of Oral Medicine, Taipei Medical University, Taipei 110, Taiwan
4Research Center for Biomedical Implants and Microsurgery Devices, Taipei Medical University, Taipei 110, Taiwan
5Department of Dentistry, Taipei Medical University-Shuang Ho Hospital, Taipei 235, Taiwan
Corresponding Authors:
Han-Yi Cheng
Graduate Institute of Biomedical Materials and Tissue Engineering
College of Oral Medicine, Taipei Medical University, Taipei 110, Taiwan
Tel: 4886-2-27361661
E-mail: chytmu@gmail.com
Keng-Liang Ou
Department of Dentistry, Taipei Medical University-Shuang Ho Hospital
Taipei 235, Taiwan
Tel: 886-2-27361661
Fax: 886-2-27395524
E-mail: chytmu@gmail.com
Citation: Hsi-Jen C, Heng-Jui H, Keng-Liang O, Han-Yi C. Research of Hemodynamics Behaviors on Vascular Artery with Stenoses: Computer-Aided Analysis and Angiographic Examination. J Biomedical Sci. 2015, 4:1. doi:10.4172/2254-609X.10005
Copyright: © 2015 Hsi-Jen C. This is an open-access article distributed under the terms of the Creative Commons Attribution License, which permits unrestricted use, distribution, and reproduction in any medium, provided the original author and source are credited.
Keywords
Angiography, Blood flow, Computer-aided, Image processing, Stenoses
Introduction
Angiography has been an acceptable method to understand blood vessels of the human body and has been important for the study of flow phenomenon and stress fields of the cardiovascular system [1]. The purpose of the present research is to calculate the blood flow variations on a vascular stenoses through angiographic image analysis and to detect vascular abnormalities and lesions. Furthermore, it serves as an important reference for doctors during diagnosis and treatment [2-5]. Non-invasive three-dimensional (3-D) blood pressure and flow data can indicate disease outcomes [6,7]. In recent years, remarkable progress has been made in simulating blood flow using realistic anatomical models constructed from 3-D medical imaging data. Arguably, accurate anatomical models are the primary method for simulating blood flow. However, realistic boundary conditions are equally important for computing velocity and pressure fields. In this study, significant progress has been made in devising outflow boundary conditions for solving the equations of blood flow in elastic vessels.
Vascular disease is a major cause of death for human beings. A stent is a common choice for treating a stenoses in the vascular artery. To prevent restenoses, various surface treatments have been applied to the stents [8,9]. Circulatory disease remains the main factor, even if the medical technology has been developed for a long time. While William Harvey developed the cycle theory in the early 17th century, various scientists have continued this research [10]. The 3-D reserved simulation models of cardiovascular circulation were published 300 years ago. Because each model is based on different assumptions, it remains difficult to validate results compared with real subjects. In 1896, Poiseuille was one early individual to detail the steadystate relationship between flow and pressure in a cylindrical tube [11]. He considered that pressure is maintained during blood flow through the arterial system. Poiseuille's law describes the relationship of pressure, blood flow, and blood vessel size. The results of the current study utilize this law to describe the pressure, flow, fluid properties, and relationship between a blood vessel and stenoses sizes. Therefore, the aim of this study is to demonstrate stenotic properties using angiographic and computer-aided models. Arterial blood flow velocities in hearts and arms were compared, and we further investigated the stress distributions in models with different stenoses thicknesses.
Materials and Methods
Angiographic tests
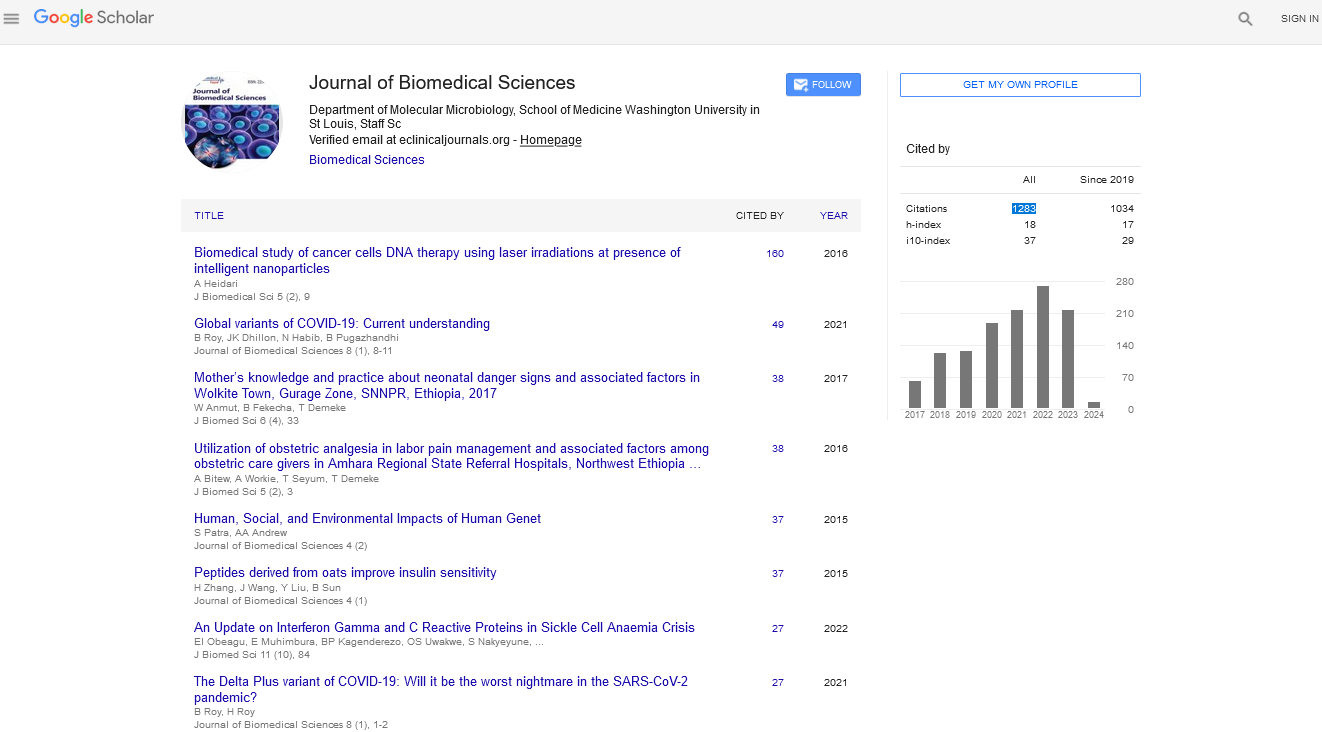
Angiography is a biomedical imaging technique used to visualize blood vessels of the human body, such as arteries, veins, and heart chambers. The blood vessels can be observed using contrast media, as shown in Figure 1. Nine volunteers were enrolled, and three cases were selected in each of the heart and arm groups. The remaining three volunteers without stenoses were selected for the control group. After angiographic test, the special range of gray scale was adopted for capturing the blood to calculate the blood flow velocity.
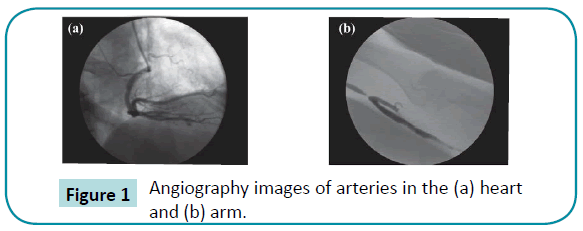
Figure 1: HPLC chromatogram of the nine reference compounds in 50% aqueous methanol, measured at 370nm. Retention times for rutin, sutherlandin A, sutherlandin B, kaempferol-3-O-rutinoside, sutherlandin C, sutherlandin D, quercitrin, quercetin and kaempferol were 11.9, 12.7, 13.8, 15.3, 16.2, 17.0, 18.0, 26.2 and 28.1 minutes, respectively.
Three-dimensional model analysis
Finite element methods can be easily used in a variety of projects. It is important to define boundary conditions in the model and incorporate these parameters into the program. Blood flow in the artery is considered incompressible and can be described by the Navier-Stokes continuity equations. The governing equations are written as follows for a computational domain [12]:
where ui is the velocity in the ith direction (i = 1, 2, and 3, which denotes the x-, y-, and z-directions, respectively), P is the pressure, fi is the body force, ρ is the density, μ is the viscosity, and δij is the Kronecker delta.
The 3-D image models were constructed using the ANSYS Workbench 12.1 (ANSYS, Inc.) finite element program. The vascular stents and arteries were regarded as continuous integers. An artery model (outer diameter of 4.5 mm and thickness of 0.5 mm) was created with stenoses (thickness: 0, 0.5, and 1 mm). The hyperelastic material rule, which describes the biomechanical properties of soft tissues according to the hyperelasticity theory, was adopted to predict the initial response of the stress–strain relationship. Two important processes are the converging and reinforcing of the mesh, which allow the model to approximate the actual object more accurately. Because of the deformation requirement, three types of elements were used in the present models. 8-node hyperelastic elements (Hyper58) were adopted in the artery and stenoses. The numbers of nodes and elements were 32,212-34,570 and 18,321-19,411, respectively. The biomechanical properties of the artery and plaque have been described previously in the literature [13,14]. A pulse function was chosen to simulate the heartbeat. When the heart beats, the force driving the blood flow maintains the blood circulatory system.
For this study, the parameters were categorized into two groups on the basis of the angiographic tests and 3-D reversed model analyses. The thicknesses of these stenoses varied from 0 (control group) to 1 mm, and we examined the blood flow velocity and vascular stress of the artery in al.
Statistical analysis
Data were expressed as mean ± standard error of the mean and were analyzed using analysis of variance (ANOVA). All statistical analyses were performed using SPSS version 12.0 (SPSS, Inc., Chicago, IL, USA). Values of p < 0.05 were considered significant.
Results
Velocity decreased significantly in arteries with a stenoses in the 3-D blood flow models. Figure 2 shows the velocity distributions for the vascular model with 0 and 1 mm stenoses from 0 to 0.01 seconds. The highest velocity of blood flow in the control group was 0.207 m/s, and the velocities in the stenoses group varied from 0.115 to 0.169 m/s (Figure 3a). On the other hand, the velocity vector distributions were more uniform among the arteries with thinner stenoses. Remarkably, the maximum velocity was decreased by approximately 43.96% for the 1 mm stenoses group, relative to the control group. The stress distributions showed significant concentration of stress in the 1 mm stenoses group. Stenotic structures had the potential to increase the abnormal stress concentration for the arteries. Of all the arteries, the maximum stress was observed at the stenotic structure’s contact area, and the highest stress in the artery was 2.5 times higher in the 1 mm stenoses group than in the control group (Figure 3b). Therefore, the data analysis indicated that the stenoses stressed the arteries and increased the velocity of the blood flow.
Figure 2: HPLC chromatogram of the nine reference compounds in 50% aqueous methanol, measured at 370nm. Retention times for rutin, sutherlandin A, sutherlandin B, kaempferol-3-O-rutinoside, sutherlandin C, sutherlandin D, quercitrin, quercetin and kaempferol were 11.9, 12.7, 13.8, 15.3, 16.2, 17.0, 18.0, 26.2 and 28.1 minutes, respectively.
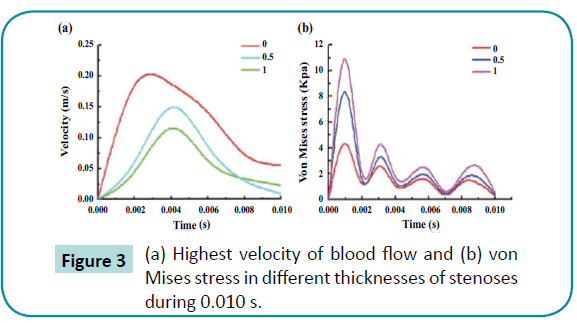
Figure 3: HPLC chromatogram of the nine reference compounds in 50% aqueous methanol, measured at 370nm. Retention times for rutin, sutherlandin A, sutherlandin B, kaempferol-3-O-rutinoside, sutherlandin C, sutherlandin D, quercitrin, quercetin and kaempferol were 11.9, 12.7, 13.8, 15.3, 16.2, 17.0, 18.0, 26.2 and 28.1 minutes, respectively.
Figure 4 describes the results of the angiographic test and pixel analysis using the computer-aided method in the arm of one of the three patients with stenoses. The velocity decreased in the stenoses. The blood velocity decreased significantly compared to the initial velocity, which indicates blood flow was blocked by the stenoses in the arm. This result was similar to that from the computer-aided simulation. On the other hand, the pixel images obtained while the heart was beating are shown in Figure 5. There were significant differences in the maximum velocities of the heart artery with stenoses, and the velocity tended to be less than the one without the stenoses. Stenoses decreased the velocity in the arteries for both the arm and heart.
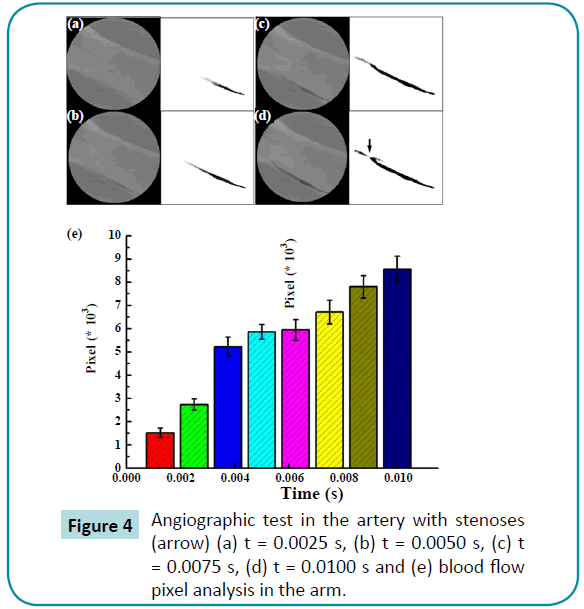
Figure 4: HPLC chromatogram of the nine reference compounds in 50% aqueous methanol, measured at 370nm. Retention times for rutin, sutherlandin A, sutherlandin B, kaempferol-3-O-rutinoside, sutherlandin C, sutherlandin D, quercitrin, quercetin and kaempferol were 11.9, 12.7, 13.8, 15.3, 16.2, 17.0, 18.0, 26.2 and 28.1 minutes, respectively.
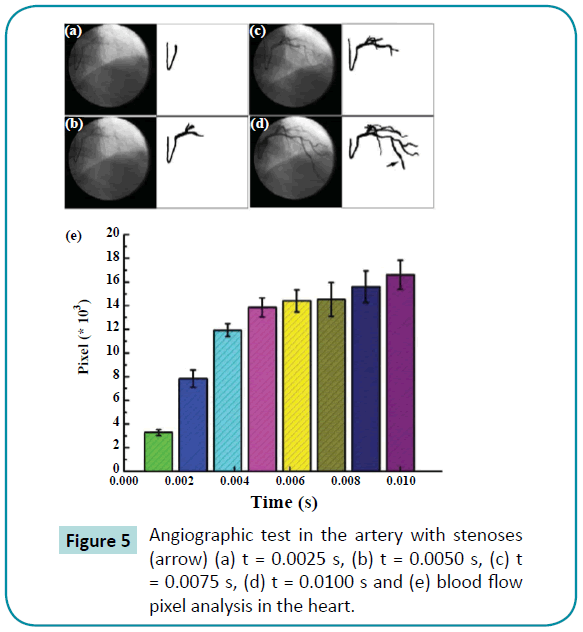
Figure 5: HPLC chromatogram of the nine reference compounds in 50% aqueous methanol, measured at 370nm. Retention times for rutin, sutherlandin A, sutherlandin B, kaempferol-3-O-rutinoside, sutherlandin C, sutherlandin D, quercitrin, quercetin and kaempferol were 11.9, 12.7, 13.8, 15.3, 16.2, 17.0, 18.0, 26.2 and 28.1 minutes, respectively.
We found that a stenoses decreased the blood flow velocity and induced abnormal stress in the artery, which provides information for clinical diagnosis and treatment as stress is a strong biological trigger that directs atherosclerosis protection. This parameter may also provide a predictive value for pinpointing regions at risk of restenoses.
Discussion
It is imperative to incorporate mechanical properties of a diseased vessel segment into treatment planning. Vascular wall stress has been successfully adopted to predict injury imposed by stent deployment [15]. We propose an image algorithm to estimate the flow vector field around a stenotic vascular segment and to derive the vascular wall stress based on a routine angiography. The results correlated well with measured blood flow and, therefore, indicate the feasibility for use in tissue characterization with routine angiography. With this technique, severely calcified lesions, such as those seen in older patients or patients with endstage renal disease, can be characterized in detail. In particular, the boundaries of non-continuous stenotic segments can be objectively identified and add to the visual estimation of narrowed lumen for interventional decision-making. Furthermore, stress along the vascular wall also contributes to the derived stress estimate. As stress is a strong biological trigger that directs atherosclerosis protection, this parameter may also provide a predictive value for pinpointing regions at risk of restenoses.
Angiography image analysis uses many kinds of processing methods, such as gray-scale discriminations, Sobel Filtering, background subtraction, and time difference between frames, to track and detect contours of objectives [5,16,17]. The present study has rebuilt the vascular structure using a similar method. All of the gray-scale images were processed to detect contours and to eliminate noise by combining a background subtraction method with a time difference between frames method.
Stents have been used in clinical practice to treat stenoses, and many clinical studies have shown that different restenoses rates occur in vascular and other stents. A restenoses rate of about 20- 50% was previously reported [18,19]. Overloading may provoke a greater response to injury of the vessel wall, ultimately inducing restenoses. Prendergast compared two different vascular stent designs, the S7 (Medtronic AVE) and the NIR (Boston Scientific) [15]. The results of the vessel wall stresses in the stented arteries indicated that the S7 stent design caused a lower stress to stenotic vessels compared to the NIR stent. These results showed higher restenoses rates in the NIR design compared with the S7 design. However, the influences of angioplasty balloon configurations were also studied in previous research [20,21]. A variety of typical angioplasty balloons were determined to influence of the deployment of a stent. The results of this study indicated that balloon configuration has not only a significant influence on the transient behavior of the vascular stent, but also on the mechanical environment of the artery. The function of a vascular stent in curved and straight vessels were compared in 2006 [22]. The results show that the curved vessel model was straightened by the stent, and a hinge effect could be observed at the stent. The maximum tissue prolapse of the curved vessel model was more severe than that of the straight one. The minimum lumen area of the curved vessel was decreased compared to that of the straight vessel model. The highest stresses in the vessel were concentrated in the inner curvature of the curved vessel model, and the stress distribution of the curved vessel is similar to the present results.
Finite element models are used in mechanical engineering analysis and design to evaluate potential decay. They have been successfully applied in biological applications and in various medical devices. In the biomedical field, models have been used to determine stresses in different biological structures, such as facial skeletons, dental implants, and vascular stents.
Most of these finite element analyses were used to assess the biomechanical behavior of individual structures or materials. However, biomechanical, finite element models of the blood flow of the artery are not perfect. On the whole, they are based on a number of assumptions and simplifications [23]. It is difficult to accurately compare our results with those obtained using finite element models in previous studies because of the various differences in the material properties, mesh structure, and constrained conditions employed in these models. In this study, two main materials were considered: blood and vessel tissue. Although the maximum stress of the artery was in a reasonable range for the vessel tissue material, consideration of fatigue damage was necessary because many vascular clinical problems are caused by fatigue destruction induced by blood flow. The stresses of all elements were increased by the stenotic effects. The stenoses not only induced biomechanical tissue, but also exhibited severe biological symptoms, as described previously in the literature [24]. Our study has provided useful information on the stress distributions in arteries and the velocities of blood flow in a stenoses. The limitations of our study are as follows: (1) we adopted a uniform type of heartbeat input, (2) the biological properties of the artery were not taken into account, and (3) the model did not include the influence of a real vessel structure. It is important to incorporate biomechanical properties of a stenotic vessel segment into clinical research. We will continue investigating the vascular wall stress, specifically related to the topic of predicting injury imposed by stent deployment. Stress along the vascular wall is considered to contribute to the risk of restenoses.
Conclusion
Although many previous studies have used angiographic tests and computer-aided models to examine stenoses, few models have illustrated the effects of the vascular artery with stenoses. Overloading may provoke a greater response to injury on the vessel wall, ultimately resulting in complex symptoms. Therefore, the stress of the artery with stenoses is considered to be an important issue. Our results confirm that stenoses decreases blood flow velocities and induces abnormal stresses in the vascular wall, which provides information for clinical diagnosis and treatment. Stress is a strong biological trigger that directs atherosclerosis protection. This parameter may also provide a predictive value for pinpointing regions at risk of restenoses after treatment. As described above, the present data shows that this could be potentially beneficial for understanding the properties of vascular arteries with stenoses.
Acknowledgment
The authors would like to thank the Department of Health, Executive Yuan, Taiwan for financially supporting this research under contract No. MOHW103-TDU-N-211-133001 and No. MOHW103-TD-B-111-01 (Health and welfare surcharge of tobacco products).
6521
References
- Vignon-Clementel, IE, Figueroa CA, Jansen KE, Taylor CA (2006) Outflow boundary conditions for three-dimensional finite element modeling of blood flow and pressure in arteries. Computer Methods in Applied Mechanics and Engineering 195: 3776-3796.
- Hollnagel DI, Summers PE, Poulikakos D, Kollias SS (2009) Comparative velocity investigations in cerebral arteries and aneurysms: 3D phase-contrast MR angiography, laser Doppler velocimetry and computational fluid dynamics. NMR Biomed 22: 795-808.
- Urquiza SA, Blanco PJ, Vénere MJ, Feijóo RA (2006) Multidimensional modelling for the carotid artery blood flow. Computer Methods in Applied Mechanics and Engineering 195: 4002-4017.
- Taylor CA, Hughes TJ, Zarins CK (1998) Finite element modeling of three-dimensional pulsatile flow in the abdominal aorta: relevance to atherosclerosis. Ann Biomed Eng 26: 975-987.
- Bazan C, M Miller, PBlomgren (2009) Structure enhancement diffusion and contour extraction for electron tomography of mitochondria. J StructBiol 166: 144-155.
- Taylor CA, Draney MT, Ku JP, Parker D, Steele BN, et al. (1999) Predictive medicine: computational techniques in therapeutic decision-making.Comput Aided Surg 4: 231-247.
- Lenfant C (2002) Report of the Task Force on Research in Pediatric Cardiovascular Disease. Circulation 106: 1037-1042.
- Ye X (2015)Enhanced grain refinement and microhardness of Ti–Al–V alloy and hardening effects of Ti–Al–V alloy by electropulsing ultrasonic shock. Journal of Alloys and Compounds 621: 66-70.
- Ye X, Y Yang, G Tang (2014) Microhardness and corrosion behavior of surface gradient oxide coating on the titanium alloy strips under high energy electro-pulsing treatment. Surface and Coatings Technology 258: 467-484.
- Kidson IG (1983) The effect of wall mechanical properties on patency of arterial grafts. Ann R CollSurgEngl 65: 24-29.
- Jeffords JV, Knisely MH (1956) Concerning the geometric shapes of arteries and arterioles; a contribution to the biophysics of health, disease and death. Angiology 7: 105-136.
- Oshima, M, Kobayashi T, Torii R, Taniguchi N, Takagi K (2001) Finite element simulation of blood flow in the cerebral artery. Computer Methods in Applied Mechanics and Engineering 191: 661-671.
- Jin-Won Chunga, b, Churl-Seung L, Dae-Hong K, Jun HH, Kwang YE, et al. (2001) Biaxial elastic modulus of very thin diamond-like carbon (DLC) films. Diamond and Related Materials 10:2069-2074.
- Heckmann, O, H Magnan, P le Fevre, D Chandesris, JJ Rehr (1994) Crystallographic structure of cobalt films on Cu(001): elastic deformation to a tetragonal structure. Surface Science 312: 62-72.
- Lally C, Dolan F, Prendergast PJ (2005) Cardiovascular stent design and vessel stresses: a finite element analysis. J Biomech 38: 1574-1581.
- Bouma CJ,Niessen WJ, Zuiderveld KJ, Gussenhoven EJ, Viergever MA (1997) Automated lumen definition from 30 MHz intravascular ultrasound images. Med Image Anal 1: 363-377.
- Pugliese F,Weustink AC, Van Mieghem C, Alberghina F, Otsuka M, et al. (2008) Dual source coronary computed tomography angiography for detecting in-stent restenosis. Heart 94: 848-854.
- Colombo A,Stankovic G, Moses JW (2002) Selection of coronary stents. J Am CollCardiol 40: 1021-1033.
- Grewe PH, Deneke T, Machraoui A, Barmeyer J, Müller KM (2000) Acute and chronic tissue response to coronary stent implantation: pathologic findings in human specimen. J Am CollCardiol 35:157-163.
- Liang DK, Yang DZ, Qi M, Wang WQ (2005) Finite element analysis of the implantation of a balloon-expandable stent in a stenosed artery. Int J Cardiol 104: 314-318.
- Rogers C, Tseng DY, Squire JC, Edelman ER (1999) Balloon-Artery Interactions During Stent Placement: A Finite Element Analysis Approach to Pressure, Compliance, and Stent Design as Contributors to Vascular Injury. Circ Res84:378-383.
- Wu W, Wang WQ, Yang DZ, Qi M (2007) Stent expansion in curved vessel and their interactions: a finite element analysis. J Biomech 40: 2580-2585.
- Tanaka E, K Tanne, M Sakuda (1994)A three-dimensional finite element model of the mandible including the TMJ and its application to stress analysis in the TMJ during clenching. MedEngPhy 16: 316-322.
- Lee FP, Wang DY, Chen LK, Kung CM, Wu YC, et al. (2013) Antibacterial nanostructured composite films for biomedical applications: microstructural characteristics, biocompatibility, and antibacterial mechanisms. Biofouling 29: 295-305.