Keywords
Electroencephalogram; Epileptic seizure prediction; Normalized Logarithmic Wavelet Packet Coefficients Energy Ratios (NLWPCER); Feature representation learning
Introduction
Epilepsy constitutes a chronic brain disorder. It affects almost 1% of the world’s population. This neurological ailment is associated with recurrent, unprovoked epileptic seizures resulting from a sudden disturbance of brain function. One particular disabling aspect of epileptic seizures is their sudden and unpredictable nature, limiting patients’ activities and resulting in poor quality of life. Common treatment for epilepsy is through medication and surgery but these not only have grave repercussions or side effects [1] but also fail to satisfactorily control seizures in approximately one-third of affected patients. A reliable seizure prediction system based on electroencephalogram (EEG) may significantly enhance the quality of life and safety of sufferers and increase the chance of controlling seizures by administering therapeutic agents as early as possible.
Seizure prediction is based on the hypothesis that there exists a transition state (preictal) between the interictal (normal) and the ictal (seizure) states. There are numbers of clinical evidence that support this hypothesis. These include increases in cerebral blood flow [2] and cerebral oxygenation [3]. Accordingly, researchers have invested a great deal of effort over the last decades on attempting to predict epileptic seizures based on EEG signals.
Le et al. [4] proposed a method to anticipate seizures using the similarity between an interictal reference and the current windows of EEG based on a nonlinear analysis of zero-crossing intervals. They applied this algorithm to scalp EEG signals from 23 patients with temporal lobe epilepsy (TLE) which resulted in 96% sensitivity and an average anticipation time of 7 min. Analyzing depth EEG recordings from five patients with TLE, Iasemidis et al. [5] developed an adaptive seizure prediction method based on the convergence of the “short-term maximum Lyapunov exponents” of the critical electrodes. They reported 82.6% sensitivity along with a false prediction rate of 0.17 h-1 (preictal periods were not excluded) and an average prediction time of 100.3 min for a test dataset. Hively and Protopopescu [6] proposed a channel-consistent epileptic seizure prediction approach based on phase-space dissimilarity measures and applied it to surface EEG from 41 patients resulting in a sensitivity of 87.5% with a false positive rate of 0.021 h-1 and an average prediction time of ∼35 min. In a work reported by Chisci et al. [7], the performance of an algorithm based on AR modeling of EEG signals was assessed using intracranial recordings from nine patients. A nonlinear support vector machine (SVM) with a Gaussian kernel was employed to classify a feature vector made up of the Auto Regressive (AR) coefficients for each multichannel EEG epoch, where a Kalman filtering procedure was considered in the post processing step. The study reported 100% sensitivity and the average false prediction rate and average prediction time, respectively, ranging from 0 to 0.60 h-1 and ∼5 to 92 min.
Many of the early seizure prediction studies showed that features derived through linear and non-linear EEG analysis were successful in detecting changes within minutes to hours before seizure onset [8]. However, it was later discovered that these studies suffer from serious methodological and statistical fl aws as later research works gave contradictory seizure predictability results [9-13]. Therefore, the question of seizure predictability appears open due mainly to methodological and statistical fl aws in several of the literature reports [14]. To promote methodological quality and practical assessment of seizure prediction algorithms, guidelines and statistical frameworks have been proposed [15-20].
Generally, the guidelines proposed by Mormann et al. [14] as requirements for a practical prediction method can be summarized as follows:
• The prediction power of an algorithm should be demonstrated through prospective randomized controlled tests using longlasting, continuous and unseen EEG recordings.
• Test data should be independent from any training data that is used to optimize the algorithm.
• The performance of an algorithm should be reported in terms of sensitivity and specificity on the test data.
• Since an average of 3.6 seizures per day (i.e., 0.15 seizures per hour) is recorded during epilepsy monitoring [21], false prediction rates which are measure specificity above 0.15/h are deemed questionable.
• For algorithms designed to drive interventional devices the minimum intervention time (IT) defined as the minimum interval between an alarm and the beginning of the prediction horizon [11] must be used as additional constraint when evaluating seizure prediction performance.
After the introduction of the seizure prediction method guidelines discussed above, many researchers have published series of articles showing various level of conformity to these guidelines and utilizing several time, frequency and time-frequency domain techniques either in a linear or nonlinear fashion [7,22,23]. Despite the promising results reported in these research works, there still seems to be no end in sight to the seizure prediction challenge as no method exists to date that is robust and consistent enough for clinical deployment. Therefore, there is need to explore and exploit new methods for seizure prediction. In the current study a new seizure prediction approach is presented following the seizure prediction guidelines described above. Since scalp and intracranial EEG possess a characteristic pattern that varies across individuals with epilepsy both in non-seizure and seizure states [24], the method presented here resulting in seizure prediction algorithms is patient specific.
The method uses state of the art unsupervised feature representation learning techniques (reconstruction independent component analysis [25] and sparse filtering [26]) in an adaptive manner to obtain useful representation of a newly engineered EEG feature: Normalized Logarithmic Wavelet Packet Coefficients Energy Ratio (NLWPCER) which is derived from EEG Wavelet Packet Transform [27] to predict seizures. Unsupervised feature representation learning consists of set of methods that map input features (engineered or “low level features”) to new output features (“high level features”) without any information about class labels (i.e., pre-siezure or normal) of data. Coates et al. [28] clearly showed that very simple unsupervised learning algorithms (such as k-means clustering), when properly tuned, can generate representations of the data that allow even basic classifiers, such as a linear support vector machine, to achieve state-of-the-art performances. The general idea behind representation learning is to learn a transformation that maps data in a low-level feature (engineered features) space into high level feature space where classification rule is easier to learn, and the generalizing ability of classifier is improved Specifically, sparse filtering and reconstruction independent component analysis were used to improve classification accuracy of normal and pre-seizure intracranial EEG (iEEG) feature vectors. In addition, the present study seeks to carry out a prospective seizure prediction study on long term scalp EEG (sEEG) recordings of patients with intractable seizures. Scalp EEG data made available for researchers by Massachusetts Institute of Technology (MIT) and Children’s Hospital Boston (CHB) was used. The database consists of scalp EEG recordings from twenty-three patients with intractable seizures.
To test the proposed method for prospective seizure prediction, two classifiers: support vector machine (SVM) and artificial neural network (ANN) were developed and trained to recognize and classify normal and pre-seizure EEG feature vectors. Results from model evaluation as well as other unresolved issues in seizure prediction problem such as sensitivity of seizure parameters especially the prediction time on the theoretical methodology used for prediction are discussed. The performance of the proposed method was compared with other published methods.
Methodology
We present a detailed account of the proposed seizure prediction method. Described in the method are three distinct novel contributions to seizure prediction studies. In section 2.2.1, a newly engineered EEG feature (Normalized Logarithmic Wavelet Packet Coefficients Energy Ratio, NLWPCER) for seizure prediction is introduced. In section 2.2.2, the use of two powerful feature learning,/representation algorithms (Sparse Filtering and Reconstruction Independent Component Analysis) is introduced in seizure prediction studies for high level feature extraction. Feature learning algorithms have been shown to improve computer vision (image recognition or classification) tasks and speech recognition tasks in recent studies [25,29-31]. RICA and SF learned representations lead to improved preictal (presiezure) and normal (interictal) classification accuracies. Lastly, optimal hyperparameters configuration of the representation learning function (adaptation) and classification algorithm used for the proposed seizure prediction method were obtained through Bayesian optimization technique. Figure 1 gives schematic representation of the proposed method. The detailed procedure is presented in what follows.
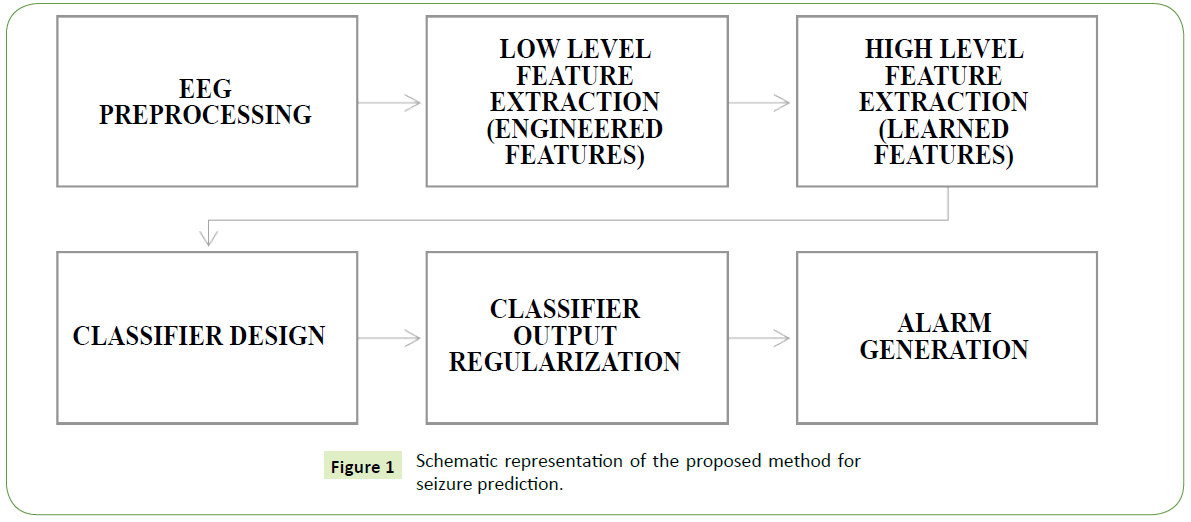
Figure 1: Schematic representation of the proposed method for seizure prediction.
Dataset description and extraction
One of the very few publicly available EEG recordings to researchers is the Children’s Hospital Boston – Massachusetts Institute of Technology (CHB-MIT) dataset. The database consists of scalp EEG (sEEG) recordings of 23 patients suffering from intractable epileptic seizures. In total the recordings span approximately 982 hours and contains 198 seizures. All signals were sampled at 256 samples per second with 16-bit resolution over 23 electrodes. The International 10-20 system of EEG electrode positions and nomenclature was used for these recordings. The data is grouped into cases with each case containing between 9 and 42 continuous .edf (European data format) files from a single patient. Information about the elapsed time in seconds from the beginning of each .edf file to the beginning and end of each seizure contained in it is also made available in the dataset. The EEG data can be accessed through the PhysioNet website: https://physionet.org/physiobank/database/chbmit/
For some files in the dataset, seizures occur in clusters, that is, one or more seizure events happened very close to a leading seizure. A leading seizure is one that is far away from the last seizure but followed closely by other seizures thereby ensuring moderate mixture of postictal (post seizure), interictal (normal) and preictal (presiezure) dynamics. The ictal (seizure) times have been clearly defined in the dataset by experts but no mention of the preictal and postictal times were made. Therefore, 25 minutes of postictal data and 60 minutes of preictal data were considered. In order to allow for therapeutic intervention, 5 minutes of data immediately preceding seizure was not included in the preictal data. The remaining data were then taken as the interictal. Only patients with at least 2 seizures separated by at least a 2-hr period have their data extracted and used for this study. Approximately 187hours of EEG data containing 55 seizures were set aside as the training dataset while the testing set consist of 545 hours of continuous EEG data with 43 seizure events. EEG data in the .edf files were converted into Matlab files (.mat) through BIOSIGtoolbox interface for EEGLAB in the Matlab/Simulink environment. Before the data were extracted artefact removal add-ins in EEGLAB such as CLEAN and ARS were used to remove artefacts from the data. Table 1 below reports the EEG data from the CHB-MIT dataset.
| Patient |
Case |
Sex |
Age (yrs) |
Number of Seizures |
Duration of Seizure (hh:mm:ss) |
Ictal Duration (min) |
| 1 |
1 |
F |
11 |
7 |
40:33:08 |
7.37 |
| |
1 |
F |
13 |
4 |
32:49:49 |
3.32 |
| 2 |
2 |
M |
11 |
3 |
35:15:59 |
2.87 |
| 3 |
3 |
F |
14 |
7 |
38:00:06 |
6.7 |
| 4 |
4 |
M |
22 |
4 |
156:03:08 |
6.3 |
| 5 |
5 |
F |
7 |
5 |
39:00:10 |
9.3 |
| 6 |
6 |
F |
1.5 |
10 |
66:44:06 |
2.55 |
| 7 |
7 |
F |
14.5 |
3 |
67:03:08 |
5.42 |
| 8 |
8 |
M |
3.5 |
5 |
20:00:23 |
15.32 |
| 9 |
9 |
F |
10 |
4 |
67:52:18 |
4.6 |
| 10 |
10 |
M |
3 |
7 |
50:01:24 |
7.45 |
| 11 |
11 |
F |
12 |
3 |
34:47:37 |
13.45 |
| 12 |
12 |
F |
2 |
40 |
23:41:40 |
24.58 |
| 13 |
13 |
F |
3 |
12 |
33:00:00 |
8.92 |
| 14 |
14 |
F |
9 |
8 |
26:00:00 |
2.82 |
| 15 |
15 |
M |
16 |
20 |
40:00:36 |
33.2 |
| 16 |
16 |
F |
7 |
10 |
19:00:00 |
1.4 |
| 17 |
17 |
F |
12 |
3 |
21:00:24 |
4.58 |
| 18 |
18 |
F |
18 |
6 |
35:38:05 |
5.28 |
| 19 |
19 |
F |
19 |
3 |
29:55:46 |
3.93 |
| 20 |
20 |
F |
6 |
8 |
27:36:06 |
4.9 |
| 21 |
22 |
F |
9 |
3 |
31:00:11 |
3.4 |
| 22 |
23 |
F |
6 |
7 |
26:33:30 |
7.04 |
| 23 |
24 |
|
|
16 |
21:17:47 |
8.52 |
| |
Total |
198 |
982:56:07 |
193.52 |
*Cases 1 and 2 belong to the same patient (patient 1) taken at a 2-year interval from each other. Therefore, the total number of patients is 23. *The age and sex information for case 24 (patients 23) was not made available in the database.
Table 1: Information of patients in (1) CHB-MIT dataset (all 24 cases) (2) this study (red).
Feature extraction
Feature engineering (Low level features): The importance of bivariate measure profiles or features have already been demonstrated in several seizure prediction studies. These features are used to study the temporal evolution of interactions between different brain regions as seizure events develop thereby tracking changes in EEG recordings in both temporal and spatial dimensions. A novel bivariate measure named normalized logarithmic wavelet packet coefficients energy ratio (NLWPCER) is defined and used in this work. This feature measures the ratio of wavelet packet coefficients energy of relevant EEG spectral bands i.e., delta (δ), theta (θ), alpha (α) and beta (β) whose frequency ranges are 0-4 Hz, 4-8 Hz, 8-15 Hz and 15-30 Hz respectively across the bands and between EEG channels. A window length of 5seconds or 1280 samples without overlap was used in the calculation of the NLWPCER features. For each window and in all channels, full wavelet packet decomposition was carried out, then normalized logarithmic wavelet packet coefficient energy was extracted for the relevant decomposition nodes. The normalized logarithmic wavelet packet coefficient energy is given by
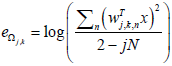
 : NLWPCE feature extracted from subspace Ωj ,k
 : Coefficients evaluated at subspace Ωj ,k
2 − jN : Number of the coefficients in the subspace Ωj ,k
Thereafter, NLWPCER feature is defined as:
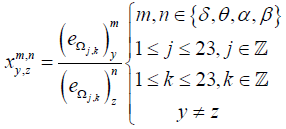
Where  is the NLWPCER features calculated for spectral band m of an epoch in channel y and spectral band n of an epoch with equal time index in channel z. This feature gives the cross energy information not just between two channels but also between frequency bands across channels. It is hoped that this new feature will find preictal trends that can be used for seizure prediction. Calculating the NLWPCER measures between two EEG channels for P spectral bands give rise to P2 bivariate features therefore if P spectral bands are considered and Q channels are studied then all possible pair wise combinations of spectral bands and channels will produce
 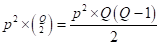 feature time series. With 4 spectral bands and 23 recording channels a total of 4048 NLWPCER feature time series were obtained. To further reduce the effect of noise and artefacts, each feature time series was smoothed with a Gaussian-weighted moving average filter with a window length 15. Furthermore, each feature vector was normalized into the interval [0-1].
Feature representation learning (High level features): Furthermore, good data representation for classification was learned by extracting high level features through feature learning techniques. Two newly introduced algorithms for extracting high level features are the sparse filtering (SF) algorithm and reconstruction independent component analysis (RICA). The appropriate feature learning technique (SF or RICA) was chosen on a per patient basis through Bayesian optimization procedure which searches among the following feature extraction function hyperparameters: iteration limit, solver (RICA or SF) and number of learned feature, q) effectively. SF ensures good data representation for classification purpose by conducting a nonlinear map of data from low level feature space into a new higher or lower dimensional high-level feature space. RICA does the same by conducting a linear map. SF and RICA algorithms were implemented in Matlab through the sparsefilt/rica functions respectively. These functions take as input arguments matrix, X of low-level feature data containing p (4048) features and q, the number of high-level features to be extracted from X. Therefore, sparsefilt/rica learns a p-by-q matrix of transformation weights, W. For undercomplete or overcomplete feature representations, q can be less than or greater than the number of original predictor variables (features), respectively. The Matlab function transform completes the process by transforming X to the new set of high-level features by using the learned transformation weights.
Following the feature learning task all derived feature time series were exported into excel to form feature vectors and consequently training and testing dataset matrices. Data were arranged such that each row in the matrices is an observation and each column represent a variable (i.e., feature), for example a 1-hour long raw data file generated dataset matrix of dimension 720 by q.
Labelling each observation (Data instance)
In the seizure prediction experiments, preictal time (time period immediately prior to 5 minutes before seizure onset believed to hold predictive markers of seizure activity) are assumed for each patient. In this scheme all observations in the time period 65-5 minutes before seizure onset are labelled as preictal state data instances while other observations before the preictal times but after the postictal period are labelled as interictal state data instances. The ictal and postictal data were not included in the training set since our aim is to predict seizure events. An observation or data instance is a feature vector associated with a specific short time interval (i.e., 5 secs in this work). By assuming this preictal time this work tries to investigate the possibility of predicting seizure events 65-5 minutes in advance.
Classifier design (SVM/ANN)
Model learning: The proposed seizure prediction model uses binary support vector machines (bSVM) classifier. The bSVM classifier was implemented in Matlab using the statistical and machine learning toolbox functions. A Gaussian kernel specifically the radial basis function (RBF) was chosen as the kernel function after preliminary experiments on all cases reveal mean accuracy results of 76.7% (s.d., 8.4%), 89% (s.d., 5.3%) and 98.5% (s.d. 3.7%) respectively for linear, polynomial and Gaussian kernels. Since data in seizure prediction studies are usually unbalanced (i.e., more interictal data and less preictal and ictal data) and classification algorithms tend to produce greater accuracy for the class with more training samples, a down sampling of the interictal samples was carried out to obtain a balance between the classes during training. However, during testing no such down sampling was done. The proposed model uses Bayesian optimization technique in Matlab to tune the SVM hyper-parameters ‘Lamda’, λ and ‘Sigma’, σ independently for each patient. This is a novel contribution in seizure prediction studies as earlier studies uses Grid search optimization technique. Bayesian optimization maintains a Gaussian process model of the objective function and uses objective function evaluations to train the model. Parameter λ controls the regularization strength of the model while parameter σ controls the scale of kernel function.
An artificial neural network (ANN) classifier was also created and trained using the neural pattern recognition toolbox in Matlab. A two-layer feed-forward network, with sigmoid hidden and softmax output neurons was created. The network has 10 hidden and 2 output neurons and was trained using scaled conjugate gradient backpropagation. Following the training of the predictive models, their performances were tested with the classification and prediction of seizures in the unseen testing dataset.
Post processing classifier output (Regularization): In order to enhance prediction performance and reduce false predictions the algorithm implements a post processing scheme which involves counting the number of samples classified as preictal. A moving window whose size corresponds to the assumed preictal time is considered. In each window a measure known as the firing power (fp) [32,33] is computed. This measure quantifies the amount of samples classified as preictal and is defined by
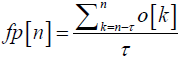
Where fp[n] is the firing power of the classifier’s output at discrete time n, τ, is the number of samples corresponding to the preictal time considered and o[k] is the classifier output. To make fp[n] a normalized function between 0 and 1 the value 1 was assigned to the classifier output if a sample is classified as preictal and the value 0 otherwise. Alarms are then raised when the fp[n] function exceeds a certain threshold defined as a percentage of 1 which is the maximum value of the firing power function.
Performance descriptors
The performance of the new prediction algorithm was evaluated using two descriptors: sensitivity (SS) which measures the percentage of predicted seizures and false prediction rate (FPR) which measures the amount of false alarm raised per unit time (usually 1 hour). In order to comply with seizure prediction characteristics phenomenon, the seizure occurring period (SOP), an important yardstick upon which our performance metrics are measured was defined. The SOP is the time period during which a seizure is expected to occur.
Statistical validation
The proposed seizure prediction algorithm was validated by comparing its performance against that of a random predictor, the analytic random predictor [34]. the probability of at least predicting n out of N seizures using d independent features by a random predictor is given by the Binomial distribution
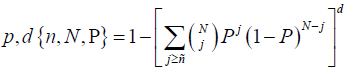
Where parameter P of the distribution approximated by p =1− e−FPR×SOP was calculated for each patient using the FPR and the number of correctly predicted seizures n for that patient by the proposed method. At a significant level α = 0.05 the upper critical sensitivity of the random predictor is given as
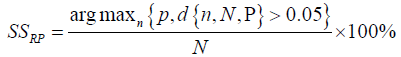
The performance of the proposed seizure prediction method is considered significantly better than chance if the sensitivity achieved by the method SSM is greater than that of a random predictor.
Consistency of feature representation learning
In this work, the use of feature representation learning (or high-level feature extraction) in seizure prediction studies is introduced. To establish the usefulness of the method there is need to show that the method is consistent. To do this, more examples of the impact of feature representation learning on engineered features should be studied. Six different schemes (scheme A to scheme F) were considered. In schemes A, C & E different sets of engineered features were extracted and used for seizure prediction across all patients. Schemes B, D & F consisted extracting engineered features as in schemes A, B and C respectively but with additional patient specific feature representation learning through sparse filtering or reconstruction independent component analysis algorithms before being used for seizure prediction. Scheme F is the particular method used in this work. The prediction results obtained from all the schemes were then compared. Table 2 gives information about the extracted features for each scheme.
| Feature Extraction |
Case |
| A |
B |
C |
D |
E |
F |
| Low level features |
77 features earlier studied |
77 features earlier studied |
24 NLWPCE features |
24 NLWPCE features |
160 NLWPCER features |
160 NLWPCER features |
| High level features |
Nil |
Extracted via Sparse filtering or Reconstruction independent component analysis (i.e. patient specific) |
Nil |
Extracted via Sparse filtering or Reconstruction independent component analysis (i.e. patient specific) |
Nil |
Extracted via Sarse filtering or Reconstruction independent component analysis (i.e. patient specific) |
Table 2: Six different schemes used for comparison between seizure predictions study using only engineered features and engineered features plus feature representation learning (FRL).
Sensitivity of seizure parameters to theoretical methodology used
In a review of dynamical systems modeling of epileptic seizures for onset prediction, Agboola et al. [35] discussed some unresolved issues in the seizure prediction problem. One of the issues bordered on predictive onset times obtained from different seizure prediction algorithms. The predictive times reported in several of the works cited in the paper were found to vary substantially from the order of a few seconds to several hours. Thus, it has been hypothesized that seizure prediction parameters especially the seizure onset prediction time are sensitive to the theoretical methodology used for seizure prediction. To observe this phenomenon in the proposed prediction method, the trends of average prediction times achieved through the SVM classifier for different schemes discussed in section 3.8 were observed across schemes (A, B, E and F) and patients
Results and Discussion
Figure 2 is a graphical display of a typical result obtained from the evaluation of the proposed method used in this work with the testing dataset of one of the cases studied (case 4). The highlighted areas show 60 min preictal periods. Red vertical arrows indicate the alarms raised. Brown vertical lines indicate the seizure onsets. Horizontal dashed line marks the threshold on fp function for alarm generation. For this case, the threshold was set at 0.5. There are 3 true alarms (i.e., alarms followed by seizures) raised and 2 false alarms (i.e., alarms not followed by seizures) in the entire testing period. It should be noted that proper setting of the threshold for raising alarms influences prediction results. If it is too high the sensitivity of the model will be low and if it is too low the model suffers high false prediction rates. Trade–off is necessary in setting the threshold value.
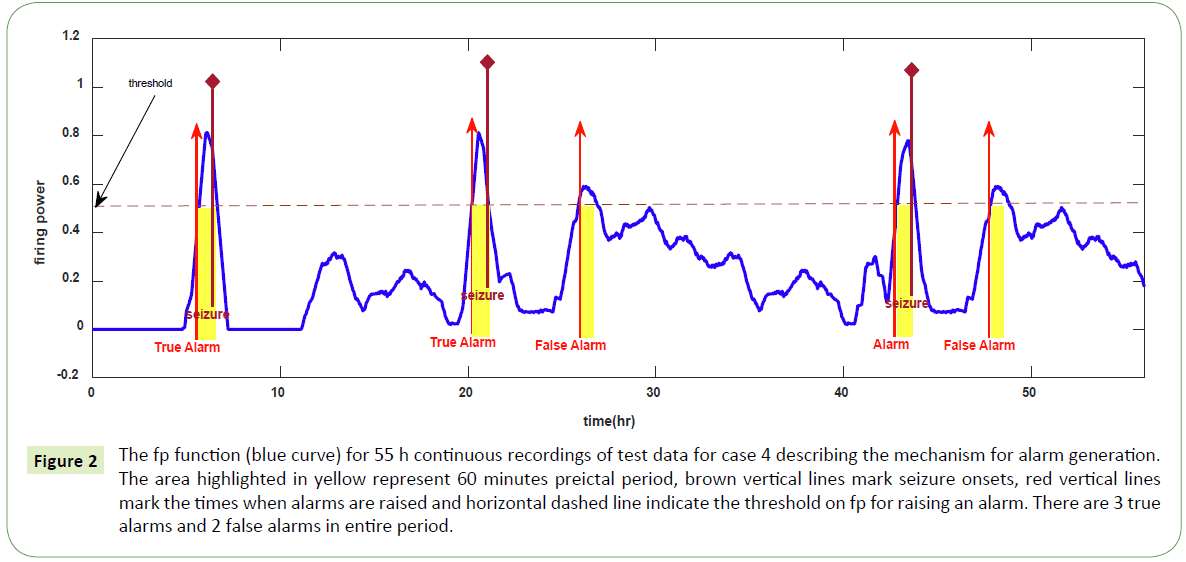
Figure 2: The fp function (blue curve) for 55 h continuous recordings of test data for case 4 describing the mechanism for alarm generation. The area highlighted in yellow represent 60 minutes preictal period, brown vertical lines mark seizure onsets, red vertical lines mark the times when alarms are raised and horizontal dashed line indicate the threshold on fp for raising an alarm. There are 3 true alarms and 2 false alarms in entire period.
Table 3 reports the results of the seizure prediction study in terms of sensitivity and false prediction rate obtained by the two classification algorithms: support vector machine and artificial neural network for each patient. Using the ANN classifier, in average 75.5% of seizures in the testing set were successfully predicted (32 out of 43 seizures within 545 hours of continuous EEG data) with an average false prediction rate of 0.13h-1. The SVM classifier gave a better performance with an average sensitivity of 87% and FPR of 0.08h-1. Results from model validation against an analytical random predictor (ARP) showed that for all patients, using the two classifiers the observed sensitivities exceeded the critical sensitivities of the ARP. The only exception is in the case of patient 5 using ANN classifier where the observed sensitivity is 33.3% while the ARP gives 66.7%. The significance level, αRP used for the test is 0.05. On the average the upper critical sensitivity of analytical random predictor was 21.1%, while that of the proposed method (for SVM classifier) reached 87.3%.
| S/N |
Case |
Tst. Rec (hr) |
No. Tst. Seiz. |
SVM |
ANN |
| SS (%) |
FPR (per hour) |
SSRP (%) |
SOP (Min) |
p-value |
SS (%) |
FPR (per hour) |
SSRP (%) |
SOP (Min) |
p-value |
| 1 |
1 |
32 |
2 |
100 |
0.03 |
50 |
30 |
0.001 |
50 |
0.02 |
0 |
20 |
0.02 |
| 2 |
2 |
27 |
2 |
100 |
0.04 |
0 |
50 |
0.02 |
100 |
0.14 |
50 |
20 |
0.01 |
| 3 |
3 |
30 |
2 |
100 |
0.06 |
0 |
20 |
0.015 |
100 |
0.01 |
0 |
30 |
0.035 |
| 4 |
4 |
55 |
3 |
100 |
0.04 |
25 |
30 |
0.012 |
50 |
0.18 |
25 |
40 |
0.013 |
| 5 |
5 |
25 |
3 |
66.7 |
0.11 |
33.3 |
30 |
0.015 |
33.3 |
0.21 |
66.7 |
30 |
0.025 |
| 6 |
6 |
37 |
4 |
100 |
0.17 |
50 |
40 |
0.031 |
50 |
0.14 |
0 |
40 |
0.041 |
| 7 |
7 |
28 |
1 |
100 |
0.03 |
0 |
40 |
0.034 |
100 |
0.12 |
0 |
30 |
0.014 |
| 8 |
9 |
42 |
2 |
50 |
0.06 |
50 |
20 |
0.004 |
50 |
0.1 |
50 |
20 |
0.012 |
| 9 |
10 |
26 |
3 |
100 |
0.18 |
66.7 |
30 |
0.042 |
100 |
0.08 |
66.7 |
30 |
0.034 |
| 10 |
12 |
19 |
4 |
100 |
0.02 |
0 |
30 |
0.004 |
100 |
0.15 |
0 |
40 |
0.001 |
| 11 |
13 |
33 |
2 |
100 |
0.01 |
50 |
20 |
0.023 |
50 |
0.21 |
0 |
30 |
0.002 |
| 12 |
14 |
40 |
2 |
50 |
0.01 |
0 |
40 |
0.003 |
50 |
0.02 |
0 |
20 |
0.011 |
| 13 |
15 |
23 |
4 |
100 |
0.07 |
0 |
40 |
0.033 |
100 |
0.12 |
0 |
30 |
0.003 |
| 14 |
18 |
21 |
2 |
100 |
0.21 |
0 |
20 |
0.002 |
100 |
0.22 |
0 |
30 |
0.019 |
| 15 |
20 |
39 |
2 |
50 |
0.07 |
0 |
40 |
0.007 |
100 |
0.19 |
100 |
20 |
0.027 |
| 16 |
22 |
32 |
2 |
100 |
0.02 |
0 |
30 |
0.011 |
50 |
0.18 |
0 |
40 |
0.014 |
| 17 |
24 |
36 |
3 |
66.7 |
0.19 |
33.3 |
20 |
0.003 |
100 |
0.14 |
33.3 |
20 |
0.021 |
| Mean |
|
32.06 |
2.5 |
87.26 |
0.08 |
21.08 |
31.18 |
0.0153 |
75.49 |
0.13 |
23.04 |
28.82 |
0.0178 |
| Sum |
|
545 |
43 |
|
|
|
|
|
|
|
|
|
|
SS: Sensitivity; FPR: False Prediction Rate; SSRP: Sensitivity of Random Predictor; SOP: Seizure Occurring Period; p-value: p-value of the random predictor.
Table 3: Seizure prediction results for 17 cases studied.
Figures 3a and 3b are bar charts comparing sensitivity and FPR results obtained for the 17 patients (cases) studied using SVM and ANN classifiers respectively. For both classifiers’ variability in the sensitivities and FPR is observed. Factors that could be responsible for the variability may include (i) patient dependent seizure characteristics not captured by the method and (ii) presence of seizure dependent characteristics.
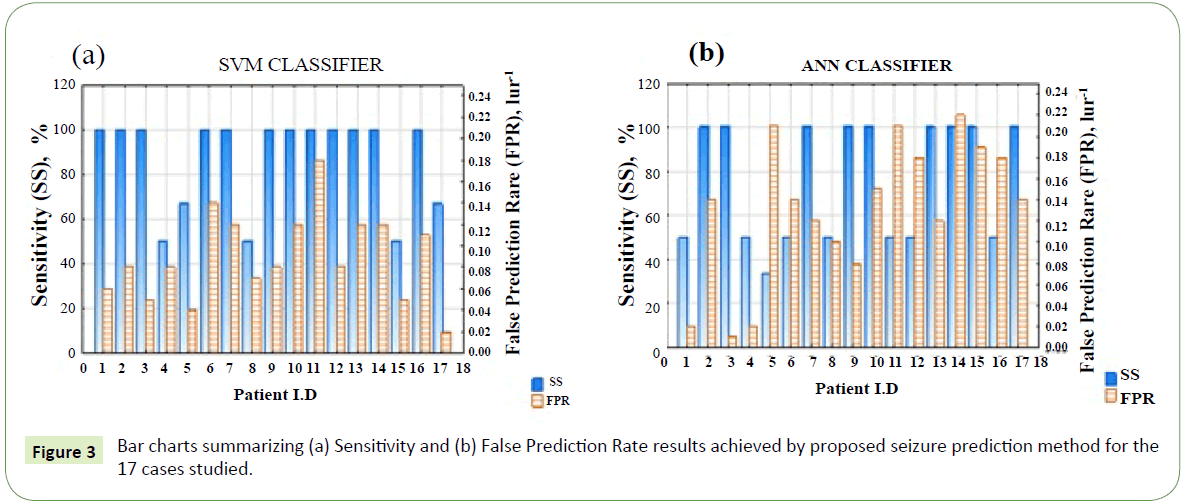
Figure 3: Bar charts summarizing (a) Sensitivity and (b) False Prediction Rate results achieved by proposed seizure prediction method for the 17 cases studied.
Patient-dependent seizure characteristics: We have assumed a uniform preictal period (60 min) for all patients in this study but this might not be the case in reality as preictal period may vary from patient to patient. So also, we assumed a uniform threshold value (0.05) on the fp function for alarm generation which may be not produce the best result for each patient. But could the threshold be learned or suggested for each patient by our method? This is possible if the classifier output regularization function and alarm raising formality are configured in the algorithm during training. The threshold parameter would then be entered among other hyperparameters to search for optimal sensitivity and false prediction rate for each patient.
Seizure dependent characteristics: Seizure dependent characteristics are also believed to exist for individual patient.
Therefore, the pattern learned by classifier trained on some seizures of a patient may not be useful when evaluating the classifier on other seizures from the same patient.
Engineered Features (Low level features) and Feature Representation Learning (High level features)
Figures 4a and 4b are box and whiskers plots comparing the results of seizure prediction in terms of sensitivity and false prediction rate respectively obtained for all patients in all the schemes. It is observed from the median and minimum values of sensitivity and FPR that schemes involving feature representation learning keep outperforming their respective counterpart schemes without feature representation learning. This is because feature representation learning particularly as obtained by sparse filtering or reconstruction independent component analysis is able to simplify classification rule learning task during training by enforcing sparsity and over completeness properties on the learned features. These two properties capture the underlying data distribution and prevent overfitting during the training thereby improving model generalizing ability when presented with previously unseen data.
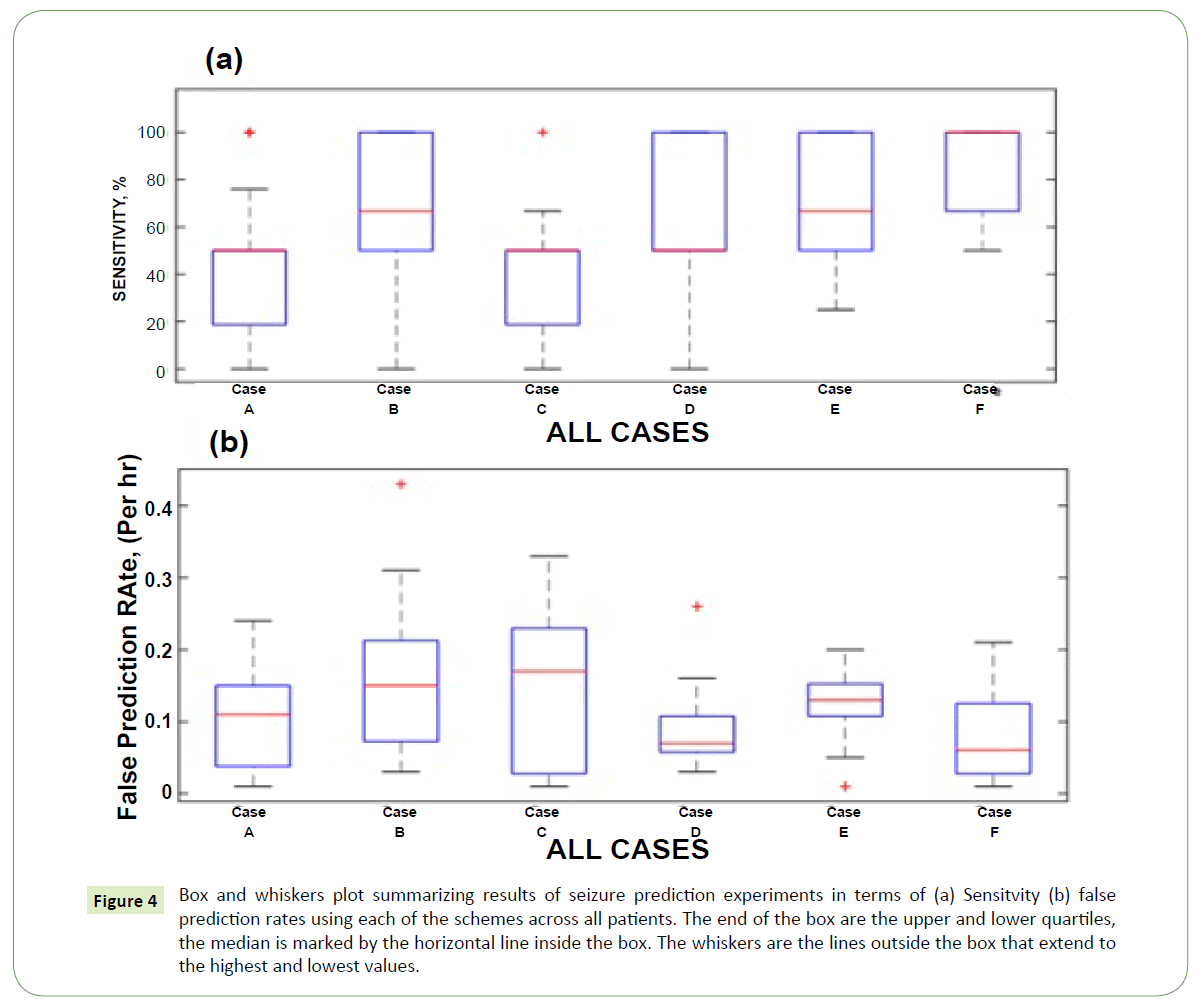
Figure 4: Box and whiskers plot summarizing results of seizure prediction experiments in terms of (a) Sensitvity (b) false prediction rates using each of the schemes across all patients. The end of the box are the upper and lower quartiles, the median is marked by the horizontal line inside the box. The whiskers are the lines outside the box that extend to the highest and lowest values.
Sensitivity of seizure parameters to theoretical methodology used
The average seizure anticipation times of the SVM classifier is shown in Figure 5a for all testing set recordings using feature extraction schemes A, B, E and F described in Table 2. Each row shows the average prediction time achieved by the system with the feature extraction schemes for all the recordings from a single patient. The vertical red line indicates the seizure onset time. For better comprehension the trends of average prediction times across the schemes and patients are presented in Figures 5b and 5c respectively. The pattern in Figure 5 looks chaotic for all patients as we go from left to right (i.e., scheme A to F). The spread of the average prediction time for all the schemes is quite large. For instance, the minimum, mean and maximum values for schemes B and E are 5, 30.8, 46 min and 9, 31.1, 47 min respectively. This observation may be pointing to the fact that the seizure prediction time is strongly dependent on the theoretical method employed. However, the means of the average prediction times for the schemes are 29.7, 30.8, 31.1 and 30.2 respectively. These values are very close. On the other hand, the pattern in Figure 5 is quite ordered with almost all schemes displaying upward and downward peaks for quite a number of the patients (especially patients 2, 4, 8, 10, 11, 15 and 17). This observation is consistent with earlier observations about the patient dependent characteristic of seizures, that is, the processes leading to the generation of epileptic seizures vary from patient to patient. Therefore, each scheme captures these different mechanisms at different but close times.
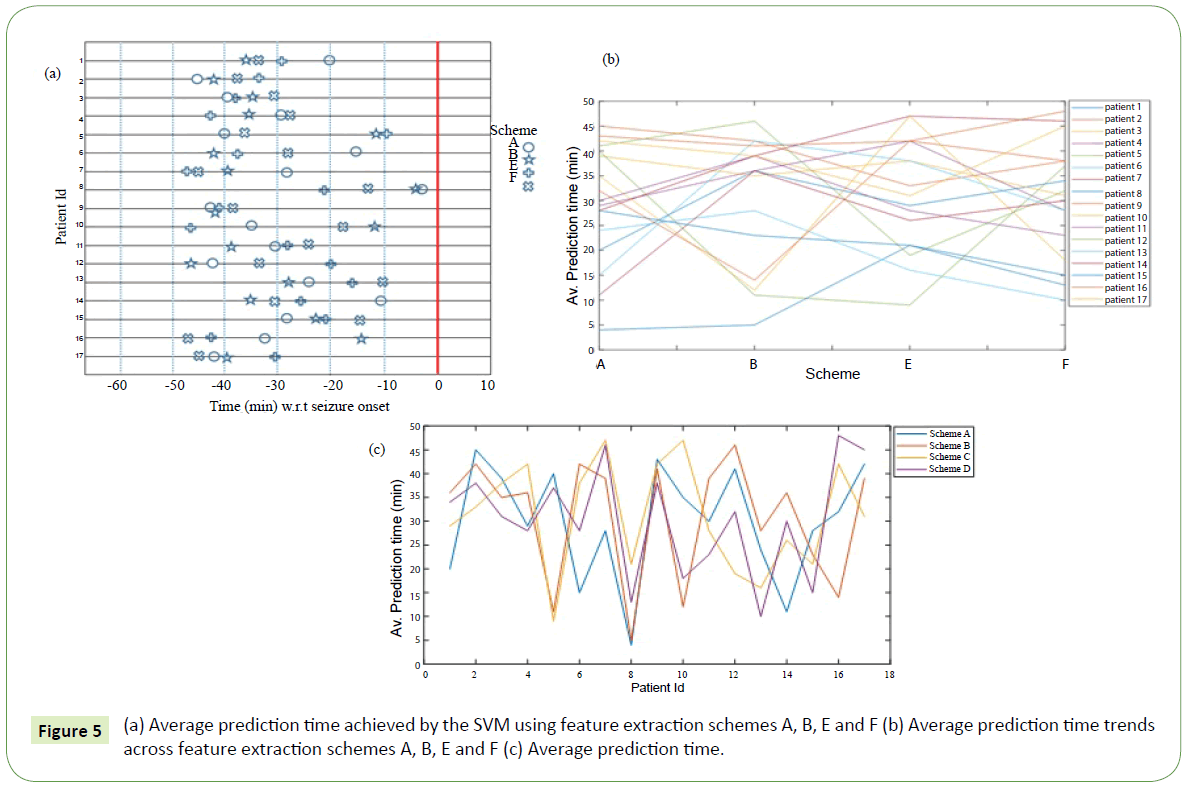
Figure 5: (a) Average prediction time achieved by the SVM using feature extraction schemes A, B, E and F (b) Average prediction time trends across feature extraction schemes A, B, E and F (c) Average prediction time.
Comparison of our method with other literature methods
In Table 3 the results of some of these methods are presented in comparison to the method proposed in this work. Although, it is only a general comparison due to the different epilepsy data (sEEG or iEEG), patients and criteria (e.g. different prediction horizon and SOP) used for evaluation. It is generally observed that performance with scalp EEG is lower. This observation may be explained in terms of the advantages of intracranial EEG (iEEG) recording. Firstly, iEEG has high signal to noise ratio and secondly, it is a localized recording of the brain activity which minimizes unwanted interferences from other brain sites on the signals recorded from the region of interest. On the other hand, Bandarabadi [36] reported a slightly higher performance of sEEG over iEEG and argued that although scalp EEG recording cannot provide localized neuronal potential activities, it can present a more generalized spatiotemporal view of brain’s dynamical system (Table 4).
| Year |
Authors |
Dataset (Source/type) |
Feature |
Classifier |
SS (%) |
FPR (per hour) |
SOP (min) |
| 2016 |
Zhang et al. |
Freiburg/iEEG |
spectral powers |
SVM |
100 |
0.03 |
50 |
| 2016 |
Zhang et al. |
MIT/sEEG |
spectral powers |
SVM |
88.68 |
0.05 |
50 |
| 2017 |
Parvez et al. |
Freiburg/iEEG |
phase-match error, deviation, flunctuation |
LS - SVM |
95.4 |
0.36 |
30 |
| 2017 |
Sharif et al. |
Freiburg/iEEG |
Fuzzy rules on Poncare plane |
SVM |
91.8 |
0.05 |
15 |
| 2017 |
Arabi et al. |
Freiburg/iEEG |
univariate/bivariate features |
Rule-based descision |
86.7 |
0.126 |
30 |
| 2017 |
Bonyadi et al. |
Freiburg/iEEG |
Short time Fourier Transform |
Convolutional Neural Network |
89.8 |
0.17 |
30 |
| 2017 |
Bonyadi et al. |
MIT/sEEG |
Short time Fourier Transform |
Convolutional Neural Network |
86.1 |
0.09 |
30 |
| 2018 |
This work |
MIT/sEEG |
NLWPCER + FRL |
SVM |
87.26 |
0.09 |
31 |
| 2018 |
This work |
MIT/sEEG |
NLWPCER + FRL |
ANN |
75.5 |
0.13 |
29 |
Table 4: Comparison between results obtained from earlier published seizure prediction method and the proposed method.
Hardware implementation of the proposed seizure prediction algorithm
One future goal of this research is to make a hardware implementation of the proposed seizure prediction algorithm. Hardware implementation of a seizure prediction algorithm is essential in order to actualize a timely response or feedback aimed at warning patients/caregivers of an impending seizure or taking an action leading to its aversion. But, is the performance of the method proposed in this work good enough for hardware implementation? This question can be answered in the light of the performance of algorithms already in deployment onto seizure prediction devices. Mark et al. [37] conducted a multicentre clinical feasibility study to assess the safety and efficacy of a long-term implanted seizure advisory system designed to predict seizure likelihood. For the purpose, an algorithm for the identification of periods of high, moderate and low seizure likelihood was established. This algorithm which was later used for the hardware implementation was reported to achieve sensitivities ranging from 65-100%. Also, in a thorough review of literature and contacts made with manufacturers of commercially available devices, Van de Vel et al. [38] reported results of non-EEG based seizure detection devices as varying from between 2.2% and 100% sensitivity and between 0 and 3.23 false detections per hour. Furthermore, Isabell et al. [39] in their bid to engineer a mobile system for seizure prediction used a deep learning classifier which was trained on intracranial electroencephalography (iEEG) data and tested on held-out data. The algorithm was also benchmarked against the performance of a random predictor. This algorithm, which was meant for deployment onto an ultra-low power neuromorphic chip for autonomous operation on a wearable device was reported to achieve a mean sensitivity of 69% and mean time in warning of 27%. In summary, with an average sensitivity and false prediction rate of 87% and 0.08/hr respectively the performance of the proposed algorithm is still very much within acceptable range in literature and could be deployed for use in a seizure prediction device.
A few of such devices have already been manufactured and are presently available commercially. First of such devices is the RNS (response neurostimulator) system by NeuroPace@. The RNS is an advanced technology designed to detect abnormal electrical activity in the brain and respond by delivering imperceptible levels of electrical stimulation to normalize brain activity before an individual experience’s seizure. Also available in the market is the Activa PC + S (Primary Cell + Sensing) by Medtronic@. This device also monitors brain activities and sends stimulation pulses accordingly. Another therapeutic device which was recently introduced to the market by LivaNova@ is the Aspire SR (Seizure Response). The device constantly monitors the heart beat and delivers stimulation pulses when it detects a rapid heart rate raise. Just recently, researchers at Eindhoven University of Technology (TU/e) developed a smart bracelet which they call ‘Nightwatch’. The device combines both a heart rate sensor and a motion sensor to look for both an unusually high heart rate as well as the rhythmic jolting characteristic of a seizure to alert caregivers only of a patient’s nighttime epileptic seizures.
In the development of these devices’ critical issues of portability and power consumption are of utmost importance. The low power consumption property becomes even more desirable when the device is to be implanted in order to reduce the rate of routine follow up surgeries once the battery is discharged. Consequently, an ideal seizure prediction algorithm should not be computationally expensive thereby requiring low power for its implementation. This makes computational expensiveness one of the deciding factors to consider in the development of seizure prediction algorithms. Also, this is the reason why a new EEG feature was considered in the present study.
For instance, we have reported on the computation time on 77 existing extracted EEG features in the literature on a computer with an intel@ Pentium@ P6200 processor with 4 GB of RAM. It took approximately 20 seconds to calculate this feature for 3 seconds of EEG data sampled at 500 Hz [40]. On the other hand, wavelet coefficients features are known to be easy and fast to compute hence their deployment in this study. The NLWPCER features proposed here is about 50 times faster to compute relative to data window length of 3 seconds.
Conclusion
Scalp and intracranial EEG possess a characteristic pattern that varies across individuals with epilepsy both in non-seizure and seizure states. However, EEG recorded from an individual exhibit less variability. This fact motivated the development of patient specific seizure prediction algorithms. In this work a novel patient-specific epileptic seizure prediction method has been developed. The method uses state of the art unsupervised feature learning techniques to obtain useful representation of existing and newly engineered feature: Normalized Logarithmic Wavelet Packet Coefficients Energy Ratio (NLWPCER) to predict seizures. The general idea is to learn a transformation that maps data in a low-level feature (engineered features) space into high level feature space where classification rule is easier to learn and generalizing ability of classifier is improved.
A support vector machine classifier with Gaussian kernel trained using the training dataset to learn preictal and interictal feature vector patterns performed better than the ANN classifier also trained for the same task. The best parameter set of the SVM was obtained through Bayesian optimization and the output of the classifier was further regularized to reduce false prediction rate during testing. Finally, the results obtained were compared with that of a random predictor for validation. With the encouraging results obtained in this work it is believed that the proposed method is a step forward toward achieving a robust and consistent real-time portable seizure prediction device which is suitable for clinical applications.
Acknowledgements
We acknowledge with gratitude the efforts of individuals at the Massachusetts Institute of Technology (MIT) and Children Hospital Boston (CHB) who made the EEG data used in this work available. A team of investigators from the Children Hospital Boston (CHB) and the Massachusetts Institute of Technology (MIT) created and contributed the database to PhysioNet (The PhysioNet web site is a public service of the PhysioNet Research Resource for Complex Physiologic Signals). The clinical investigators from CHB include Jack Connolly, REEGT; Herman Edwards, REEGT; Blaise Bourgeois, MD. The investigators from MIT include Ali Shoeb, PhD and Professor John Guttag.
Declarations of Interest
None.
24366
References
- Shorvon S (2005) Handbook of Epilepsy Treatment (2nd edn). Oxford, Blackwell, UK.
- Baumgartner CW, Leutmezer F (1998) Preictal SPECT in temporal lobe epilepsy: Regional cerebral blood flow is increased prior to electroencephalography-seizure onset. J Nuclear Medicine 39: 978-982.
- Adelson PD, Nemoto E, Scheuer M, Painter M, Morgan J, et al. (1999) Non-invasive continuous monitoring of cerebral oxygenation preictally using near-infrared spectroscopy: A preliminary report. Epilepsia 40: 1484-1489.
- Le VQ, Martinerie J, Navaro V, Boon P, D’Have M, et al. (2001) Anticipation of epileptic seizures from standard EEG recordings. Lancet 357: 183-188.
- Iasemidis LD, Shiau DS, Chaovalitwongse W, Sackellares J, Pardalos PM, et al. (2003) Adaptive epileptic seizure prediction system. IEEE Trans Biomed Eng 50: 616-627.
- Hively L, Protopopescu V (2003) Channel-consistent forewarning of epileptic events from scalp EEG. IEEE Trans Biomed Eng 50: 584-593.
- Chisci L, Mavino A, Perferi G, Sciandrone M, Anile C, et al. (2010) Real time epileptic seizure prediction using AR models and support vector machines. IEEE Trans Biomed Eng 57: 1124-1132.
- Lehnertz K (2001) Seizure anticipation techniques: State of the art and future requirements. Engineering in Medicine and Biology Society, Proceedings of the 23rd Annual International Conference of the IEEE 2001.
- De Clercq W, Lemmerling P, Van Huffel S, Van Paesschen W (2003) Anticipation of epileptic seizures from standard EEG recordings. Lancet 361: 971.
- Feldwisch-Drentrup H, Schulze-Bonhage A, Timmer J, Schelter B (2011) Statistical validation of event predictors: A comparative study based on the field of seizure prediction. Phys Rev E Stat Nonlin Soft Matter Phys 83: 066704.
- Winterhalder M, Maiwald T, Voss HU, Aschenbrenner-Scheibe R, Timmer J, et al. (2003) The seizure prediction characteristic: A general framework to assess and compare seizure prediction methods. Epilepsy Behav 4: 318-325.
- Maiwald T, Winterhalder M, Aschenbrenner-Scheibe R, Voss HU, Schulze-Bonhage A, et al. (2004) Comparison of three nonlinear seizure prediction methods by means of the seizure prediction characteristic. Physica D 194: 357-368.
- Harrison MA, Osorio I, Frei MG, Asuri S, Lai YC (2005) Correlation dimension and integral do not predict epileptic seizures. Chaos 15: 33106.
- Mormann F, Andrzejak RG, Elger CE, Lehnertz K (2007) Seizure prediction: The long and winding road. Brain 130: 314-333.
- Andrzejak RG, Mormann F, Kreuz T, Rieke C, Kraskov A, et al. (2003) Testing the null hypothesis of the nonexistence of a preseizure state. Phys Rev E 67: 010901.
- Kreuz T, Andrzejak RG, Mormann F, Kraskov A, Stögbauer H, et al. (2004) Measure profile surrogates: A method to validate the performance of epileptic seizure prediction algorithms. Physical Review E 69: 061915.
- Parvez MZ, Paul M (2017) Seizure prediction using undulated global and local features. IEEE Transactions on Biomedical Engineering 64: 208-217.
- Wong S, Gardner AB, Krieger AM, Litt B (2007) A stochastic framework for evaluating seizure prediction algorithms using hidden Markov models. J Neurophysiol 97: 2525-2532.
- Snyder DE, Echauz J, Grimes DB, Litt B (2008) The statistics of a practical seizure warning system. J Neural Eng 5: 392-401.
- Sharif B, Jafari AH (2017) Prediction of epileptic seizures from EEG using analysis of ictal rules on Poincaré plane. Computer Methods and Programs in Biomedicine 145: 11-22.
- Haut SR, Swick C, Freeman K, Spencer S (2002) Seizure clustering during epilepsy monitoring. Epilepsia 43: 711-715.
- Zhang Z, Parhi KK (2016) Low-complexity seizure prediction from iEEG/sEEG using spectral power and ratios of spectral power. IEEE Transactions on Biomedical Circuits and Systems 10: 693-706.
- Aarabi A, He B (2014) Seizure prediction in hippocampal and neocortical epilepsy using a model-based approach. Clinical Neurophysiology 125: 930-940.
- Gotman J (1982) Automatic recognition of epileptic seizure in the EEG. Electroencephalography and Clinical Neurophysiology 54: 530-540.
- Le VQ, Karpenko A, Ngiam J, Ng AY (2011) ICA with Reconstruction cost for efficient overcomplete feature learning. Advances in Neural Information Processing Systems 24: 1017-1025.
- Ngiam J, Wei P, Koh W, Chen Z, Bhaskar SA, et al. (2011) Sparse filtering: Advances in Neural Information Processing Systems 24: 1125-1133.
- Coifman RR, Meyer Y, Quake S, Wickerhauser V (1992) Wavelet analysis and Signal processing: in Wavelets and Their Applications. Jones and Barlett, Boston, USA.
- Coates A, Lee H, Ng AY (2011) An analysis of single-layer networks in unsupervised feature learning: in Proceedings of the 14th International Conference on Artificial Intelligence and Statistics (AISTATS), Fort Lauderdale, FL, USA.
- Goodfellow IJ, Erhan D, Carrier PL, Courville A, Mirza M, et al. (2013) Challenges in representation learning. A report on three machine learning contests. The ICML 2013. Workshop on Challenges in Representation Learning.
- Romaszko L (2013) A deep learning approach with an ensemble-based neural network classifier for black box ICML 2013 contest: In: Workshop on Challenges in Representation Learning, ICML.
- Ryman SK, Bruce ND, Freund MS (2016) Temporal responses of chemically diverse sensor arrays for machine olfaction using artificial intelligence. Sensors and Actuators B: Chemical 231: 666-674.
- Teixeira CA, Direito B, Feldwisch-Drentrup H, Valderrama M, Costa RP, et al. (2011) EPILAB: A software package for studies on the prediction of epileptic seizures. J Neurosci Methods 200: 257-271.
- Theiler J, Eubank S, Longtin A, Galdrikian B, Farmer JD (1992) Testing for nonlinearity in time series: The method of surrogate data. Nonlinear Phenomena Physica D 58: 77-94.
- Schelter B, Winterhalder M, Maiwald T, Brandt A, Schad A, et al. (2006) Testing statistical significance of multivariate time series analysis techniques for epileptic seizure prediction. Chaos 16: 013108.
- Agboola HA, Solebo C, Aribike DS, Lesi FEA, Susu AA (2016) A review of the dynamical systems modeling of epileptic seizures for onset prediction. Proc Nigerian Acad Sci 9: 23-56.
- Bandarabadi M, Teixeira CA, Rasekhi J, Dourado A (2015) Epileptic seizure prediction using relative spectral power features. Clinical Neurophysiology 126: 237-248.
- Mark JC, Terence J, Samuel F, Michael M, Gavin F, et al. (2013) Prediction of seizure likelihood with a long-term, implanted seizure advisory system in patients with drug-resistant epilepsy: A first-in-man study.
- Van de Vel A, Kris C, Bret B, Milica M, Katrien J, et al. (2016) Non-EEG seizure detection systems and potential SUDEP prevention: State of the art Review and Update. Seizure 41: 141-153.
- Isabell K, Subhrajit R, Ewan N, Benjamin M, Thomas C, et al. (2018) Epileptic seizure prediction using big data and deep learning: Toward a mobile system. E Bio Medicine 27: 103-111.
- Agboola HA, Solebo C, Aribike DS, Lesi FEA, Susu AA (2019) The use of unsupervised feature learning and nonlinear dimension reduction for enhanced interictal and preictal classification in seizure prediction algorithm.