Keywords
Pelvic cancer; Colorectal cancer
Introduction
About 30% of all deaths in England are due to cancer and one in five of all cancer deaths are from pelvic cancer [1]. More than 70% of people would prefer to die at home worldwide [2-4]. Place of death and in-patient hospital costs of end of life care for cancer patients have shown wide international variation [5]. In England, place of death in the patient’s usual place of residence has been used as a Key Performance Indicator (KPI) for monitoring quality since 2011 [6]. In this KPI, Death in Usual Place of Residence (DIUPR) is monitored which measures the proportion of death at home or in a care home combined, based on the assumption that most people who die in a care home normally live there. The Choice Review, which was published in February 2015, suggested that many people do not receive care which meets their individual needs including where they prefer to die [7]. The National Survey of Bereaved people (VOICES-2013) reported that only half of the people, who express a preference to die at home, actually died at home [8]. Factors influencing patient choice in place of care and death have been explored in a systematic review which also revealed changes in preferences for some patients as death approached [9].
The end of life period for patients who die from pelvic cancer due to urological, gynaecological and colorectal reasons can be very complicated due to bowel obstruction, renal failure, fistula formation, pelvic pain and bleeding. These may necessitate surgical interventions from multiple subspecialties often working together in the management of patients [10,11]. These complications are likely to lead to multiple hospital admissions requiring a range of interventions [12,13], increasing the likelihood of patients dying in hospital. Although cancer patients prefer to die at home rather than hospital [14,15], some of them change their mind in response to their circumstances [16,17].
In the last decade, there has been a 2.2% rise in pelvic cancer deaths compared to a 1.3% rise in deaths from all causes aged 65 years and over [1]. The population of England is continuing to age, by 2037, the proportion of people aged 65 years and older is projected to increase by 6.4% from 17.6% in 2014 to 24% in 2037 [18]. This has implications for end of life care of cancer patients in England.
The purpose of this study was to explore variations in the place of death of pelvic cancer patients in England by age, sex, deprivation quintile, origin of cancer and strategic clinical network of residence during the time period 2004-2013.
Methods
Design
This is a national population-based study using routine data extracted from ONS Annual Deaths Extract supplied to Public Health England. This study cohort was restricted to residents of England with death registered between January 2004 and December 2013. The data was obtained in an anonymised format and hence ethical approval was not required. Patients with pelvic cancer were identified using the underlying and contributory causes of death codes derived from the International Classification of Disease version 10 (ICD10) [19].
Colorectal cancers: Recto-sigmoid (C19), Rectum ampulla (C20), Anus and anal canal (C21).
Gynaecological cancers: Cervix cancer (C53), Uterine cancer (C54, C55) Ovarian cancer (C56) Unspecified female genital cancer (C57).
Urological cancers: Cancer from ureter (C66), Bladder (C67), Prostate (C61) Unspecified urinary organ (C68).
Cancer originating from vulva, vagina, testis and scrotum has been excluded as these structures lie outside the true pelvis.
Data definition
The underlying cause is defined by the WHO as the disease that initiated the train of events leading directly to death [19]. Place of residence was classified as home/care home. If the residential postcode matched a care home, as listed in the ONS Communal Establishment Database, the place of residence was classified as care home. Place of death (hospital, home, care home, hospice or other place) was classified by National end of life care intelligence (NEoLCIN), home/care home [20]. Deaths in the home and care home were analysed as one category to mirror the national Key performance Indicator (KPI) [6]. The Index of Multiple Deprivation (IMD, 2010) [21] was used to allocate a deprivation quintile using residential postcode.
Statistical analysis
The two sided ‘t’ test was used to determine differences in proportions and significance. Multivariable logistic regression was used to determine odds ratios and significance of predictors of hospital deaths. The Analysis was undertaken using Stata 13.1, copyright StatCorp.
Results
239,928 patients died with pelvic cancer as underlying cause of death (5.1% of all deaths). 18.6% of all cancer deaths were due to pelvic cancer. Among patients who died of pelvic cancer, 54.9% (131,766) were from urological cancers, 24.3% (58,387) gynaecological cancers and 20.8% (49,775) colorectal cancers. Among those who died with any mention of pelvic cancer (297,209), 80.7% died with an underlying cause of pelvic cancer. The remainder, 57,281 deaths (19.3%) died from a range of other underlying causes.
Over the decade of the study period, the number of patients who died per annum with pelvic cancer as the underlying cause steadily increased (in 2004, n=23,385, in 2014, n=24,957). Three-quarters of the people who died from pelvic cancer were aged 70 years or older. In this period, there was a 6.3% increase in the proportion of patients dying from pelvic cancer aged 85 years or older. The median age at death from pelvic cancer was 79 years (Colorectal-76 years; Urology-80 years; Gynaecology - 72 years). The leading cause of death from pelvic cancer in men was prostate cancer (60.2%) and in women was ovarian cancer (37%).
Place of death due to pelvic cancer by age and origin of cancer
During the study period, 2004-13, the proportion of pelvic cancer deaths occurring in hospital declined from 46% in 2004 to 34% in 2013 (p<0.001). Deaths occurring at home/care home increased from 33% to 46% (p<0.001) (Figure 1). 71% of people who were a resident of a care home died in a care home. 36% of people who lived in their own home died at home (42% in hospital, 22% in hospice and other places). There had been no significant change in the percentage of deaths in hospice before and after 2008 (p=0.48).
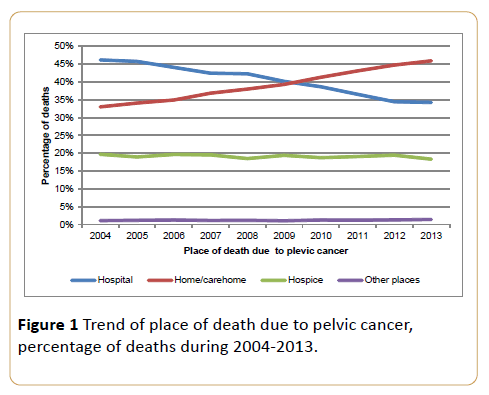
Figure 1: Trend of place of death due to pelvic cancer, percentage of deaths during 2004-2013.
Gynaecological cancer deaths at home/care home increased by 10% (30% to 40%) and hospital deaths declined by 12% (45% to 33%) between 2004-2013, whereas hospice deaths remained static (~24%). Colorectal cancer deaths in home/care home rose by 10% (34% to 44%) and hospital deaths fell by 10% (43% to 33%) with no change in hospice deaths (21%). The fall in hospital deaths for urological cancer patients was 13% (48% to 35%) accompanied by a rise in home/care home deaths by 15% (34% to 49%) and a fall in hospice death by 3% (17% to 14%). These trends are shown in Figure 2. The percentage of deaths by underlying cause of death and place of death is given in Table 1.
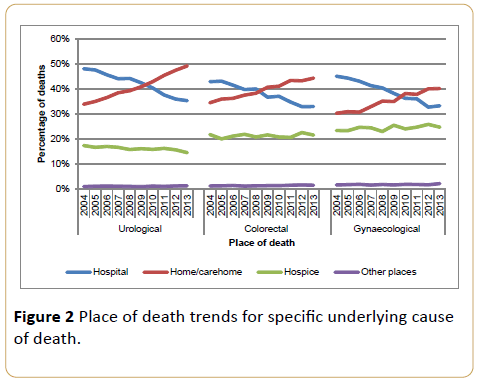
Figure 2: Place of death trends for specific underlying cause of death.
| Cause of death |
Hospital |
Home/Care home |
Hospice |
Other Places |
| Prostate |
40% |
43% |
16% |
1% |
| Bladder |
46% |
37% |
16% |
1% |
| Ovary |
39% |
34% |
26% |
2% |
| Rectum |
33% |
45% |
20% |
1% |
| Uterine |
39% |
39% |
21% |
1% |
| Recto-sigmoid |
50% |
26% |
23% |
1% |
| Cervix |
39% |
34% |
25% |
2% |
Table 1: Percentage of death by underlying pelvic cancer and place of death during 2004-2013.
Variation in place of death by deprivation quintile
Figure 3 shows trends in place of death over the study period by quintile of deprivation and illustrates that for each quintile the falling proportion of deaths in hospital had crossed below the proportion of deaths in home/care home. For each quintile the pattern of change and the year of crossover were different. The cross over point occurred later for more deprived quintiles. In 2013 the difference between proportion of deaths in hospital and home/care home was greater for least deprived (17%) than most deprived (4%). However the starting points in 2004 were very different in both groups. In the middle socioeconomic group there may be a suggestion that the trend towards home deaths had plateaued as evidenced by a 1% rise in hospital deaths in 2013 when compared to 2012. There was a significant difference in place of death after implementing the End of Life Care strategy in 2008 (Figure 4).
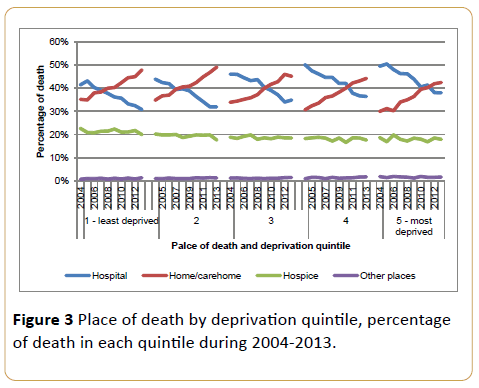
Figure 3: Place of death by deprivation quintile, percentage of death in each quintile during 2004-2013.
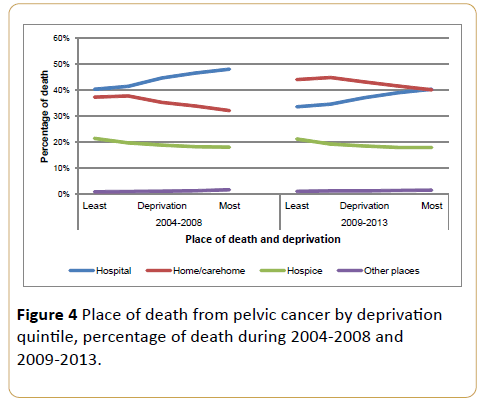
Figure 4: Place of death from pelvic cancer by deprivation quintile, percentage of death during 2004-2008 and 2009-2013.
Place of death by Strategic Clinical Network (SCN)
The proportion of hospital deaths was greatest in London (46%), exceeding the lowest, the South East (33%), by 13% (p<0.001). The South East had the highest proportion of hospice deaths (28%), whereas South West had the highest proportion (44%) of home/care home deaths. The mean fall in the proportion of hospital deaths since implementation of End of Life Care Strategy was 7%. Across SCN this varied by 6 percentage points (Southwest 10% and Thames Valley 4%).
Factors influencing place of death
We undertook a regression analysis to investigate the significance of factors which influence place of death. The variables used were sex, age, deprivation quintile, underlying cause of death, place of residence, years (2004-2013) and strategic clinical network. The details are given in Table 2.
| Variables |
% of cohort |
Unadjusted |
Fully Adjusted |
| OR |
p Value |
OR |
p value |
| Sex |
Male |
61% |
Ref |
-- |
Ref |
-- |
| Female |
39% |
0.91 (0.89-0.92) |
<0.001 |
0.97 (0.95-1) |
0.37 |
Age group
(years) |
<65 |
16.7% |
Ref |
-- |
Ref |
-- |
| 65-74 |
23.0% |
1.08 (1.06-1.12) |
<0.001 |
1.09 (1.06-1.12) |
<0.001 |
| 75-84 |
35.5% |
1.17 (1.15-1.21) |
<0.001 |
1.21 (1.18-1.24) |
<0.001 |
| >85 |
24.8% |
1.11 (1.09-1.45) |
<0.001 |
1.29 (1.25-1.33) |
<0.001 |
| Deprivation quintile |
Least deprived |
19.3% |
Ref |
-- |
Ref |
-- |
| 2 |
22.0% |
1.04 (1.01-1.07) |
<0.001 |
1.07 (1.04-1.1) |
<0.001 |
| 3 |
21.8% |
1.18 (1.15-1.21) |
<0.001 |
1.21 (1.18-1.24) |
<0.001 |
| 4 |
20.0% |
1.27 (1.24-1.31) |
<0.001 |
1.29 (1.26-1.33) |
<0.001 |
| 5-Most deprived |
16.9% |
1.35 (1.32-1.39) |
<0.001 |
1.35 (1.31-1.39) |
<0.001 |
| UCOD |
Colorectal |
20.8% |
Ref |
-- |
Ref |
-- |
| Gynaecology |
24.3% |
1.04 (1.02-1.07) |
<0.001 |
1.06 (1.04-1.01) |
<0.001 |
| Urology |
54.9% |
1.18 (1.15-1.21) |
<0.001 |
1.16 (1.13-1.19) |
<0.001 |
| Resident of a care home |
No |
91.4% |
Ref |
-- |
Ref |
-- |
| Yes |
8.6% |
0.44 (0.42-0.49) |
<0.001 |
0.4 (0.39-0.42) |
<0.001 |
| Year |
2004 |
9.8% |
1.16 (1.12-1.21) |
<0.001 |
1.18 (1.14-1.22) |
<0.001 |
| 2005 |
9.6% |
1.15 (1.11-1.91) |
<0.001 |
1.16 (1.11-1.2) |
<0.001 |
| 2006 |
9.7% |
1.08 (1.04-1.12) |
<0.001 |
1.07 (1.04-1.11) |
<0.001 |
| 2007 |
9.8% |
1.01 (0.99-1.04) |
0.762 |
1.01 (0.97-1.04) |
0.766 |
| 2008 |
9.9% |
Ref |
-- |
Ref |
-- |
| 2009 |
10% |
0.92 (0.88-0.95) |
<0.001 |
0.92 (0.88-0.95) |
<0.001 |
| 2010 |
10.1% |
0.86 (0.83-0.89) |
<0.001 |
0.86 (0.83-0.89) |
<0.001 |
| 2011 |
10.3% |
0.79 (0.76-0.81) |
<0.001 |
0.79 (0.76-0.81) |
<0.001 |
| 2012 |
10.4% |
0.72 (0.69-0.74) |
<0.001 |
0.72 (0.69-0.74) |
<0.001 |
| 2013 |
10.4% |
0.71 (0.68-0.74) |
<0.001 |
0.71 (0.68-0.73) |
<0.001 |
| Strategic clinical network |
Cheshire and Merseyside |
5% |
0.67 (0.64-0.70) |
<0.001 |
0.68 (0.65-0.77) |
<0.001 |
| East Midlands |
9.1% |
0.89 (0.86-0.93) |
<0.001 |
0.95 (0.92-0.99) |
0.014 |
| East of England |
11.7% |
0.78 (0.76-0.81) |
<0.001 |
0.83 (0.80-0.86) |
<0.001 |
| GMLSC* |
7.8% |
0.76 (0.72-0.79) |
<0.001 |
0.78 (0.75-0.82) |
<0.001 |
| London |
10.4% |
Ref |
-- |
Ref |
-- |
| Northern England |
6.5% |
0.95 (0.91-0.99) |
0.016 |
0.97 (0.92-1.01) |
0.099 |
| South East |
9.4% |
0.59 (0.56-0.61) |
<0.001 |
0.63 (0.61-0.65) |
<0.001 |
| South West |
10% |
0.71 (0.69-0.74) |
<0.001 |
0.75 (0.72-0.79) |
<0.001 |
| Thames Valley |
3.4% |
0.75 (0.71-0.77) |
<0.001 |
0.82 (0.78-0.87) |
<0.001 |
| Wessex |
5.6% |
0.9 (0.86-0.94) |
<0.001 |
0.97 (0.93-1.01) |
0.156 |
| West Midlands |
11% |
0.84 (0.81-0.86) |
<0.001 |
0.86 (0.83-0.87) |
<0.001 |
| Yorkshire and the Humber |
10% |
0.76 (0.74-0.79) |
<0.001 |
0.79 (0.77-0.82) |
<0.001 |
Table 2: Unadjusted and adjusted odds of death in hospital-variables influencing place of death.
Older age groups and residents in the most deprived areas had a higher odds of hospital death. Those aged more than 85 years had 29% higher odds of dying in hospital, compared those aged less than 65 years. Care home residents had 40% lesser odds of dying in the hospital when compared to those living in their home, OR - 0.4 (0.39-0.42). People living in the most deprived quintile had 35% higher odds of dying in the hospital, compared to the least deprived. As we go up the ladder of increasing deprivation, the chance of dying in the hospital increases (OR 1.07(1.04-1.1) to OR 1.35(1.31-1.39).
The odds of hospital death reduced from 2004 to 2013. The reduction appears to be larger after 2008. There is a 6-7% reduction in the odds of dying in the hospital after 2008. Compared to London, all the other SCNs had lower odds of death in hospital. However in North England and Wessex the difference is not significant. Pelvic cancer patients in the South East (OR- 0.63 (CI-0.61-0.65), Cheshire and Merseyside (OR-0.68 (CI-0.65-0.77) and South West (OR-0.75 (CI 0.72-0.79) were least likely to die in hospitals. Patients with urological (OR 1.16 (1.13-1.19) and gynaecological pelvic cancers (OR 1.06 (1.04-1.01) were more likely to die in hospital than those with colorectal pelvic cancer. Running the model with sitespecific causes of death (e.g. ovarian, prostate) did not change the odds ratio or statistical significance for the majority of factors. The odds ratio of hospital death for women did not reach statistical significance and indicated that women did not have a reduced odds of hospital death, OR-0.97(0.95-1.00).
Discussion
Pelvic cancers are a significant underlying cause of death, accounting for about one fifth of all cancer deaths and one in twenty (5.1%) of all deaths [1]. The complications experienced by patients dying from end stage pelvic cancers have been well documented and often necessitate hospital management which may increase the patient’s chance of dying in hospital [10-13]. The National Institute for Health and Care Excellence (NICE) in England has included specific guidance for the management of end stage pelvic cancers in their guidelines [22,23]. It is because of the overlap of complications and management that this group of cancers was analyzed together.
This national, population-based study, covering a decade, is the first to show a highly significant and large reduction in the proportion of deaths in hospital for patients dying from pelvic cancer. This is countered by an increase in deaths at home/ care home which were grouped to mirror the England National Key Performance Indicator which is Death in Usual Place of Residence (DIUPR) [6]. Hospice deaths have remained constant. Much of this change may be due to the National End of Life Care Strategy, which promoted both better care and choice for patients in where they are cared for and die [24], reinforced by the Ambitions for Palliative and End of Life Care [25]. However, there has also been a change in the demographic profile of pelvic cancer patients which may influence the observed trend. The majority of people dying from pelvic cancers are elderly and very elderly, three quarters of the deaths occurred in patients aged 70 or older and half were aged 79 or older with a 6.3% increase in the number dying aged 85 and over during the study period. Significant contributors to this are the aging demography of the population and improved survival. The changing age profile of pelvic cancer patients at death may have profound effects on the way in which they need to be cared for. The patients are likely to have significant co-morbidity and are more likely to be resident in a care home. In this study 8.6% of people were residents of care homes at the time of their death.
In a study of cancer deaths in England, similar trends for cancer deaths in general were found by Gao-Wei et al. during 1993-2010 [26]. However, our study, using more recent data, showed specifically very significant reductions in hospital deaths for pelvic cancer 46% to 34% (p<0.001) 2004-2013. In contrast to their study, we found no significant change in hospice deaths. Given the elderly profile of the pelvic cancer patients this is perhaps not surprising as cancer patients who die in hospices tend to be younger than the average age of cancer patients [26,27]. Further similarities with the Gao Wei study include the finding that increasing age and socioeconomic deprivation are important determinants of deaths in hospital. In our study, those aged 85 years and over had 29% higher odds of dying in hospital, compared to those aged less than 65 years. We also found that people living in the most deprived quintile have 35% higher odds of dying in the hospital, compared to the least deprived. However, in our study it was interesting that while hospital death rates fell in all quintiles of deprivation, the cross over point when home/ care home deaths exceeded hospital deaths was very different as shown in Figure 3. There is no statistically significant gender effect in the proportion of hospital deaths unlike in the earlier study [26].
We found a significant geographical effect on patients’ chances of dying at home/care home and this varied by Strategic Clinical Network (SCN) which were health service administrative groupings during the period of the study. Multivariate analysis showed significant variations in the proportion of deaths in hospital, being lower in South East, having odds of 63% compared to London. This may suggest difference in end of life care management across the country. London SCN has 46% hospital death when compared to South West SCN (38%). Differences in age distribution, deprivation and ethnicity will be important explanations for some of the variation. In our study we were unable to examine the influence of ethnicity. Koffman et al. in England has shown that ethnicity is an important factor influencing place of death [28]. In his population based study, he demonstrated that people from Black Asian and Minority Ethnic (BAME) groups are more likely to die in hospital than home, However, within BAME groups the picture is complex and a variety of factors influence patient and family choice of place of death and resources for caring at home [28]. London has a large ethnic population [29]. However, demography is not the only explanation, provision of specialist and generalist palliative care varies from area to area [29].
A new finding, not previously reported, is the impact of living at home or in a care home on place of death for cancer patients. The chances, for patients, of dying where they normally lived was markedly higher for residents of care homes (71%), than for for those living at home (36%). Care home residents had 40% lesser odds of dying in the hospital when compared to those living in their home, OR - 0.4 (0.39-0.42). This has important policy implications. In care homes, professional care or support is available 24 hours per day which is not available at home. Professional care at home would almost certainly need to be intensive [30-33] but will have to be supplemented by family and friend care giver, if dying elderly patients with pelvic cancer were not to be left completely alone between care visits [33]. This study was not able to compare the characteristics of care home residents with home residents to understand more about whether the differences in place of death are due to patient characteristics or service provision This should be the subject of further research as it may give insight into whether it is patient characteristics or quality and intensity of care which are most important in enabling patients to be cared for where they live until death. The continued effect after adjustment in the model suggests that differences in care/service provision between care homes and individual’s homes is very important in allowing people to remain in their place of residence. Variation in care home beds provision shown in the End of Life Care Local Authority Profiles for England may influence geographical variations in place of death [29,34].
The strengths of this study are the very large data set used which has enabled analysis of trends and exploration of demographic determinants of place of death. The weaknesses of the study are that we could not measure any aspects of care given in the community, especially the input from Specialist Palliative Care and home care from Hospices and other community based support. The data also lacked marital status and ethnicity, both of which have previously been shown to be important (Gao Wei). The routine dataset used does not include any direct measure of quality of care or how the place of death accorded with the patients wish. Quality issues reflecting patient and family care experiences should be a focus for research with this group of patients.
Conclusion
This study has shown that the number of patients dying from pelvic cancer and the age at which they die are both increasing in England. This pattern is likely to be mirrored across the industrialized world. Despite this there has been a significant fall in hospital deaths and increase in deaths in usual place of residence. This trend is seen across all socio economic groups but the trend started later in the most deprived quintile of the population. Up to 2013, there was no indication of this trend slowing except perhaps in the middle deprivation group. Although age and deprivation are important predictors of hospital death it is clear that if a person is already resident in a care home they have a very high chance (70%) of being cared for there until the end of their life. There should be further service evaluation to ascertain if terminal symptoms related to their pelvic cancers are being adequately managed in care homes. Further research work should be undertaken to examine the clinical reasons for admission to hospital for those who die in hospital comparing these for patients admitted from their own homes and care homes after controlling for age. There needs to be a greater understanding of the contribution made by variation in service provision to geographical variation in place of death.
18192
References
- Annual Mortality Extract (2015) Office of National Statistics, England and Wales (ONS).
- Gomes B, Calanzani N, Curiale V, McCrone P, Higginson IJ (2013) Effectiveness and cost-effectiveness of home palliative care services for adults with advanced illness and their caregivers. Cochrane Database of Systematic Reviews.
- Gomes B, Calanzani N, Higginson IJ (2011) Local preferences and place of death in regions within England 2010. Cicely Saunders Institute / Kings College, London.
- https://www.endoflifecare-intelligence.org.uk/data_sources/place_of_death (accessed 9/2016)
- Emanuel E, Bekelman JE, Halpern SD, Blankart CR,Bynum JP, et al. (2016) International comparison of site of death, resource utilization, and hospital expenditures for patients dying with cancer in 7 developed countries. JAMA315: 1-12.
- https://www.gov.uk/government/uploads/system/uploads/attachment_data/file/213730/dh_130570.pdf
- https://www.gov.uk/government/uploads/system/uploads/attachment_data/file/407244/CHOICE_REVIEW_FINAL_for_web.pdf
- https://www.ons.gov.uk/peoplepopulationandcommunity/healthandsocialcare/healthcaresystem/bulletins/nationalsurveyofbereavedpeoplevoices/2014-07-10.
- Gomes B, Calanzani N, Gysels M, Hall S, Higginson IJ (2013) Heterogeneity and changes in preferences for dying at home: A systematic review. BMC Palliative Care.
- Hope JM, Pothuri B (2013) The role of palliative surgery in gynecologic cancer cases. Oncologist.
- Chamberlain RS, Kaufman HL, Danforth DN (1998) Enterocutaneous fistula in cancer patients: Etiology, management, outcome, and impact on further treatment. Am Surg 64: 1204-1211.
- Costi R, Leonardi F, Zanoni D, Violi V, Roncoroni L (2014) Palliative care and end-stage colorectal cancer management: the surgeon meets the oncologist. World J Gastroenterol 20: 7602-7621.
- Rubinsak L, Carter J (2016) Palliative care of the patient with advanced gynecologic cancer. Medscape.
- Gomes B, Higginson IJ, Calanzani N, Cohen J, Deliens L, et al. (2012) Preferences for place of death if faced with advanced cancer: a population survey in England, Flanders, Germany, Italy, The Netherlands, Portugal and Spain. Annals of Oncology 23: 2006-2015.
- Gomes B, Calanzani N, Koffman J, Higginson IJ (2015) Is dying in hospital better than home in incurable cancer and what factors influence this? A population-based study. BMC Medicine 13: 235.
- Townsend J, Frank AO, Fermont D, Dyer S, Karran O, et al. (1990) Terminal cancer care and patients' preference for place of death: a prospective study. BrMedJ 301: 415-417.
- https://www.ons.gov.uk/peoplepopulationandcommunity/healthandsocialcare/healthcaresystem/bulletins/nationalsurveyofbereavedpeoplevoices/england2015
- https://www.ons.gov.uk/peoplepopulationandcommunity/populationandmigration/populationprojections/bulletins/nationalpopulationprojections/2015-10-29.
- World Health Organisation(2011) International Statistical Classification of Diseases and Related Health Problems. 10th revision.
- https://www.endoflifecare-intelligence.org.uk/resources/publications/classsification_of_place_of_death
- Department of Communities and Local Government (2011)English indices of deprivation in 2010.
- https://www.gov.uk/government/uploads/system/uploads/attachment_data/file/136431/End_of_life_strategy.pdf
- Gao W, Ho YK, Verne J, Glickman M, Higginson IJ on behalf of the GUIDE_Care project. Changing patterns in place of cancer death in England: A population-based study. PLoS Medicine.
- https://www.endoflifecare-intelligence.org.uk/resources/publications/variations_in_place_of_death
- Koffman J, Ho YK, Davies J, Gao W, Higginson IJ (2014) Does ethnicity affect where people with cancer die? A population-based 10 year study. PLoS One.
- Masucci L, Guerriere DN, Cheng R, Coyte PC (2010) Determinants of place of death for recipients of home-based palliative care. J Palliative Care. Published winter 26 279-286.
- Fukui S, Kawagoe H, Masako S, Noriko N, Hiroko N, et al. (2003) Determinants of the place of death among terminally ill cancer patients under home hospice care in Japan. Palliative Medicine 17: 445-453.
- Fukui S, Fujita J, Tsujimura M, Sumikawa Y, Hayashi Y, et al. (2011) Late referrals to home palliative care service affecting death at home in advanced cancer patients in Japan: a nationwide survey. Annals of Oncology.
- Gomes B, Higginson IJ (2006) Factors influencing death at home in terminally ill patients with cancer: Asystematic review. BMJ 332: 515-521.
- Forder J, Fernandez JL (2012) Geographical differences in the provision of care home services in England. PSSRU Discussion Paper.