David AE Vares, Blake T Dotta, Kevin S Saroka, Lukasz M Karbowski, Nirosha J Murugan and Michael A Persinger*
Biomolecular Sciences, Behavioural Neuroscience, and Human Studies Programs, Quantum Biomoleclular Laboratory, Laurentian University, Sudbury, Ontario, Canada P3E 2C6
*Corresponding Author:
Michael A Persinger
Biomolecular Sciences
Behavioural Neuroscience, and Human Studies Programs
Quantum Biomoleclular Laboratory, Laurentian University
Sudbury, Ontario, Canada P3E 2C6
Tel: 01-705-67-4824
Fax: 01-705-671-3841
E-mail: mpersinger@laurentian.ca
Received date: 25 May 2016; Accepted date: 27 June 2016; Published date: 30 June 2016
Keywords
Biophotons; Human presence; Photomultiplier units; Hyperdark environments; Spectral power densities
Introduction
All living systems display ultra-weak photon emissions (UPE) that can be easily discerned by modern photomultiplier units. The human body is composed of several tens of trillions of cells and bacteria. Several researchers [1,2] have suggested that the primary communication between cells and bacteria involves UPE. The typical median value for the flux density of biophoton emissions is in the order of 10-12 W·m-2. Photonic fields have the capacity to mediate large amounts of information that reflect the states of the human volume. We have been pursuing the possibility that the appropriate measurements of spectral power densities (SPD) from different positions around a human body sitting within a hyper-dark environment might reflect the cellular conditions anywhere within that volume. Rather than improving the techniques of imaging, our focus has been enhancing the precision of early detection.
Quantitative electroencephalographic activity has been employed for decades to infer the dynamic status and deviation from normality of relatively small volumes of cells deep within the human cerebrum. Even though the primary source of this activity originates from neurons within the outer regions (the cortices) of the cerebrum and millions of individual neurons are involved with the complex signatures that are measured by the array of surface sensors, the quantitative information can be both remarkably precise and revealing. We have adopted this approach for whole body UPE. Our operational model is the photon densities generated from the human body surface, which are in the order of 106 to 107 photons per second per meter-squared or about 10-12 W·m-2, display a field or holographic-like property. This means that with the appropriate mathematical tools and precision, the smallest component or unit that contributes to the whole field (even from sources deep within the volume) should be discernable.
Biophoton emissions with the properties of a field or a dynamic matrix whose configuration changes systematically in space-time (a tensor) have been inferred or measured for at least 100 years. The imaginative research with substantial diagnostic potential by Kilner [3] during the late 19th century required viewing the human body through solutions containing coal-tar derivatives such as Dicyanine A [4] whose chemical composition was later found to be difficult to verify and to duplicate. The subsequent development of the photomultiplier unit which removed the involvement of the human visual system from the process allowed quantitative measurements. The quintessential researcher F. A. Popp and his colleagues [5-7] have both articulated the theory and the technology for measuring these “permanent photon currents” within the spectral range of 200 - 800 nm. The systematic and innovative research by the Van Wijks [8-10] employed a highly sensitive charge-coupled device camera to discern the range of UPE within various regions and symmetries of the human body. Their approach emphasized imaging rather than detection.
Here we demonstrate that a relatively inexpensive technique that requires only 100 s of measurement of photon emissions from the three spatial planes involving four photomultiplier units can readily discern if a human being is either present or not within the detection volume. The spectral power density profiles of the amplitude distributions of the flux densities are sufficiently complex, in a manner similar to that obtained from mass spectrometry for complex molecules, to allow the degrees of freedom to discern a range of potential dynamic sources. Sampling a photonic field with only four units does not saturate the surface area. This may not be a limit. We consider this similar to listening to a conversation in a room. One can be anywhere within that volume and hear the same conversation. The critical feature is discerning the “voiceprint” or the information within the energy.
Methodology
Human biophoton measurements were recorded within a specially constructed chamber. It housed all photomultiplier tubes (PMTs) or units and maintained a consistent background dark count. The dimensions of the dark box chamber were 1.70 m in height, 1.27 m width and 1.32 m in length. Four photomultiplier tubes (SENS-TECH LTD) were permanently housed within the dark box chamber. Each was positioned on a direct plane with which the participant, approximately 15 cm from where the participant, would sit. The PMT known as the Front PMT was located directly in front of the participant’s torso. The Back PMT was located directly behind the participant’s torso. The Head PMT was located next to the right temporal lobe of the participant. The Z-plane (or top) PMT was located directly above the participant.
Figure 1 illustrates the dark box chamber and locations of the PMT measurement devices. To maintain a consistent background dark count, the entire chamber was draped with high stitch count fabric during data collection. Human participants were instructed to sit inside the dark box and relax for approximately 5 minutes. Multiple measurements were collected for 100 seconds at 50 Hz from 4 simultaneously running PMTs. Measurements were always recorded from all four PMTs simultaneously (± 500 msecs). All PMTs were ~15 cm away from the subject. All data from each PMT are standardized and averaged per trial.
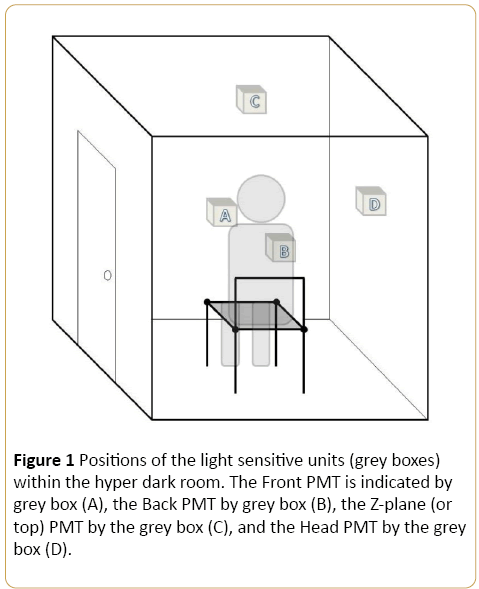
Figure 1: Positions of the light sensitive units (grey boxes) within the hyper dark room. The Front PMT is indicated by grey box (A), the Back PMT by grey box (B), the Z-plane (or top) PMT by the grey box (C), and the Head PMT by the grey box (D).
Results
Human biophoton classification
The four values (from each PMT) per trial were summed and averaged to create a single aggregate score for each trial (as opposed to 1 average from each of the 4 PMTs). This aggregate score produced 100% classification between human and no human hyper-dark conditions. Additional aggregate score variables that were associated with significant differences between conditions (human vs. no human) were: trial mean, variability of the variability, maximum photon counts, and the absolute separation between maximum and minimum photon counts (effect sizes ranged from 45% to 76%). The effect for the absolute separation between maximum and minimum photon counts is presented in Figure 2 [F(1,6) = 15.1, p = 0.012, η2 = 0.76]. It is evident that there was no overlap between the two conditions. This was also clear for overall means. This produced perfect classification accuracies for both variables.
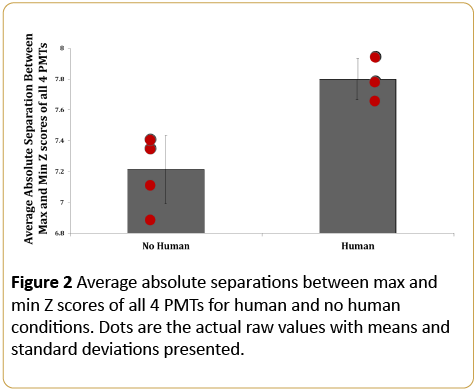
Figure 2: Average absolute separations between max and min Z scores of all 4 PMTs for human and no human conditions. Dots are the actual raw values with means and standard deviations presented.
Human biophoton spectral characteristics
To investigate spectral signatures, human biophoton sessions were completed for nine (9) individuals within the hyper-dark environment. Each individual completed at least two (2), 100 second sessions of PMT recording at 50 Hz. Background empty chamber PMT recordings were also taken for a combined total of N = 68 sessions (34 Human + 34 Background). PMT recordings were z-scored, and spectral analyses were completed with SPSS. One-way analysis of variance for the spectral density variance was conducted on all 2,500 frequencies to discern the greatest F statistic between the empty chamber and human PMT condition (Figure 3).
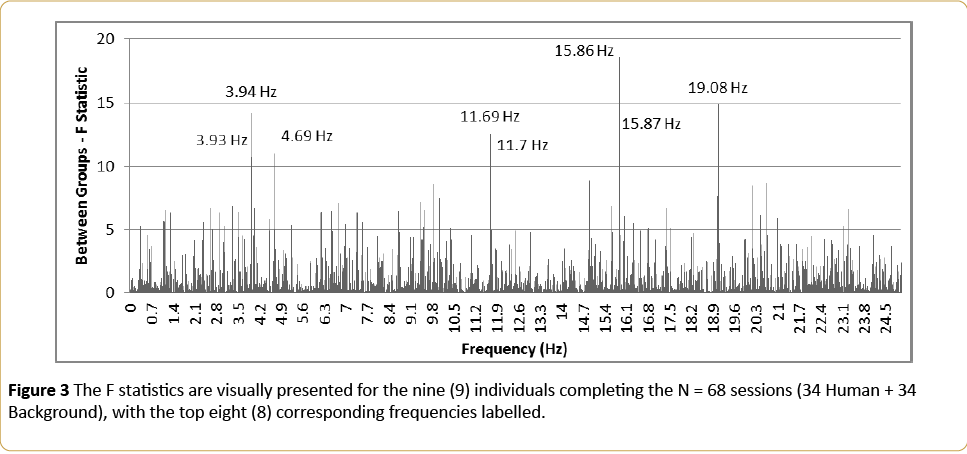
Figure 3: The F statistics are visually presented for the nine (9) individuals completing the N = 68 sessions (34 Human + 34 Background), with the top eight (8) corresponding frequencies labelled.
The top corresponding frequencies were entered into a further discriminant analysis and revealed one function which explained 78.4% of the classification (canonical r = 0.669). The combination of four (4) discriminant function coefficients significantly differentiated the chamber condition [Λ = 0.552, Χ2(4) = 41.561, p < 2.06 x 10⁻⁸] with the function given by the equation: Function = 0.066*(3.93 Hz) - 0.052*(11.7 Hz) - 0.064*(15.86 Hz) + 0.062*(19.08 Hz) – 0.208. It should be noted that this was not the only characteristic of a human biophoton signature. It was the most frequently consistent configuration. The visual representation of the discriminant function is presented in Figure 4.
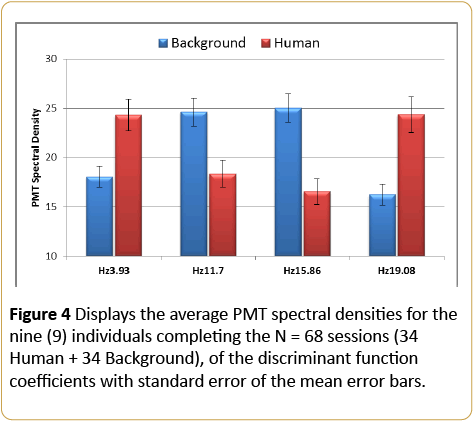
Figure 4: Displays the average PMT spectral densities for the nine (9) individuals completing the N = 68 sessions (34 Human + 34 Background), of the discriminant function coefficients with standard error of the mean error bars.
Discussion
The results of these experiments indicate that a relatively inexpensive technique can discern the presence or absence of a human being within a closed space by measuring the ambient photon emissions for only 100 s. An aggregate score was able to produce 100% classification between human and no human hyper-dark conditions. In a further discriminant analysis, the top four (4) spectral frequencies revealed one function which explained 78.4% of the classification between the presence of a human within the dark environment as compared to an empty chamber.
Such durations of measurements of photon emissions over cultures of malignant cells or non-malignant cells have produced similar levels of very accurate discrimination [11]. The presence or absence of a living system such as a mouse within a closed chamber has been verified as well by direct photon measurements [12]. Our unpublished studies indicate that the SPD of the photon emissions from C57 mice that have been injected with mouse melanoma cells allowed reliable and discriminable differences from non-injected reference mice within 48 hr. That is more than 10 days before the tumors become visibly discernable. The application of SPD mathematics for this low sampling rate (50 Hz) and duration (20 ms) is simple, efficient, and fast.
Conclusion
The average discrepancy between human present and not present conditions (Figure 2) was approximately 7.27 spectral density units. Taking the square root of the average discrepancy yielded a value of approximately 2.7 spectral units. Multiplying the average photons per spectral unit (0.27) by the average discrepancy between conditions (2.7) resulted in a difference of about 0.7 photons. Assuming the 100 seconds of recording for each session, the average photon per second difference between the empty chamber and the human occupied condition would have been 0.007. Assuming the average photon energy was about 3·10-19 J, the energy equivalent difference between the empty chamber (PMT background) and the occupied human PMT signature was about 2·10-21 J.
The discriminating energy value is within range (including variance) of the product of the Boltzmann constant (1.38 × 10⁻²³ J·K-1) and room temperature (298 K), or approximately 4.11 × 10⁻²¹ J. This value would overlap with the relational amplitude of ambient thermal fluctuations. This value is also within the range of the Landauer Limit for the dissipation of energy from a single bit of information into entropy or the convergence of two quantum operations. It may be relevant that 0.4 × 10⁻²⁰ J is within the range of energies that is equivalent to the default Nernst solution (~26 mV) for the resting potential of the plasma cell membrane [13]. This quantity has been considered to be the pivotal value for processes involved with the differentiation between normal and malignant cells [14].
Acknowledgements
The authors thank Dr. W. E. Bosarge, CEO of Capital Technologies, Inc. and the Bosarge Family Organization for supporting this research.
9810
References
- Trushin MV (2004) Light-mediated conversation among microorganism. Microbiol Res 159: 1-10.
- Fels D (2009) Cellular communications through light. PLos ONE 4: e5086.
- Kilner WJ (1911) The human atmosphere or the aura made visible by the aid of chemical screens. Citadel: N.Y.
- Palkin S (1923) The synthesis of dicyanine A. Indust Engin Chem 15: 379-381.
- Popp FA (1979) Coherent photon storage of biological systems. In: Electromagnetic Bioinformation, Popp FA, Becker G, Konig HL and Peschka W (eds) Urban and Schwarzenberg: Munich 123-149.
- Cohen S, Popp FA (1997) Biophoton emission of the human body. J Photochem Photobiol B 40: 187-189.
- Popp FA, Li KH, Mei WP, Galle M, Neurohr R (1988) Physical aspects of biophotons. Experientia 44: 576-585.
- Van WR, Schamhart DHJ (1988) Regulatory aspects of low intensity photon emission. Experientia 44: 586-593.
- Van WR, Van Wijk EPA (2004) Human biophoton emission. Rec Res Dev Photochem Photobiol 7: 139-174.
- Van WA, Van Wijk R (2005) Multi-site recording and spectral analysis of human body spontaneous photon emission. Res Comp Classical Natur Med 10: 10-20.
- Karbowski LM, Murugan NJ, Dotta BT, Persinger MA (2015) Only 1% melanoma proportion in non-malignant cells exacerbates photon emissions: implications for tumor growth and metastases. Int J Res Mol Mech 1:2
- Dotta BT, Karbowski LM, Murugan NL, Persinger MA (2016) Cumulative residual photon power density of ~10-12 W·m-2 during mild “distress” in the same space: implications for temporal entanglement. Neuro Quantol 14: 9-15.
- Persinger MA (2010) 10-20 Joules as a neuromolecular quantum in medicinal chemistry: an alternative approach to myriad molecular pathways. Cur Med Chem 17: 3094-3098.
- Persinger MA, Lafrenie RM (2014) The cancer cell plasma membrane potentials as energetic equivalents to astrophysical properties. Int Lett Chem Phys Astron 17: 67-77.