Gaikwad A Sucheta *, Kale A.Asha, Gadkari V.Tushar, Deshpande R.Nirmala, Salvekar P.Jyoti
Dr. T. R. Ingle Research Laboratory, Department of Chemistry, S. P. College, Pune – 30
- Corresponding Author:
- Gaikwad A Sucheta
Dr. T. R. Ingle Research Laboratory
Department of Chemistry
S. P. College, Pune – 30
Tel: 9850589777
E-mail: suchetag2000@yahoo.com
Date of Submission: 03-05-2011Date of Acceptance: 05-06-2011
Citation: Gaikwad A Sucheta *, Kale A.Asha, Gadkari V.Tushar, Deshpande R.Nirmala, Salvekar P.Jyoti, “Standardization Of Emodin-An Bioactive Molecule, Using Spectral Methods” ”, Int. J. Drug Dev. & Res., July-Sep 2011, 3(3):259-265
Copyright: © 2010 IJDDR, Japan Patel et al. This is an open access paper distributed under the copyright agreement with Serials Publication, which permits unrestricted use, distribution, and reproduction in any medium, provided the original work is properly cited.
Keywords
Spectrophotometric Method, standerdization, Accuracy, Emodin.
Introduction
Antibiotic resitance from pathogenic microorganism renders drug ineffective and calls for improved designing and development of new drugs.Various medicinal plants contain 1,8- Dihydroxyanthraquinone and its derivatives that, have been isolated from various botanical families such as Rhamnaceae (buckthorn,cascara), liliaceae(aloe), polygonaceae(rhubarbs) and Caesalpiniaceae(senna)[1]. Emodin isolated from cassia family such as Cassia fistula, Cassia auriculata L , posses potent antimicrobial activity against skin infecting pathogenic organisms[2,3].Emodin is a biologically active, naturally occurring anthraquinone derivative[4]. From ancient times, herbal extracts of c. auriculata have been used in medical treatment[5]. Several scientific studies of its biological activity have been performed[5]. More recently, investigations are stressed towards spectral methods. The aim of the present study is to validate the potency of the molecule by UV-VIS and Infrared spectral methods. Various methods have been reported in the literature for the analysis of emodin[6] . The objective of the present study is to develop simple, precise, accurate and economic analytical method for the standardization of emodin. The developed analytical method is validated as per the ICH (International Conference on Harmonisation) guidelines[7]. Present study is carried out from various extracts of various parts of C. auriculata L along with biomarker like emodin.
Materials and Methods
All chemicals and solvents used were of Spectroscopic grade. Emodin, standard compound was procured from Sisco Research Laboratory. UVVIS was recorded on Schimadzu UV-1700 Spectrophotometer. The IR Spectra (4000-350cm-1) was recorded on Shimadzu FTIR84005 spectrophotometer.
Preparation of Standard Solution
Accurately weighed emodin (1mg) was, transferred to 10 ml volumetric flask and dissolved with methanol to get a standard solution of 100μg/ml.
Preparation of reagents
1. Unhydrous Sodium acetate reagent was used as it is.
2. Aluminium chloride solution (5%)
3. Sodium methoxide (2.5%)
4. NaOH (5%)
Collection of Plant materials and preparation of extracts
Cassia auriculata L was collected from Western Pune, Maharashtra, India. The taxonomic identification was carried out with the help of Flora of Botany Presidency and Flora of Maharashtra (Singh et al.2000) and herbaria were prepared by following standard methods. The specimen was authenticated at, Botanical survey of India, Maharashtra, India .Its voucher specimen number is BSI/WC/Tech/2009/95.
Air shade dried and pulverized parts of plant material was used. Extracts were prepared using exact weighed sample powder by refluxing in solvents such as acetone,ethanol,methanol. The solvents were recovered under reduced pressure .The dried extracts were used for the experiments.
Determination of λ max
Standard solution (100μg/ml) was scanned in UVVIS range (200-800nm) for maximum absorbance after enabling blank correction for methanol in the above region. The maximum absorbance(437nm) was observed.
Results and Discussion :
Calibration curve
Various concentrations (10-100 μg/ml) of standard solution were prepared using methanol. The absorbance was measured at 437nm against a solvent blank and from it validation parameters were calculated (Table 1).
Stability Profile
Stability of absorbance is of major importance in Spectrophotometric measurements. The period over which absorbance at 437 nm of emodin in methanol remain stable was investigated using concentration range(10-100μg/ml). The absorbance were measured for above solutions at 15 min intervals for a period of 1 hour.
Spectral shift study:
Emodin was verified with spectra shift reagents like NaOMe, NaOAc, AlCl3.The stock solution of emodin was used along with the above mentioned of reagents.The shifts in absorption with respect to λ max of emodin and comparitive spectral peak scans for the different spectral reagents were recorded. (fig 2).The analytical parameters such as Molar extinction coefficient, PH , conductivity are recorded under same set of condition (Table 3).
IR spectral study
IR spectra were recorded in Nujol under same set of condition for the test solutions A,B,C,D over a range of 4000-400cm-1 to study the change in stretching and bending frequency of carbonyl and the hydroxyl group region of emodin(Table 4).
Emodin content in different extracts of plant parts
Weighed amounts of dried extracts were dissolved in known volume of methanol. The absorbance of the resultant solution was scanned in UV-VIS range (200-800nm) for maximum absorbance after enabling blank correction for methanol in the above region(Table 5).
The UV spectra of emodin was measured in the range 200-400 nm against methanol as blank solution (Fig. 1). The standard solution shows a broad band of absorption ranging from 200 - 400 nm was observed with λmax at at 437nm,299nm,260nm (Fig.1). From the UV spectra it is clarified that the 437 nm was the maximum UV absorption wavelength for emodin.

Fig.1:UV-VIS spectral scan of Emodin
System precision study: Calibration curve obtained from various concentrations for emodin guides the linear regression equation with a regression coefficient. Standard deviation (SD=0.0012) of Beer’s law is obeyed in the concentration range of 10–100 μg/ml (r2 = 0.973) in methanol.
Linearity-The linearity range for emodin is found to be 10–100 μg/ml(r2 = 0.973) in methanol.(Table 1). The lower values of the standard error (SE) of slope and intercept (Table 1) indicates high precision of the proposed method.
| Drug |
4 µg/ml |
8 µg/ml |
15 µg/ml |
30 µg/ml |
60µg/ml |
125 µg/ml |
| AENA |
20.33 ± 0.002* |
21.45 ± 0.001* |
22.82 ± 0.001* |
29.70 ± 0.001* |
35.50 ± 0.001* |
46.35 ± 0.002* |
| EENA |
27.02 ± 0.002* |
29.31± 0.002* |
31.85 ± 0.001* |
33.31 ± 0.001* |
45.44 ± 0.002* |
47.03 ± 0.002* |
| Vit C |
0.1 µl/ml |
0.2 µl/ml |
0.4 µl/ml |
0.6µl/ml |
0.8 µl/ml |
1 µl/ml |
| |
5.82 ± 0.002 |
14.12 ± 0.001* |
28.21 ± 0.001* |
45.18 ± 0.003* |
61.25 ± 0.001* |
77.12 ± 0.001* |
AENA = Aqueous extract of Nymphaea alba, EENA = Ethanolic extract of Nymphaea alba.* P < 0.001 compared to reagent blank.
Table 1: In vitro free radical scavenging effect of Nymphaea alba extract by DPPH method
Accuracy: The accuracy ranges from 10 to100 μg/ml (Table 2). The excellent mean percentage recovery values are close to 100 %.The standard deviation values (SD <1.0) indicate high accuracy of the analytical methods.
| Drug |
25 µg/ml |
50 µg/ml |
100 µg/ml |
200µg/ml |
400µg/ml |
| AENA |
16.21 ± 1.13 |
28.52 ± 1.11 |
33.62 ±0.82 |
46.71 ±1.21 |
52.20 ±0.76 |
| EENA |
17.14 ±1.11 |
29.47 ±0.82 |
41.52 ± 0.45 |
57.17 ± 0.58 |
72.25 ± 0.92 |
| Vit C |
10 µg/ml |
20 µg/ml |
40 µg/ml |
60µg/ml |
80 µg/ml |
| |
26.34 ±0.95 |
40.51 ±0.72 |
55.21 ± 0.84 |
67.32 ± 0.52 |
78.42 ± 0.45 |
AENA = Aqueous extract of Nymphaea alba, EENA = Ethanolic extract of Nymphaea alba.* P < 0.001 compared to reagent blank.
Table 2: In vitro free radical scavenging effect of Nymphaea alba extract by hydroxyl radical scavenging method.
Detection limit: The detection limit of an individual analytical procedure is the lowest amount of analyte in a sample, which can be detected but not necessarily quantified as an exact value. The limit of detection of emodin by the proposed method was found to be 0.41μg/ml(Table 2).
Quantification Limit (LOQ): The quantification limit of an individual analytical procedure is the lowest amount of analyte in the sample which, can be quantitatively determined with suitable level of precision and accuracy. The limit of quantification of emodin by the proposed method was found to be 1.25μg/ml(Table 2).
Stability : Stability of absorbance is of major importance in Spectrophotometric measurements. The period over which absorbance value at 437nm of emodin in methanol remains stable is investigated using concentration range (10-100μg/ml). The absorbance values are measured at 15 min intervals over a period of 1 hour. Results reveals absorption stability(Table 2).
Emodin(A) shows absorption maxima at437nm,299nm,260nm. Maximun absorption wavelength at 437nm is selected and further changes in absortion maxima with reagents are studied. The test sample B shows the bathochromic shift in absorption maxima having broad region at 495 and 467nm. The test solution C shows longer bathochromic shift at 526 nm as sodium methoxide being a weaker base ,it takes acidic hydroxyl proton. The test solution D indicates bathochromic shift having absorption maxima at 482nm by forming stable complex between ortho dihydroxyl groups and keto function. (Fig.2). Although addition of all reagents show bathochromic shift but intensity of the absorption has been reduced as compared to emodin in all solutions causing hypochromic shift.It is maximum with aluminium chloride and minimum with sodium hydroxide causing distortion in geometry of the formed molecule. (Table 3).
| Drug |
4 µg/ml |
8 µg/ml |
15 µg/ml |
30 µg/ml |
60µg/ml |
125 µg/ml |
| AENA |
1.25 ± 0.002 |
6.35 ± 0.001* |
6.71 ± 0.003* |
7.73 ± 0.003* |
9.42 ± 0.004* |
15.72 ± 0.001* |
| EENA |
43.21 ± 0.002* |
43.72±
0.002* |
43.35 ± 0.001* |
44.51 ± 0.001* |
44.62 ± 0.002* |
47.25 ± 0.002* |
| Vit C |
0.1 µl/ml |
0.2 µl/ml |
0.4 µl/ml |
0.6µl/ml |
0.8 µl/ml |
1 µl/ml |
| |
3.21 ± 0.002 |
13.46 ± 0.001* |
32.13 ± 0.001* |
41.24 ± 0.003* |
63.31 ± 0.001* |
76.40 ± 0.001* |
AENA = Aqueous extract of Nymphaea alba, EENA = Ethanolic extract of Nymphaea alba.* P < 0.001 compared to reagent blank.
Table 3: In vitro free radical scavenging effect of Nymphaea alba extract by nitric oxide scavenging method
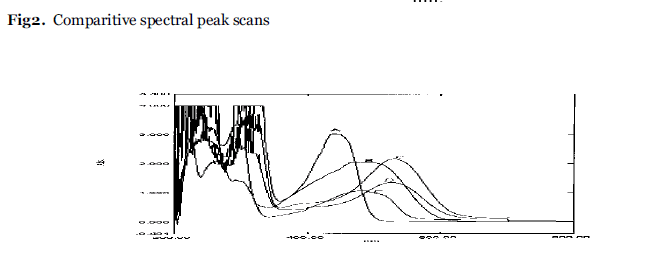
Fig.2:Comparitive spectral peak scans.
Infrared spectra of of emodin-A shows frequency at 3391 cm-1 that assigned to hydroxyl groups. Characteristic bands for anthraquinones are 1666 cm-1 and 1620 cm-1 assigned to the free carbonyl group and the conjugated carbonyl group stretching frequencies respectively. The observed frequency at 1475 cm-1 is assigned to a skeletal ring stretching frequency. The change in characteristic bands for B, C and D for hydroxyl as well as for carbonyl groups have been shifted to higher frequency indicate complex formation with the used reagents. (Fig.3). The change in pH and conductivity is also confirms the complex formation. (Table 4).
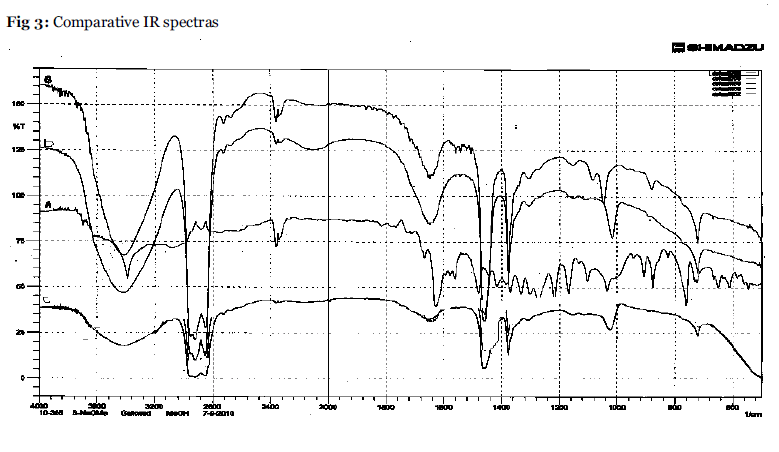
Fig.3:Comparative IR spectras.
Emodin content measured by developed method for various part of Cassia auriculata L in various extracts shows leaves and fruits extracts shows comparatively higher content than stem. Acetone extract of leaves and methanol extract of fruits shows nearly same content of emodin (Table 5).
The proposed method stability, new approach to isolate and formulate content of emodin will be definitely helpful for the quantification of drug formulations and in various plant part extracts thus it will be useful for the validation study in plant parts as well as drugs.
Acknowledgement:
The authors are thankful to the Principal, S.P.College and Head,Department of Chemistry, S.P.College, Pune-30 for providing experimentation facilities.
Conflict of Interest: NIL
Source of Support: NONE
5653
References
- Singh NP, Gupta AP, Sinha AK, Ahuja PS High Performance thin layer chromatographic method for quantitative determination of four major anthraquinone derivatives in Rheum Emodi. J Chromatogr A. 2005; 1077: 202–206
- Yan-bin shi, Yan-ping shi, Yan-biao yang,Guang feng Simultaneous determination of tetrahydro palmatine, Magnolol, emodin and chrysophanol in Chinese herbal preparation by RP-HPLC-PDA. 2007; 65:601-606.
- Qu HB, Ma YH, Yu K, Cheng YY Simultaneous Determination of eight active components in Chinese medicine ‘YIQING’ capsule using high performance liquid Chromatography. J Pharm BiomedAnal.2007; 43:66–72
- Subash CV, Singh NP, Sinha AK Determination of locational variations in the quantity of hydroxyl anthraquinones and their glycosides rhizomes of rheum emodi using High performance liquid chromatography. J Chromatogr A. 2005; 1097:59– 65
- Wu YT, Lin LC, Tsai TH Determination of Honokiol and Magnolol in magnolia officinalis by liquid chromatography with tandem mass spectroscopy. Biomed Chromatogr. 2006; 20:1076– 1081
- Lv HX, Wang JB, Wang XC, Lin XC, Wu XP, Xie ZH Rapid separation and determination of structurally related anthraquinones in Rhubarb by pressurized capillary electrochromatography. J PharmBiomed Anal. 2007; 43:352–357
- Tian K, Zhang HG, Chen XG, Hu ZD Determination of five anthraquinones in medical plants by capillary zone electrophoresis with beta- cycledextrin addition. J Chromatogr A. 2006; 1123:134– 137
- Wang AF, Zhou Y, Wu F, He PG, Fang YZ Determination of active ingredients in Huangden Yinchen keli by capillary zone electrophoresis.


