Keywords
Neutrophil to lymphocyte ratio, Slow coronary flowslow coronary flow, Tp-e interval, Tp-e/QT ratio
Introduction
Slow coronary flow (SCF) is an angiographic finding characterized by delayed opacification of epicardial coronary arteries without obstructive coronary disease [1]. The etiopathogenesis of SCF is not fully understood. However, microvascular dysfunction [1], endothelial dysfunction [2], small vessel disease [3], diffuse atherosclerosis [4], vasomotor dysfunction [5], and increased inflammatory [6] and thrombotic [7] activities are potential causes. Thus, the frequency of cardiovascular complications is increased in SCF patients. This includes impairment of left ventricular systolic and diastolic function [8], acute coronary syndromes [9], and sudden cardiac death due to malignant ventricular arrhythmias [10].
In these patients, increased sympathetic activity may cause cardiac arrhythmias and cardiovascular death by causing electrical disturbances during ventricular repolarization [11]. QT dispersion (QTd), corrected QT dispersion, and transmural dispersion of repolarization are different ways to assess myocardial repolarization [12]. The Tp-e interval, defined as the duration between the peak and the end of the T wave on a surface ECG, is an indicator of the total dispersion of repolarization [13]. In addition, Tp-e might be a predictor of ventricular tachycardias and cardiovascular mortality [14,15]. However, changes in body weight and heart rate affect the Tp-e interval [16]. To address this issue, the Tp-e/QT ratio was suggested as a more accurate measure for the dispersion of ventricular repolarization compared to QTd, corrected QTd, and Tp-e intervals, and to be independent of alterations in heart rate [16,17]. The total white blood cell (WBC) count and its subtypes, such as neutrophil, lymphocyte, and neutrophil/lymphocyte ratio (NLR), can be used as an indicator of systemic inflammation [18].
There is no study comparing between arrhythmia markers and the degree of inflammation so far.
Thus we evaluated ventricular repolarization by using the Tp-e interval and Tp-e/QT ratio in SCF patients, and assessed the relationship of these measurements with inflammation.
Methods
Patient population
A total of 46 patients with angiographically proven normal coronary arteries and SCF (39 males and 7 females, mean age 50 ± 8 years) and 44 patients with normal coronary arteries and normal coronary flow (31 males and 13 females, mean age 50 ± 4 years) were included in this study. Medical history, physical examination and blood biochemistry were evaluated in two groups. We excluded patients with left ventricular dysfunction and hypertrophy, bundle branch block, rheumatic valve disease, thyroid dysfunction, anemia, electrolyte imbalance, chronic lung, hepatic and renal disease, active infection, atrioventricular conduction abnormalities on ECG or without a clear QT segment for analysis, non-sinus rhythm or any patients taking anti-arrhythmics, tricyclic antidepressants, anti-histamines, or antipsychotics. We also excluded patients with coronary ectasia and vasospasm. In all subjects, echocardiographic examinations were performed using a Vivid 7 Pro, 2–4 MHz phased array transducer (GE, Horten, Norway). The measures of left ventricle structure and function were performed according to the criteria of the American Society of Echocardiography guidelines [19].
The study was performed in accordance with the principles stated in the Declaration of Helsinki and approved by the local Ethics Committee. Informed consent was obtained from all patients prior to the study.
Coronary angiography and determination of SCF
Coronary angiography was performed by femoral approach using the standard Judkins technique with a rate of 30 frames/s (AlluraXper FD10, Philips Healthcare, Best, The Netherlands). The patients were assessed for the presence of SCF during coronary angiography and coronary flow rates were quantified by the TIMI frame count. For objective quantification of the coronary flow, two independent observers blinded to the clinical data of the study participants, assessed the coronary flow in coronary arteries using TIMI frame count method [20]. In this method, the number of cine frames, recorded at 30 frames/s, required for the contrast to reach standard distal coronary landmarks in left anterior descending (LAD), left circumflex (LCx) and right coronary arteries (RCA) are noted. Predefined distal landmarks are the distal bifurcation for the LAD, commonly referred to as the ‘pitchfork’ or ‘whale’s tail’, the distal bifurcation of the segment with the longest total distance for the LCx, and the first branch of the posterolateral artery for the RCA. The standard mean values for normal visualization of coronary arteries are described as 36.2 ± 2.6 frames for LAD, 22.2 ± 4.1 frames for LCx and 20.4 ± 3 frames for RCA. As the LAD coronary artery is usually longer than the other major coronary arteries, the TIMI frame count for this vessel is often higher. Therefore, the TIMI frame count for LAD is divided by 1.7 to obtain the corrected TIMI frame count. The standard corrected TIMI frame count for LAD coronary artery is 21.1 ± 1.5 frames. All participants with a corrected TIMI frame count greater than the two standard deviation of the previously published range for the particular vessel were considered to have SCF [20]. The mean TIMI frame count for each patient and control participant was calculated by dividing the sum of the TIMI frame count of the corrected LAD, LCx and RCA by three.
Electrocardiography
The 12-lead ECG was recorded at a paper speed of 50 mm/s (Nihon Kohden, Tokyo, Japan) at rest in the supine position. Resting heart rate was measured from the ECG taken during the patient evaluation. ECG measurements of QT and Tp-e intervals were performed by two cardiologists who were blind to the patient data. To decrease the error measurements, QT and Tp-e intervals were measured manually with calipers and magnifying glass. Subjects with U waves on their ECGs were excluded from the study. An average value of three readings was calculated for each lead. The QT interval was measured from the beginning of the QRS complex to the end of the T wave, and was corrected QT was calculated according to Bazett's Formula to adjust for heart rate. The QTd was defined as the difference between the maximum and minimum QT interval of the 12 leads. The Tp-e interval was defined as the interval from the peak of T wave to the end of T wave and was corrected for heart rate. Measurements of Tp-e interval were performed from precordial leads. The Tp-e/ QT ratio was calculated from these measurements. Interobserver and intraobserver coefficients of variation were 3.5% and 3.8%, respectively.
Laboratory analyses
Fasting blood glucose, serum creatinine, total cholesterol, electrolits, and thyroid-stimulating hormone levels were recorded. Blood samples were drawn by venipuncture to perform routine blood chemistry. Total and differential leukocyte counts were measured by an automated hematology analyzer. Absolute cell counts were used in the analyses. Baseline NLR was measured by dividing neutrophil count to lymphocyte count.
Statistical analysis
The SPSS 15.0 statistical program (SPSS Inc., Chicago, Ill.) was used for the statistical study. All values are given as mean ± standard deviation. Mean values of continuous variables were compared between groups using the Student t test or Mann–Whitney U test, according to whether normally distributed or not, as tested by the Kolmogorov–Smirnov test. The Chi-square test was used to assess differences between categorical variables. Pearson’s correlation co-efficients were used to assess the strength of relationship between continuous variables. A P value of <0.05 was considered significant.
Results
Clinical characteristics and laboratory findings of the two groups are shown in Table 1. Age, sex, body mass index, smoking status, systolic and diastolic blood pressure, heart rate, left ventricular end-diastolic dimension, left ventricular end-systolic dimension, and left ventricular ejection fraction were similar in the two groups (p>0.05). Thrombolysis in Myocardial Infarction frame count (TFC) measured from all three major epicardial coronary arteries and mean TFC were significantly higher in patients with SCF compared to the controls (all p values <0.001; Table 1). Neutrophil to lymphocyte ratio (NLR) was significantly higher in patients with SCF when compared with controls (p<0.001, Table 1).
| Variables |
Patients with SCF (n=46) |
Control group (n=44) |
P Value |
| Age (years) |
50 ± 8 |
50 ± 4 |
0.911 |
| Gender (female, %) |
15.2% |
29.9% |
0.104 |
| BMI (kg/m2;) |
26.5 ± 3.0 |
25.4 ± 2.7 |
0.820 |
| Diabetes mellitus n (%) |
17.3% |
15.9 % |
0.852 |
| Hypertension n (%) |
23.9% |
22.7% |
0.896 |
| Cigarette smoking n (%) |
54.3% |
36.4% |
0.090 |
| Heart rate (beats/min) |
74.7 ± 8 |
75.9 ± 9 |
0.693 |
| Systolic BP (mmHg) |
126.9 ± 7.1 |
126.8 ± 5.5 |
0.971 |
| Diastolic BP (mmHg) |
72.5 ± 5.2 |
71.6 ± 6 |
0.546 |
| LVEDD (mm) |
47.1 ± 2 |
46.6 ± 2 |
0.291 |
| LVESD (mm) |
32.6 ± 2 |
32.1 ± 2 |
0.288 |
| LVEF (%) |
61 ± 2 |
61.8 ± 3 |
0.267 |
| WBC, 103;/Ml |
7.85 ± 1.1 |
7.02 ± 1.2 |
0.155 |
| Neutrophil, 103;/mL |
4.58 ± 1.2 |
4.08 ± 0.9 |
0.038 |
| Lymphocyte, 103;/mL |
2.07 ± 0.5 |
2.61 ± 0.6 |
<0.001 |
| NLR |
2.40 ± 0.9 |
1.67 ± 0.5 |
<0.001 |
| TIMI frame count (frame/s) |
| Left anterior descending artery |
48.4 ± 12 |
32.7 ± 2 |
<0.001 |
| Left circumflex artery |
31 ± 9 |
21.4 ± 2 |
<0.001 |
| Right coronary artery |
31.5 ± 7 |
20.3 ± 1 |
<0.001 |
| Mean TIMI frame count(frame/s) |
37 ± 7 |
24.8 ± 1 |
<0.001 |
BMI: Body Mass Index, BP: Blood Pressure, EF: Ejection Fraction, LVEDD: Left Ventricular End-Diastolic Dimension, LVESD: Left Ventricular End-Systolic Dimension, NLR: Neutrophil To Lymphocyte Ratio, NS: Not Significant, WBC:White Blood Cell Count.
Table 1: Clinical characteristics, echocardiographic, angiographic and laboratory findings of groups.
The electrocardiographic parameters of the groups are shown in Table 2. QTd and corrected QTd were significantly increased in SCF patients compared to the controls (p=0.003, p=0.013, respectively). Tp-e interval, corrected Tp-e interval (cTp-e), and Tp-e/QT ratio were also significantly higher in SCF patients compared to the control group (p<0.001, p=0.009, p=0.002, respectively).
| |
Patients with SCF (n=46) |
Control group (n=45) |
P value |
| QTmin (ms) |
381.1 ± 28.5 |
372.8 ± 21 |
0.122 |
| cQTmin (ms) |
407.7 ± 30.5 |
416.1 ± 30.6 |
0.197 |
| QTmax (ms) |
409.2 ± 27.7 |
395.9 ± 21.3 |
0.013 |
| cQTmax (ms) |
446.3 ± 37.7 |
427.7 ± 25.1 |
0.008 |
| QTd (ms) |
28 ± 8.7 |
23 ± 6.7 |
0.003 |
| cQTd (ms) |
30.2 ± 10.4 |
25.5 ± 6.8 |
0.013 |
| Tp-e (ms) |
88.5 ± 14.1 |
79 ± 5 |
<0.001 |
| cTp-e (ms) |
94.5 ± 14.9 |
88.1 ± 6.3 |
0.009 |
| Tp-e/QT |
0.23 ± 0.03 |
0.21 ± 0.02 |
0.002 |
cQTd: Corrected QT Dispersion, cQTmax: Corrected QT Maximum, cQTmin: Corrected QT Minimum, cTp-e: Corrected Transmural Dispersion of Repolarization, QTd: QT Dispersion, QTmax: QT Maximum, QTmin: QT Minimum, Tp-e: Transmural Dispersion of Repolarization.
Table 2: Electrocardiographic findings of the groups.
In correlation analysis, cTp-e was significantly correlated with mean TFC (Figure 1) and NLR (r=0.50, p<0.001, r=0.37, p<0.001 respectively). The Tp-e/QT ratio was significantly correlated with mean TFC (Figure 2) and NLR (r=0.48, p<0.001 and r=0.28, p=0.006, respectively). Mean TFC was significantly correlated with NLR (r=0.47, P<0.001, Figure 3).
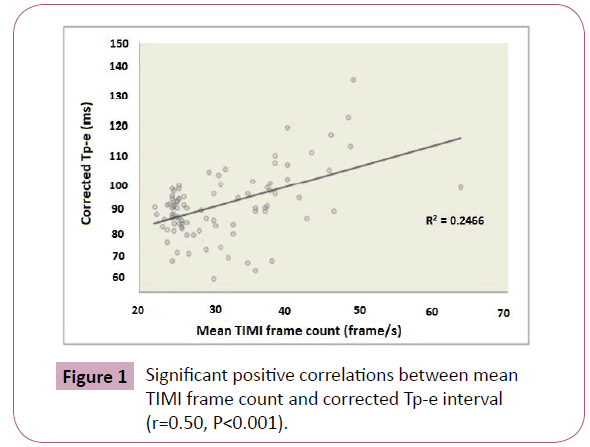
Figure 1: Significant positive correlations between mean TIMI frame count and corrected Tp-e interval (r=0.50, P<0.001).
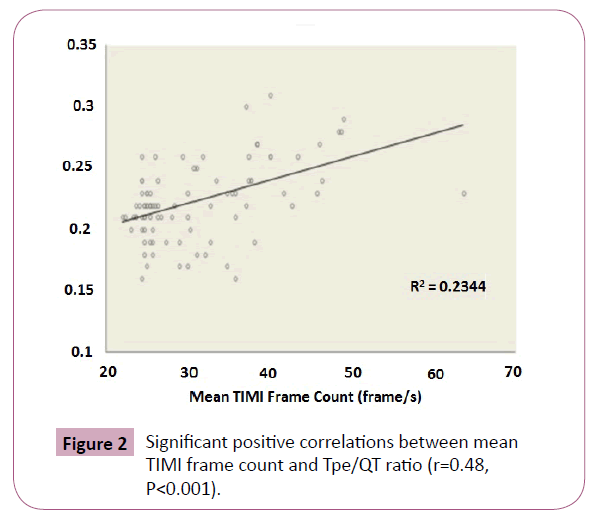
Figure 2: Significant positive correlations between mean TIMI frame count and Tpe/QT ratio (r=0.48, P<0.001).
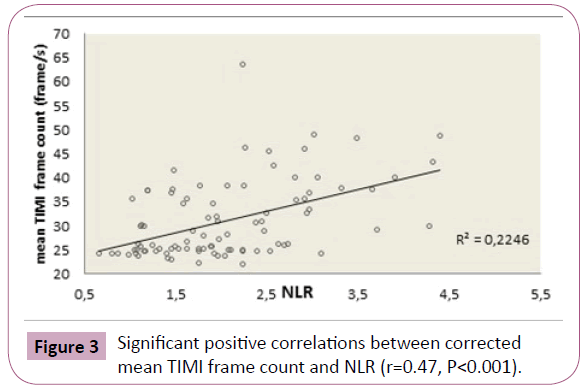
Figure 3: Significant positive correlations between corrected mean TIMI frame count and NLR (r=0.47, P<0.001).
Discussion
We showed that the Tp-e interval and Tp-e/QT ratio were prolonged and NLR increased in patients with SCF compared to controls. Moreover, existence and degree of inflammation was corraleted with incidance of cardiac arrhythmia.
Proper control of coronary blood flow is important for the maintenance of cardiac pump function, cardiac output, and arterial pressure [21]. Cardiac functions are negatively affected in SCF patients with reports of chest pain [1], evidence of subclinical atherosclerosis [2], left ventricular diastolic function abnormalities [7], conduction disturbances [9], increased frequency of ventricular arrhythmia (10), and cardiac autonomic dysfunction [11]. In addition, increased cardiovascular morbidity and mortality have been demonstrated in patients with SCF when compared to the controls [11,22].
During the pathogenesis of cardiac disease and arrhythmia, there is an increase in inflammatory activity [23-25] and in SCF patients inflammatory activity is further increased [6,26]. In our study, the inflammation level was evaluated by NLR and our results correlated with previous studies demonstrating that inflammation levels were higher in SCF patients compared to controls.
There are several studies describing the contribution of neurohormonal functions to increased ventricular arrhythmias in SCF. In one of these studies, epinephrine and norepinephrine levels were higher in SCF patients compared to controls [27]. It has been shown that the QT interval lengthened and QTd increased after sympathetic system activity or catecholamine discharge [28]. The Tp-e interval and Tp-e/QT ratio have been used as indices of ventricular repolarization to predict ventricular arrhythmias and sudden cardiac death [13-17]. Several investigators have studied repolarization patterns in patients with SCF and have shown that QTd, Tp-e interval and Tp-e/QT ratio were increased compared to controls [11,29]. In these studies, QTd, Tp-e interval and Tp-e/QT ratio were used to assess the homogeneity of cardiac repolarization, however no information about the relationship with inflammation was shown. Another study reported that the Tp-e interval and Tp-e/QT ratio were increased in rheumatic patients, and that these ventricular repolarization indexes were correlated with inflammation [30]. In our study, we found that the cTp-e interval and Tp-e/QT ratio and NLR were significantly correlated with mean TFC and indicative of the severity of SCF. In endomyocardial biopsy and histopathologic studies of SCF patients, patchy fibrosis in intramyocardial arterioles and fibrin deposits at myocardial interstitium were observed, which was thought to be a result of long-lasting chronic inflammation [31]. As a result, the involvement of myocardial tissue may cause the development of heterogeneity in repolarization, which may also contribute to the development of ventricular arrhythmias in patients with SCF.
Our results may contribute to pathophysiological mechanisms of increased prevalence of ventricular arrhythmias and cardiovascular mortality risk by indicating increased ventricular repolarization heterogeneity and increased inflammatory activity in these patients. Increased frequency of ventricular arrhythmia might be explained by prolonged transmural dispersion and increased chronic inflammatory activity in SCF patients. To the best of our knowledge, the relationship of new inflammatory marker and new ventricular repolarization indexes have not previously been assessed in patients with SCF.
Study Limitations
The major limitations of our study are its cross-sectional design and lack of patient follow-up. In addition, our study population size was relatively small and we could not assess the study group with 24-hours rhythm holter ECG. Therefore, it was not possible to assess the relationship between the Tp-e interval and Tp-e/QT ratio with ventricular arrhythmias, with future undesired events. We need larger studies to define the detailed role of these indexes in SCF patients. Other limitations included the use of NLR as the only marker of inflammation, and manual measurements of these intervals, given that digital measurements may be more reliable.
Conclusion
Our results also indicated that these electrocardiographic indexes for ventricular repolarization were significantly correlated with the NLR. Finally, the NLR, Tp-e interval and Tp-e/QT ratio might be useful markers of cardiovascular morbidity and mortality due to complex ventricular arrhythmias in patients with SCF.
8299
References
- Tambe AA, Demany MA, Zimmerman HA, Mascarenhas E (1972) Angina pectoris and slow flow velocity of dye in coronary arteries--a new angiographic finding. Am Heart J 84:66-71.
- Simsek H, Sahin M, Gunes Y, Akdag S, Akil MA, et al. (2013) A novel echocardiographic method as an indicator of endothelial dysfunction in patients with coronary slow flow. Eur Rev Med PharmacolSci 17:689-693.
- Mangieri E, Macchiarelli G, Ciavolella M, Barillà F, Avella A, et al. (1996) Slow coronary flow: clinical and histopathological features in patients with otherwise normal epicardialcoronaryarteries. CathetCardiovascDiagn 37:375-381.
- Pekdemir H, Cin VG, Cicek D (2004) Slow coronary flow may be a sign of diffuse atherosclerosis. Contribution of FFR and IVUS. Acta Cardiol 59:127-133.
- Beltrame JF, Limaye SB, Wuttke RD, Horowitz JD (2003) Coronary hemodynamic and metabolic studies of the coronary slow flow phenomenon. Am Heart J 146:84-90.
- Madak N, Nazl? Y, Mergen H, Aysel S, Kandaz M, et al. (2010) Acute phase reactants in patients with coronary slow flow phenomenon. AnadoluKardiyolDerg 10:416-420.
- Van Lierde J, Vrolix M, Sionis D, De Geest H, Piessens J (1991) Lack of evidence for small vessel disease ?n a pat?ent. w?th slow dye progress?on ?n the coronary arter?es. CathetCardiovascDiagn 23: 117-20.
- Elsherbiny IA (2012) Left ventricular function and exercise capacity in patients with slow coronary flow. Echocardiography 29:158-64.
- Wozakowska-Kap?on B, Niedziela J, Krzyzak P, Stec S (2009) Clinical manifestations of slow coronary flow from acute coronary syndrome to serious arrhythmias. Cardiol J 16:462-468.
- Saya S, Hennebry TA, Lozano P, Lazzara R, Schechter E (2008) Coronary slow flow phenomenon and risk for sudden cardiac death due to ventricular arrhythmias: a case report and review of literature. Clin Cardiol 31:352-355.
- Kosus A, Sagkan O, Dursun I (2004) "Heart rate variability and QT dispersion in patients with slow coronary flow". Turk KardiyolDernArs 32: 10.
- Antzelevitch C, Shimizu W, Yan GX, Sicouri S (1998) Cellular basis for QT dispersion. J Electrocardiol 30:168-175.
- Kors JA, Ritsema van Eck HJ, van Herpen G (2008)The meaning of the Tp-Te interval and its diagnostic value. J Electrocardiol 41:575-580.
- Smetana P, Schmidt A, Zabel M (2011) Assessment of repolarization heterogeneity for prediction of mortality in cardiovascular disease: peak to the end of the T wave interval and nondipolar repolarization components. J Electrocardiol 44:301-308.
- Watanabe N, Kobayashi Y, Tanno K (2004) Transmural dispersion of repolarization and ventricular tachyarrhythmias. J Electrocardiol 37:191-200.
- Gupta P, Patel C, Patel H (2008) T(p-e)/QT ratio as an index of arrhythmogenesis. J Electrocardiol 41:567-574.
- Zhao X, Xie Z, Chu Y (2012) Association between Tp-e/QT ratio and prognosis in patients undergoing primary percutaneous coronary intervention for ST-segment elevation myocardial infarction. Clin Cardiol 35:559-564.
- Gibson PH, Cuthbertson BH, Croal BL, Rae D, El-Shafei H, et al. (2010) Usefulness of neutrophil/lymphocyte ratio as predictor of new-onset atrial fibrillation after coronary artery bypass grafting. Am J Cardiol 105:186-191.
- Lang RM, Bierig M, Devereux RB, Flachskampf FA, Foster E (2005) Recommendations for chamber quantification: a report from the American Society of Echocardiography's Guidelines and Standards Committee and the Chamber Quantification Writing Group, developed in conjunction with the European Association of Echocardiography, a branch of the European Society of Cardiology.J Am SocEchocardiogr18:1440-1463.
- Gibson CM, Cannon CP, Daley WL, Dodge JT, Alexander B, et al. (1996) TIMI frame count: a quantitative method of assessing coronary artery flow. Circulation 93: 879-88.
- Duncker DJ, Bache RJ (2008) Regulation of coronary blood flow during exercise. Physiol Rev 88:1009-1086.
- Atak R, Turhan H, Sezgin AT (2003) Effects of slow coronary artery flow on QT interval duration and dispersion. Ann Noninvasive Electrocardiol 8:107-111.
- AgrandWK, IsserCA, Ermens WT, Iessen HW, Erheugt FW, et al. (1999) C-reactive protein as a cardiovascular risk factor: more than an epiphenomenon? Circulation 100: 96-102.
- Mountantonakis S, Deo R (2012) Biomarkers in atrial fibrillation, ventricular arrhythmias, and sudden cardiac death. CardiovascTher 30:74-80.
- Sönmez O, Erta? G, Bacaks?z A, Tasal A, Erdo?an E, et al. (2013) Relation of neutrophil -to- lymphocyte ratio with the presence and complexity of coronary artery disease: an observational study. AnadoluKardiyolDerg 13:662-667.
- Cetin M, Zencir C, Tasolar H, Baysal E, Balli M, et al. (2014) The association of serum albumin with coronary slow flow. Wien KlinWochenschr126:468-473.
- Yaz?c? M, Demircan S, Durna K, ?ahin M (2007) The role of adrenergic activity in slow flow coronary flow and its relationship to TIMI frame count. Angiology 58: 393-400.
- Abildskow JA (1976) Adrenergic effects of the QT interval on the electrocardiogram. Am Heart J 92:210-216.
- Karaman K, Altunka? F, Çetin M, Karayakali M, Ar?soy A, et al. (2015) New markers for ventricular repolarization in coronary slow flow: Tp-e interval, Tp-e/QT ratio, and Tp-e/QTc ratio. Ann Noninvasive Electrocardiol20:338-344.
- Acar G, Yorgun H, Inci MF, Akkoyun M, Bakan B, et al. (2014) Evaluation of Tp-e interval and Tp-e/QT ratio in patients with ankylosing spondylitis. Mod Rheumatol 24:327-330.
- Peng SK, French WJ (1986) Morphological changes in small vessels on endomyocardial biopsy. Ann Clin Lab Sci 16: 180-8.