Keywords
Neural stem/progenitor cells (NSPCs); Differentiation; Cell electrophoresis; Surface potential; Activation energy
Introduction
Recently, stem cells have been extensively found in different tissues and organs [1-3]. Stem cells are regarded as very stable in tissues and organs because they can remain quiescent and undifferentiated for long periods of time. On the other hand, stem cells are highly variable to differentiate into different cell types after they receive specific signals. Obviously, there is a complex interplay between stem cells and their environment to control the initiation of the differentiation process [4]. Therefore, it is interesting to investigate how stem cells remain in an undifferentiated state when they are surrounded by various differentiated cells. Understanding the characteristics of stem cells to maintain their stability may lead to find new ways to control stem cell differentiation.
Stem cells usually go through several stages to complete the overall differentiation process, becoming more specialized at each step. The whole differentiation process often takes several days or weeks, which can be measured by changes in protein expression and cell function. However, stem cell differentiation markers are hardly to be detected during the early stage of differentiation. Once the processes or specific cell markers can be observed, the fate of the stem cells has been determined and the differentiation process is at the late stage. For example, nestin, microtubule associated protein 2 (MAP-2), and glial fibrillary acidic protein (GFAP) have been routinely used in identification of differentiation of neural stem/progenitor cells (NSPCs), neurons, and glia cells, respectively, but no appropriate method could be used to analyze the early differentiation of NSPCs.
The purpose of this study was to analyze whether significant changes would occur in stem cells at the early stage of differentiation process. NSPCs were used as the model cells. Since stem cell receive specific signals for inducing differentiation through cell membrane, we proposed that cell surface variation might be used to monitor stem cell differentiation at the very early stage. One of important parameters reflecting the state of cell surface is surface charge. In addition, previous investigators proposed that the variation of cell surface charge properties has been reported to occur earlier than the intracellular metabolism after cells contacting environment stimulation [5,6]. Cell electrophoresis is a technique which used to study the surface properties of cells and separate uniform cell subpopulations from cell mixtures [7]. The electrophoresis of single cells is measured under a microscope. Cell surface electric charges and electrophoretic mobility between various cell types, including cells of the immune system [8], pathological cells [9,10], and cell differentiation [11-13]. Cell surface properties can be analyzed by measurable changes in the electrokinetic potential, and changes in their electrophoretic mobilities . We analyzed the relationship between differentiation and surface potential variation of NSPCs by cell electrophoresis. Cell electrophoresis of cells may differ in cell cycle [14], and hence in cell activities, surface properties, apoptosis, enzyme activity, and gene expression. We proposed that cell electrophoresis of stem cells might be difference in differentiation phases.
In this study, we successfully demonstrated the variation of surface charge property of NSPCs played an important role during the early stage of differentiation process. Furthermore, we could trigger or inhibit the NSPC differentiation by modulating their surface charge, which provided an alternative to control stem cell behaviors.
Materials and Methods
Materials
Polyvinylidene fluoride (PVDF) was obtained from Elf AtoChem (Kynar 740 type). Dulbecco’s Modified Eagles’ Medium, Nutrient Mixture F-12 (DMEM-F12), N-2 supplement and fetal bovine serum (FBS) were obtained from Gibco (USA). Basic fibroblast growth factor (bFGF) was from Invitrogen (USA). Monoclonal antibodies to glial fibrillary acidic protein (GFAP), microtubule associated protein 2 (MAP-2), nestin, FITC-conjugated goat antimouse IgG and rhodamine conjugated goat anti-mouse rabbit IgG were obtained from Chemicon (USA). Neuraminidase was obtained from Serva (Germany), and other general laboratory chemicals were obtained from Sigma (USA).
Preparation of polymer substrates
In this study, PVDF membrane, prepared by the dry process of the phase inversion method [15], was used to culture NSPCs. Briefly, 20 wt% PVDF solution was spread on a glass plate in the thickness of 0.5 mm, evaporated in at 60°C overnight, and removed by a series of washing steps to form a membrane. Circular samples (1.5 cm in diameter) were placed in 24-well tissue culture polystyrene plates (TCPS) (Corning, NY, USA), sterilized with 70% alcohol under ultraviolet light overnight and then rinsed extensively with phosphate-buffer saline (PBS). In addition, 24-well tissue culture polystyrene plates were covered with 1ml of Poly-D-lysine (PDL, 50 ng/mL) for 12 hours. Excess solution was removed by suction, dried for another hour, and then sterilized for NSPC culture [16].
NSPC culture
NSPCs were prepared from pregnant Wistar rat embryos on day 14-15 according to a protocol detailed previously [17]. Briefly, NSPCs were collected from rat embryonic cerebral cortices by dissection, trituration and centrifugation. The collected NSPCs were resuspended in serum-free medium containing DMEM-F12, and N2 supplement in T25 culture flasks [18]. After 2-3 days of incubation, NSPCs proliferated to form the so-called neurospheres. These neurospheres were directly seeded on substrates or dissociated for subsequent culture in the absence or presence of serum or neuraminidase. The dynamic NSPC culture process was observed by a time-lapse microscopic system (Leica DMI600, Germany) equipped with a CO2 incubator unit.
Immunocytochemistry
For immunocytochemical characterization, adhered NSPCs on 24- well were fixed and incubated with primary antibodies diluted in PBS containing 0.3% Triton X-100. Non-adhered NSPCs were collected, redistribute to another 24-well, and then medium was removed carefully. The residual cells on TCPS were also fixed and incubated with primary antibodies diluted in PBS containing 0.3% Triton X-100. The primary antibodies used in this study were mouse anti-nestin (1:1000), rabbit anti-MAP-2 (1:500), mouse anti-GFAP (1:500) [19-22]. The secondary antibodies used to visualize the primary antibody signal were FITC-conjugated goat anti-mouse IgG (1:100), and rhodamine conjugated goat anti-rabbit IgG (1:100). Cells were visualized under a inverted microscope (Leica DMI6000, Germany).
NSPC electrophoretic mobility
Electrophoresis was used to investigate the surface potential variation of NSPCs during differentiation process by measuring the NSPC electrophoretic mobility, and the detail protocols were demonstrated in the previous studies. [5,6,23]. Briefly, the suspended cells were directly collected from culture medium and the attached cells were mechanically detached and collected from substrates. All collected cells were redistributed in the electrophoretic buffer solution containing 10mM Tris-HCl and 291mM glucose, and were introduced into a rectangular glass electrophoresis chamber. The 200V DC was applied across the electrophoresis chamber. The electrophoretic velocity of NSPCs, u, was measured by recording the time needed for cells passing a fixed length with 3 mA under a microscope with a CCD camera. The electrophoretic mobility, μ, was calculated by μ=ugS/I, where g is the conductivity of medium, S is the cross-sectional area of the electrophoresis chamber, and I is the current. For each condition at least 9 readings were performed to calculate NSPC electrophoretic mobility.
Statistical analysis
Results were presented as the mean ± standard deviation (SD) of three independent cultures. P value of <0.01 was considered significant as determined by Student’s t-test.
Results
Differentiation of NSPCs
When NSPCs were cultured on PVDF in the presence of 10% FBS, almost Figure1(a) shows some neurospheres attached onto PVDF in the presence of 10% FBS after been seeded for 1 hour. No obvious cell migration and process growth from neurospheres was observed at so short culture period. After extending culture periods to 7 days, forming-neurosphere cells with short processes migrated out from their original aggregates (Figure 1(b)). Furthermore, both GFAP and MAP-2 immunoactive cells were observed (Figure 1(c) and (d)). These results confirm previous studies that the differentiated NSPCs must adhere on the substrate and then differentiate into neurons and astrocytes under appropriate conditions [24].
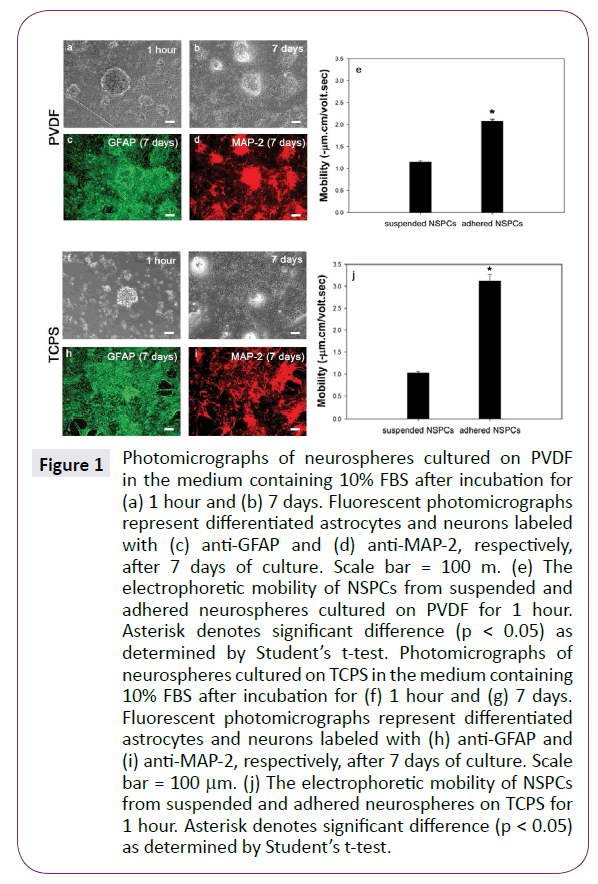
Figure 1: Photomicrographs of neurospheres cultured on PVDF in the medium containing 10% FBS after incubation for (a) 1 hour and (b) 7 days. Fluorescent photomicrographs represent differentiated astrocytes and neurons labeled with (c) anti-GFAP and (d) anti-MAP-2, respectively, after 7 days of culture. Scale bar = 100 m. (e) The electrophoretic mobility of NSPCs from suspended and adhered neurospheres cultured on PVDF for 1 hour. Asterisk denotes significant difference (p < 0.05) as determined by Studentâ€Âââ€Å¾Â¢s t-test. Photomicrographs of neurospheres cultured on TCPS in the medium containing 10% FBS after incubation for (f) 1 hour and (g) 7 days. Fluorescent photomicrographs represent differentiated astrocytes and neurons labeled with (h) anti-GFAP and (i) anti-MAP-2, respectively, after 7 days of culture. Scale bar = 100 µm. (j) The electrophoretic mobility of NSPCs from suspended and adhered neurospheres on TCPS for 1 hour. Asterisk denotes significant difference (p < 0.05) as determined by Studentâ€Âââ€Å¾Â¢s t-test.
Electrophoretic mobility of NSPCs on PVDF and serum-present TCPS
For measuring the electrophoretic mobility, single NSPCs were collected from both attached and suspended neurospheres on PVDF after been seeded for 1 hour and then be dispersed mechanically. Figure 1(e) shows that both adhered and suspended NSPCs exhibited negative mobility values, implying that these cells had negative charged surface. Importantly, the mobility of adhered cells was extremely more negative than that of non-adhered cells, indicating that the cell surface property has been greatly altered after attaching onto PVDF for 1 hour. Since suspended neurosphere must attach onto the appropriate substrate for undergoing differentiation, only adhered NSPCs could exhibit the differentiated phenotypes after 7 days of incubation. Thus, it is reasonable to assume that differentiationrelated signals may reflect on the membrane surface at the very early stage of differentiation process. To test this hypothesis, neurospheres were cultured on another substrate, TCPS in the presence of 10% serum for 1 hour. Figure 1(j) also shows that the adhered NSPCs were significantly more negative than nonadhered ones (p<0.05). Thus, it was confirmed that the cell surface charge would become more negative rapidly when neurospheres attached onto the substrates, regardless of PVDF or serumpresent TCPS. Figure 1(f-i) shows morphologies and differentiated cellular phenotypes of neurospheres cultured on serum-present TCPS for 1 hour and 7 days. Similar to neurospheres cultured on PVDF, many GFAP-positive and MAP-2-postive cells migrated out from neurospheres after 7 days of incubation.
The effect of serum on electrophoretic mobility of NSPCs
For the next experiment, we investigated whether NSPCs also possessed more negative charges on their surface to develop a higher mobility after they attached onto PVDF and TCPS in the absence of serum. Figure 2(a) shows the electrophoretic mobility of adhered NSPCs in the serum-free medium after 1 hour of incubation was significantly lower than those in the serumcontaining medium, regardless of PVDF and TCPS (p<0.05). Therefore, serum in the medium would increase the adhered NSPC negative mobility during early culture period and cellular attachment per se is not a determinant factor to increase NSPC negative surface charges to develop a higher mobility. After 7 days of incubation, nestin-positive precursor cells without obvious process development were the main cell types in these adhered cells (Figure 2(b)), indicating adhered NSPCs did not possess the differentiation ability in the serum-free medium. This is consistent with the previous results reported by Hung et al. that serum in the culturing environment played an important role in the NSPC differentiation [25,26].
To confirm whether serum had a direct influence on electrophoretic mobility of NSPCs or an accompanying role in the process of the variation of cell surface charge, the effect of serum on the electrophoretic mobility of suspended NSPCs was assayed. NSPCs were collected from suspended neurospheres on PVDF and TCPS after been seeded for 1 hour in the serumfree or serum-containing medium for measuring electrophoretic mobility. Figure 2(c) shows that the presence of serum would not significantly exhibit more negative mobility values no matter when neurospheres cultured on PVDF or TCPS, which was contrary to attached NSPCs cultured in the serum-containing medium. This result suggests that, in the presence of serum, NSPCs would not increase their electrophoretic mobility by the absorption of higher amount of negatively-charged serum proteins on the cell membrane surface. Because the upregulation of negative electrophoretic mobility occurred only when neurospheres attached onto the substrates and these neurospheres would undergo differentiation in the subsequent culture, this makes it possible the surface charge of NSPCs may reflect the intracellular metabolism and can be used to predict NSPC differentiation.
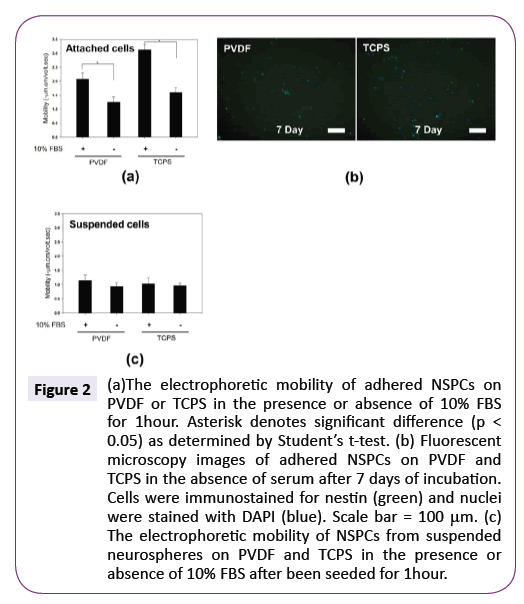
Figure 2: (a)The electrophoretic mobility of adhered NSPCs on PVDF or TCPS in the presence or absence of 10% FBS for 1hour. Asterisk denotes significant difference (p < 0.05) as determined by Students t-test. (b) Fluorescent microscopy images of adhered NSPCs on PVDF and TCPS in the absence of serum after 7 days of incubation. Cells were immunostained for nestin (green) and nuclei were stained with DAPI (blue). Scale bar = 100µm. (c) The electrophoretic mobility of NSPCs from suspended neurospheres on PVDF and TCPS in the presence or absence of 10% FBS after been seeded for 1hour.
The effect of PDL on electrophoretic mobility of NSPCs
Subsequently, neurospheres were cultured on PDL in the serumfree medium. PDL is the most common polymer substrates used for culture of neuro-related cells [16,27,28]. Figure 3 shows the electrophoretic mobility of NSPCs after culturing on TCPS and PDL in the absence of serum for 1 hour. Clearly, the mobility of NSPCs cultured on PDL was extremely more negative than that on TCPS. This further confirms that the electrophoretic mobility of NSPCs could be rapidly changed when neurospheres attached onto the culturing substrates for undergoing differentiation.
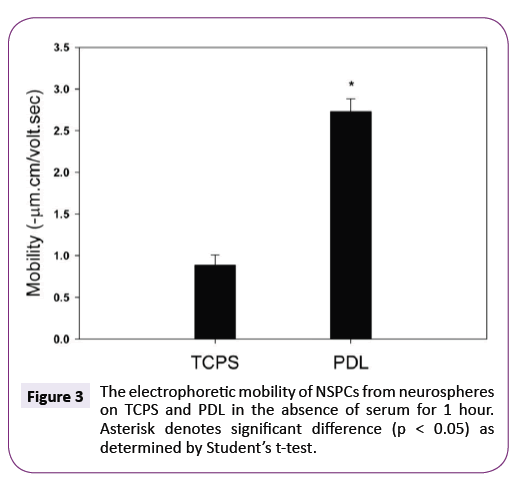
Figure 3: The electrophoretic mobility of NSPCs from neurospheres on TCPS and PDL in the absence of serum for 1 hour. Asterisk denotes significant difference (p < 0.05) as determined by Students t-test.
Variation of NSPC electrophoretic mobility during the differentiation process
At present, it is unknown whether NSPCs could continuously maintain such more negatively charged surface during the differentiation process. Figure 4 shows the electrophoretic mobility of NSPCs cultured on TCPS in the presence of 10% FBS was dependent on the incubation time. At 1 hour, NSPCs exhibited the highest mobility within the whole period of incubation. Although the mobility of cells was gradually decreased from 1 hour to 6 days, no charge reversal was observed and the mobility value is always higher than the original one.
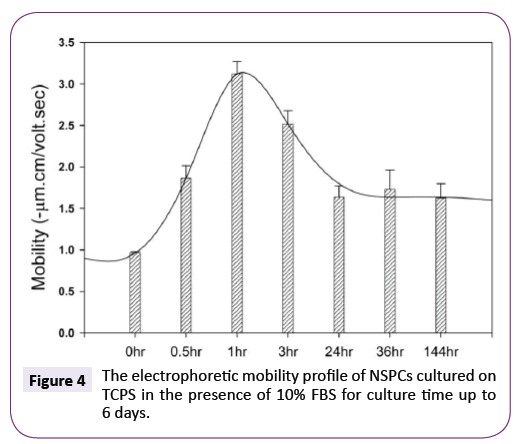
Figure 4: The electrophoretic mobility profile of NSPCs cultured on TCPS in the presence of 10% FBS for culture time up to 6 days.
Parallel to electrophoretic mobility observation, we monitored morphological transformation of neurospheres on TPCS in the presence of 10% FBS by time-lapse video microscopy. Figure 10 shows NSPCs began to differentiate the first process at the 14th hour and the first cell migrated out from the original aggregates at the 21st hour. Overall, time-lapse photos showed neurospheres still maintained their initial shape with the original boundary over 23 hours. Compared to Figure 5, the electrophoretic mobility of NSPCs had decreased from the highest value to the steady status, indicating the effect of the environment on the upregulation of electrophoretic mobility was an early step than on the differentiation process.
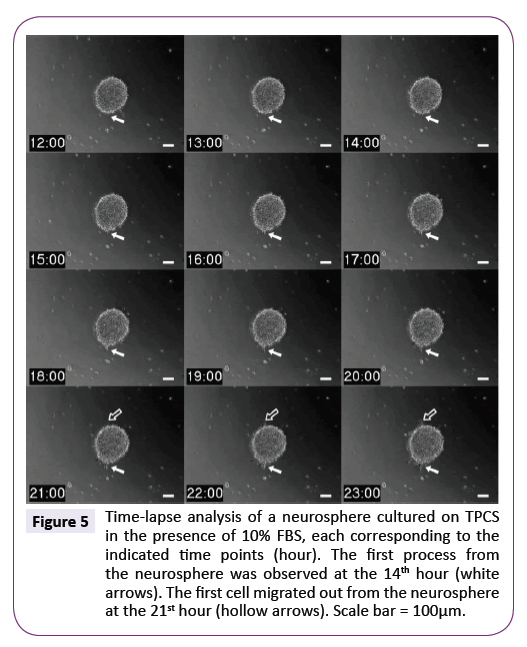
Figure 5: Time-lapse analysis of a neurosphere cultured on TPCS in the presence of 10% FBS, each corresponding to the indicated time points (hour). The first process from the neurosphere was observed at the 14th hour (white arrows). The first cell migrated out from the neurosphere at the 21st hour (hollow arrows). Scale bar = 100µm.
Furthermore, the effect of serum concentration, ranging from 1 to 10%, on electrophoretic mobility and differentiation of NSPCs was compared. Figure 6(a) shows serum was able to enhance the elctrophoretic mobility of adhered NSPCs on TCPS after been seeded for 1 hour. When medium supplemented with more than 4% FBS, the electrophoretic mobility of NSPCs obviously increased. Similarly, when medium contained more than 4% FBS, differentiated NSPCs with obvious process migrated out of neurospheres after 7 days of incubation (Figure 6(b)). Therefore, the variation in electrophoretic mobility of NSPCs after being seeded for 1 hour appeared to correlate with the differentiation of NSPCs after 7 days of incubation.
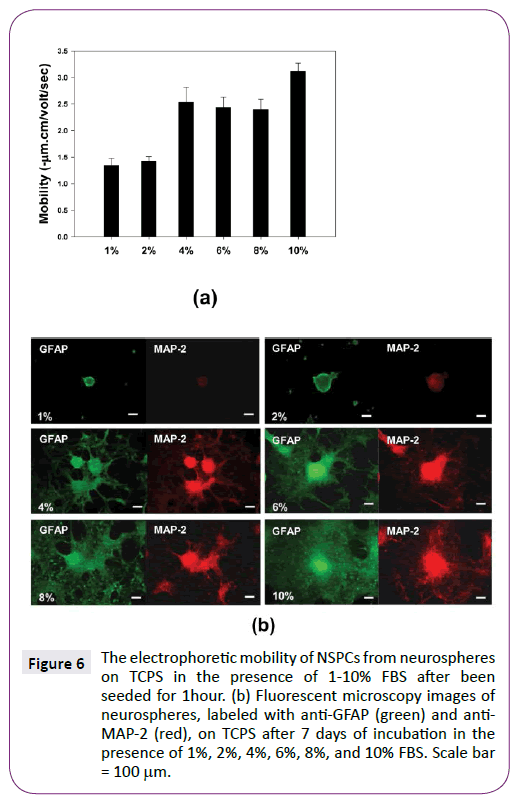
Figure 6: The electrophoretic mobility of NSPCs from neurospheres on TCPS in the presence of 1-10% FBS after been seeded for 1hour. (b) Fluorescent microscopy images of neurospheres, labeled with anti-GFAP (green) and anti- MAP-2 (red), on TCPS after 7 days of incubation in the presence of 1%, 2%, 4%, 6%, 8%, and 10% FBS. Scale bar = 100µm.
The regulation of NSPC differentiation by controlling cell electrophoretic mobility
Finally, we tried to control NSPC differentiation by regulating cell electrophoretic mobility. We assumed the rise of the medium pH can increase the cell surface charge density by enhancing the dissociation of the acidic functional groups on cell surface. Indeed, when neurospheres with 2% FBS were exposed to the alkaline environment (pH=8) for 1 hour, they exhibited significantly higher electrophoretic mobility than neurospheres with 2% FBS at pH 7.4 (p<0.05) (Figure 7). Interestingly, no obvious NSPC differentiation was replaced by obvious morphological changes at alkaline environment with 2% FBS for 7 days. These results suggest that medium pH is able to induce NSPC differentiation at low serum concentration by increasing cell electrophoretic mobility.
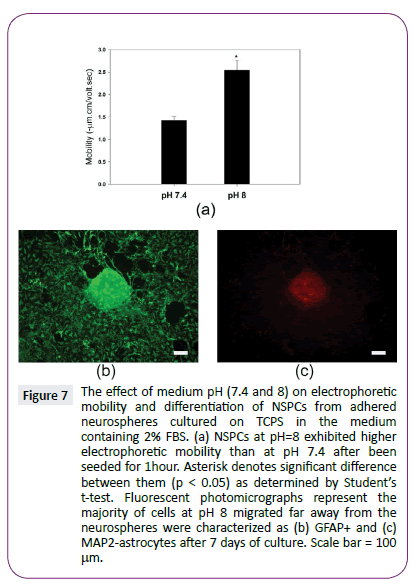
Figure 7: The effect of medium pH (7.4 and 8) on electrophoretic mobility and differentiation of NSPCs from adhered neurospheres cultured on TCPS in the medium containing 2% FBS. (a) NSPCs at pH=8 exhibited higher electrophoretic mobility than at pH 7.4 after been seeded for 1hour. Asterisk denotes significant difference between them (p < 0.05) as determined by Students t-test. Fluorescent photomicrographs represent the majority of cells at pH 8 migrated far away from the neurospheres were characterized as (b) GFAP+ and (c) MAP2-astrocytes after 7 days of culture. Scale bar = 100 µm.
In contrast to the effect of alkaline medium, neuraminidase is able to cleave sialic acid residues on the cell surface to decrease the charge density. Figure 8 shows neuraminidase could inhibit the upregulation of NSPC electrophoretic mobility in the presence of 10% FBS. Compared to without neuraminidase, the electrophoretic mobility was decreased from -2.5±0.1 to -1.0 ± 0.1 μm·cm/volt·sec, similar to the value of NSPCs in the absence of serum. Interestingly, the effect of serum on inducing NSPC differentiation disappeared in the neuraminidase-treated NSPCs. Neurospheres still displayed a well-defined spherical shape and only very few and short processes extended out from neurospheres. Therefore, the treatment of neuraminidase could inhibit the NSPC development at high serum concentration by decreasing cell electrophoretic mobility.
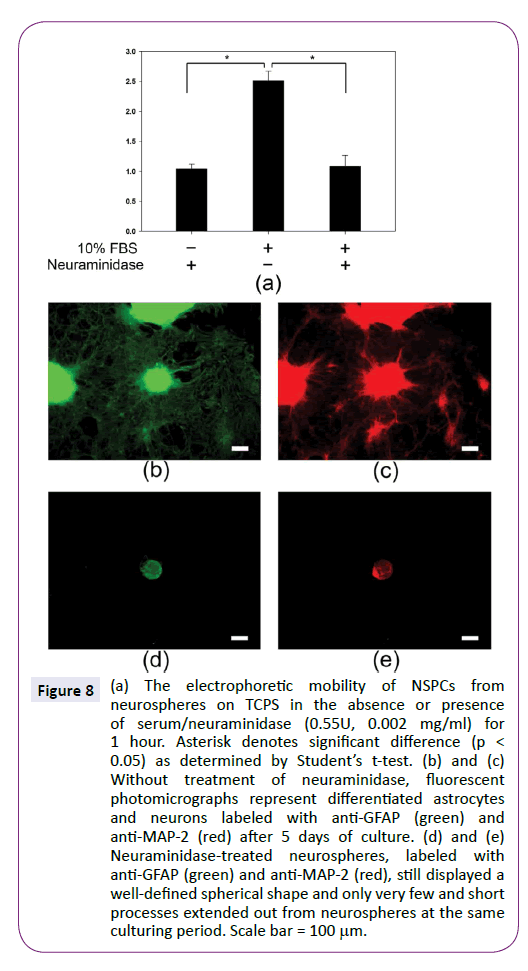
Figure 8: (a) The electrophoretic mobility of NSPCs from neurospheres on TCPS in the absence or presence of serum/neuraminidase (0.55U, 0.002 mg/ml) for 1 hour. Asterisk denotes significant difference (p < 0.05) as determined by Students t-test. (b) and (c) Without treatment of neuraminidase, fluorescent photomicrographs represent differentiated astrocytes and neurons labeled with anti-GFAP (green) and anti-MAP-2 (red) after 5 days of culture. (d) and (e) Neuraminidase-treated neurospheres, labeled with anti-GFAP (green) and anti-MAP-2 (red), still displayed a well-defined spherical shape and only very few and short processes extended out from neurospheres at the same culturing period. Scale bar = 100µm.
Discussion
It is known stem cells have the capacity for differentiation into different cell lineages. In general, it takes several days or weeks for the complete differentiation process. The goal of this work is to investigate the surface potential variation of NSPCs during differentiation process. Cell surface potential is one of the parameters reflecting the state of cell membrane, which depends on the extracellular environments and the intracellular metabolism [23]. In this study, cell electrophoresis was used to investigate the surface charge properties of NSPCs by measuring the change in electrophoretic mobility. Compared to phenotype change during NSPC differentiation, the change of cell surface potential of NSPCs was relatively fast (Figure 1). In general, no appropriate markers can be used to detect NSPC differentiation during the early stage of differentiation. Once specific markers can be observed, the fate of the NSPCs has been determined and the differentiation process is at the end stage. Therefore, we tried to analyze the relationship between surface potential level and differentiation of NSPCs. To our knowledge, this is the first report to show that NSPCs exhibit a rapid variation in the surface charge property during the very early stage of differentiation process.
Two methods were used to induce NSPC attachment and following differentiation. Regardless of using serum (Figure 2) or PDL (Figure 3), the electrophoretic mobility of NSPCs could rapidly increase after a very short-term culture period. Although these NSPCs differentiated into neurons or glial cells after 7 days of incubation, they still maintained rounded shape without growing processes during the early culture period. Therefore, when NSPCs just start to undergo differentiation process, obvious change has occurred in their membrane surface. It is reasonable to assume that the rapidly increased negative surface charge of NSPCs is beneficial for cells migrating out of neurospheres to undergo differentiation due to the enhanced repulsive force between cells.
Previous investigators have derived the relationship between the electrophoretic velocity and the surface potential of an entity [29], suggesting the electrophoretic mobility is a specific form of the energy expressed by cells. Therefore, we proposed the variation of electrophoretic mobility of NSPCs exhibited the change of the potential energy of NSPCs during the differentiation process (Figure 4). From the viewpoint of chemical reaction, the potential energy curve with the maximum height is similar to an activation energy form, which implies NSPCs need to possess higher electrophoretic mobility to overcome the energy barrier for undergoing differentiation. In contrast, if the electrophoretic mobility of NSPCs is not high enough, its potential energy is not sufficient to undergo differentiation process. As shown in Figure 6, when the serum concentration in the medium was decreased, the electrophoretic mobility of NSPCs was decreased and cells exhibited immature differentiated morphology, indicating serum is an energy source for NSPC differentiation.
However, it is incomplete to describe NSPC differentiation based on first-order reaction kinetics with an energy barrier because the overall differentiation process is rather complex. We proposed the increase of the electrophoretic mobility of NSPCs is the rate-determining step of the overall differentiation processes. Once NSPCs were exposed to serum, growth factors or specific substrates, the potential energy of cells rapidly increased to overcome the energy barrier and trigger the subsequent differentiation process. This assumption might explain why NSPCs can maintain stemness characteristics for a long time in vivo and they can alter their phenotype to differentiate under specific stimulation. Therefore, NSPCs possess both stability and differentiation capability in vivo, which is controlled by a high energy barrier.
To test our hypothesis, we designed two experiments to change the electrophoretic mobility to control the differentiation capability of NSPCs. As shown in Figure 7, the electrophoretic mobility of NSPCs could be increased at the alkaline environment because more dissociation of acidic functional groups of NSPCs led to more negatively charged surface. At this time, even in the presence of 2 % serum only, we could promote NSPC morphogenetic differentiation events by increasing the negative charge on the cell surface. In contrast, Figure 8 shows the electrophoretic mobility of NSPCs could be decreased by the treatment of neuraminidase to remove the negative charge of polysialic acid. Dissimilar to the alkaline treatment, the mature differentiation morphology in the presence of 10 % serum was inhibited. This is consistent with the previous studies that polysialic acid is a necessary permissive factor for axonal growth and neural precursor migration from the germinative zone [30,31]. Thus, this study provided an alternative to regulate the NSPC differentiation by controlling the cellular electrophoretic mobility.
Conclusion
In summary, we have examined how NSPC differentiation related to the electrophoretic mobility and the mobility profile against the culturing periods. When NSPCs need to change their phenotypes to differentiate, they require enough energy to process this phenotype alteration, and the energy change can be easily detected by using cell electrophoresis. Although the technique cannot determine the specific surface protein, it can reflect the net surface charge density of cell membrane and can serve as a useful research tool to assist in identification of NSPC differentiation. We expected this concept can provide a new vision for other types of cells when they need to change the cellular phenotypes to adapt to the environment.
Acknowledgments
The authors thank the Ministry of Science and Technology of the Republic of China for their financial support.
7422
References
- Gao J, Yao JQ, Caplan AI (2007) Stem cells for tissue engineering of articular cartilage. ProcInstMechEng H 221: 441-450.
- McKay R (1997) Stem cells in the central nervous system. Science 276: 66-71.
- Spradling A, Drummond BD, Kai T (2001) Stem cells find their niche. Nature 414: 98-104.
- Young TH, Hung CH (2003) Change in electrophoretic mobility of PC12 cells after culturing on PVA membranes modified with different diamines. J Biomed Mater Res A 67: 1238-1244.
- Wang CC, Lu JN, Young TH (2007) The alteration of cell membrane charge after cultured on polymer membranes. Biomaterials 28: 625-631.
- Korohoda W, Wilk A (2008) Cell electrophoresis--a method for cell separation and research into cell surface properties. Cell MolBiolLett 13: 312-326.
- Slivinsky GG, Hymer WC, Bauer J, Morrison DR (1997) Cellular electrophoretic mobility data: a first approach to a database. Electrophoresis 18: 1109-1119.
- Abercrombie M, Ambrose EJ (1962) The surface properties of cancer cells: a review. Cancer Res 22: 525-548.
- Johnson LA, Ferris JA (2005) Single cell electrophoresis in determining cell death: potential for use in organ transplant research. J BiochemBiophys Methods 63: 53-68.
- Li J, Mou X, Qiu J, Wang S, Wang D, et al. (2015) Surface charge regulation of osteogenic differentiation of mesenchymal stem cell on polarized ferroelectric crystal substrate. AdvHealthc Mater 4: 998-1003.
- Masui M, Takata H, Kominami T (2002) Cell adhesion and the negative cell surface charges in embryonic cells of the starfish Asterinapectinifera. Electrophoresis 23: 2087-2095.
- Kamiya A, Gonzalez FJ, Nakauchi H (2006) Identification and differentiation of hepatic stem cells during liver development. Front Biosci 11: 1302-1310.
- Brent TP, Forrester JA (1967) Changes in surface charge of HeLa cells during the cell cycle. Nature 215: 92-93.
- Wang JH, Wei CW, Liu HC, Young TH (2003) Behavior of MG-63 cells on nylon/chitosan-blended membranes. J Biomed Mater Res A 64: 606-615.
- Wang JH, Hung CH, Young TH (2006) Proliferation and differentiation of neural stem cells on lysine-alanine sequential polymer substrates. Biomaterials 27: 3441-3450.
- Tsai RY, McKay RD (2000) Cell contact regulates fate choice by cortical stem cells. J Neurosci 20: 3725-3735.
- Bottenstein JE, Sato GH (1979) Growth of a rat neuroblastoma cell line in serum-free supplemented medium. ProcNatlAcadSci U S A 76: 514-517.
- Draberova E, Lukas Z, Ivanyi D, Viklicky V, Draber P (1998) Expression of class III beta-tubulin in normal and neoplastic human tissues. Histochem Cell Biol 109: 231-239.
- Weclewicz K, Svensson L, Billger M, Holmberg K, Wallin M, et al. (1993) Microtubule-associated protein 2 appears in axons of cultured dorsal root ganglia and spinal cord neurons after rotavirus infection. J Neurosci Res 36: 173-182.
- Bignami A, Eng LF, Dahl D, Uyeda CT (1972) Localization of the glial fibrillary acidic protein in astrocytes by immunofluorescence. Brain Res 43: 429-435.
- Sommer I, Schachner M (1981) Monoclonal antibodies (O1 to O4) to oligodendrocyte cell surfaces: an immunocytological study in the central nervous system. DevBiol 83: 311-327.
- Mironov SL, Dolgaya EV (1985) Surface charge of mammalian neurones as revealed by microelectrophoresis. J MembrBiol 86: 197-202.
- Hung CH, Lin YL, Young TH (2006) The effect of chitosan and PVDF substrates on the behavior of embryonic rat cerebral cortical stem cells. Biomaterials 27: 4461-4469.
- Hung CH, Young TH (2006) Differences in the effect on neural stem cells of fetal bovine serum in substrate-coated and soluble form. Biomaterials 27: 5901-5908.
- Carpenter MK, Cui X, Hu ZY, Jackson J, Sherman S, et al. (1999) In vitro expansion of a multipotent population of human neural progenitor cells. ExpNeurol 158: 265-278.
- Ruegg UT, Hefti F (1984) Growth of dissociated neurons in culture dishes coated with synthetic polymeric amines. NeurosciLett 49: 319-324.
- Mingyu C, Kai G, Jiamou L, Yandao G, Nanming Z, et al. (2004) Surface modification and characterization of chitosan film blended with poly-L-lysine. J BiomaterAppl 19: 59-75.
- Camp JP, Capitano AT (2005) Size-dependent mobile surface charge model of cell electrophoresis. BiophysChem 113: 115-122.
- Durbec P, Cremer H (2001) Revisiting the function of PSA-NCAM in the nervous system. MolNeurobiol 24: 53-64.
- Nguyen L, Rigo JM, Malgrange B, Moonen G, Belachew S (2003) Untangling the functional potential of PSA-NCAM-expressing cells in CNS development and brain repair strategies. Curr Med Chem 10: 2185-2196.