Blake T. Dotta, Lukasz M. Karbowski, Nirosha J. Murugan, David A. E. Vares and Michael A. Persinger*
Biomolecular Sciences and Human Studies Programs, Quantum Biomolecular Laboratory, Laurentian University, Sudbury, Ontario, Canada
*Corresponding Author:
Michael A. Persinger
Biomolecular Sciences and Human Studies Programs
Quantum Biomolecular Laboratory
Laurentian University, Sudbury
Ontario, Canada
Tel: 01-705-675-4824
Fax: 01-705-671-3841
E-mail: mpersinger@laurentian.ca
Received date: 25 May 2016; Accepted date: 27 June 2016; Published date: 30 June 2016
Citation: Dotta BT. Ultra-weak Photon Emissions Differentiate Malignant Cells from Non-Malignant Cells In Vitro. Arch Can Res. 2016. 4: 2.
Keywords
Ultra-weak Photon Emissions (UPE); Breast cells; MDA-231; MCF-7; HEK; HSG; HBL-100; B16BL6; Melanoma; Malignancy; Cancer; Cell culture
Introduction
From an evolutionary perspective all of the energy and matter that comprise living cells and organisms originated from the Sun. Consequently the persistence of spontaneous photon emissions from all living systems should be expected [1,2]. Since the formulation of “mitogenetic” radiation almost 100 years ago by Gurwitch [3], “spontaneous” or ultra-weak photon emissions (UPE) have been reported by dozens of different research groups. Photon emissions have been measured from bacteria [4], cells [5], hippocampal slices in which electrophysiological activity has been induced [6], and even human cerebral activity [7]. The typical photon flux density is in the order of 10-12 W·m-2 which is equivalent to about 106 to 107 photons per second per meter squared.
Although there are multiple molecular reactions that can mediate these biophoton emissions, one major source is associated with the activity of the plasma cell membrane [8]. Dotta et al. [9], employing Cosic’s [10] resonance recognition model for molecules demonstrated that specific photon wavelengths (frequency bands) within the visible range from mouse melanoma cells were associated with specific molecular pathways. Inhibiting or facilitating these pathways chemically decreased or increased wavelength-specific photon emissions from these cells. Trushin [11] and Fels [12] have hypothesized that cells, including malignant forms, employ UPE as a major form of intercellular communication. This is particularly relevant to cancer research in light of the experiments by Murugan et al. [13] that demonstrated massive bursts of photon emissions in malignant cell cultures following injections of morphine. This compound can encourage metastases.
We have been pursuing novel techniques for the very early detection of cancer. Karbowski et al. [14] reported that differential photon emissions occurred in normal cells when only 1% of the population contained experimentallyintroduced malignant cells. Simple flux density of photon emissions is a scalar quantity and might be considered equivalent to monitoring the amplitude of a conversation in a group of people. It would not reveal the content of the conversation. Other techniques, such as spectral power density (SPD), might reveal differential distributions of the amplitude modulation of the flux density of photon emissions within specific increments of the low frequency band often associated with aggregates of cells. Here we report that the SPDs of UPE can differentiate malignant and non-malignant cell lines.
Methods and Materials
A total of 97 daily experiments (“trials”) utilizing 7 different cell lines were completed over the course of six months. The following cells were utilized: B16BL6 (murine melanoma), MDA231 (breast cancer), HBL100 (normal breast), HEK-293T (Human Embryonic Kidney cells), HSG (Human salivary gland), HeLa cell line (cervical cancer), and MCF7 (breast cancer). Cell cultures were maintained in 150 x 20 mm tissue culture plates in Dulbecco’s Modified Essential Medium accompanied with 10% fetal bovine serum, 100 μg/ml of streptomycin and 100 U penicillin/ml. Cells were incubated at 37 Deg C in 5% CO2 and subcultured 1:5 every 2-3 days. For each experiment approximately 1 million cells approaching 100% confluence were measured. Once cells reached confluence they were removed from incubation and transferred to the biophysics area.
Less than 2 minutes after removal from incubation a single plate of ~106 cells was placed over the ~3 cm2 aperture of a SENS-TECH LTD. Model DM0090C digital photomultiplier tube (PMT). Typical dark counts of this particular PMT were in the range of 1500 - 2000 photons per sec. Measurements were recorded by the system software every 20 msec for 100 seconds. The PMT was located inside a dark box in a darkened environment (<10-12 W·m-2). The dark box’s inner and outer surface has been painted black and was covered by 10 layers (8 cm) of thick cotton cloth.
Spectral analyses for raw photon counts were completed utilizing SPSS software. All 7 cell types were sampled at 50 Hz for 5000 points (100 seconds). Raw spectral data was then computed into 125 0.2 Hz bins (i.e., 0 Hz – 0.2 Hz = BIN1, 0.2 – 0.4 Hz = BIN2, etc.). All subsequent analyses were conducted utilizing SPSS 22 software. The primary rationale for selecting SPD as our measurement is that the general profile of photon emissions remains relatively stable within large ranges of the numbers of photon counts that can vary from trial to trial and cell type. Like a human conversation its content does not change appreciably if the volume is high or relatively low. Consequently limiting factors associated with different preparation of cells or the distance of the PMT sensor from the cell source become less critical.
Results
The grand mean and standard deviations for the raw counts were 3495 and 1206 photons per sec, respectively. The net value after subtracting between 1500 and 2000 counts per sec would reflect the photons generated by the aggregate of cells directly over the aperture of the photomultiplier unit. Although there was a trend for more photon emissions from malignant cells compared to non-malignant cells, the statistical significance was marginal. In the balance of probabilities this was due primarily to the marked variability in absolute photon counts between trials even when the values for the background (no-cells present) were accommodated. We have found that day-to-day variations in background photon counts occurred even when great care was taken to minimize extraneous light sources before the experiments were initiated.
Figure 1 displays the means and standard errors of the mean for the SPD (Spectral Power Density) values for the photon emissions for all malignant cells (human and mouse) vs non-malignant cells that exhibited the greatest differentiation. This figure represents the SPD of the peak ~22.1 Hz [t(95)=2.48, p<0.01]. All other frequencies peaks were not statistically significant. As predicted when all of the SPDs were combined for the two types of cells the malignant cells as a population displayed more power within a specific amplitudemodulated band compared to normal cells.
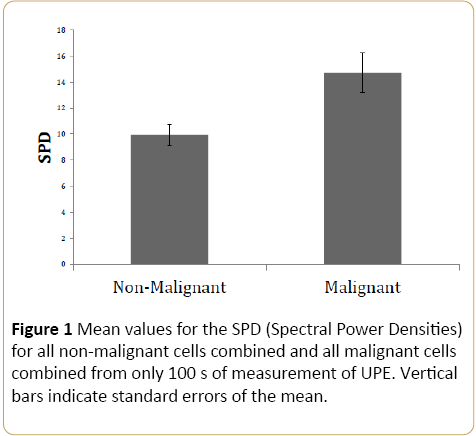
Figure 1: Mean values for the SPD (Spectral Power Densities) for all non-malignant cells combined and all malignant cells combined from only 100 s of measurement of UPE. Vertical bars indicate standard errors of the mean.
Because we have found in previous experiments that different cell types emit different flux densities of photons within the same settings, we compared the three types of human breast cell lines (malignant and normal) and the three human non-breast cells types. The discriminant function correctly classified 85% of the cell conditions accurately. Subset analyses and generalization of the function produced similar estimates of accuracy. The discriminant function was: [0.146 (5.6 Hz) + 0.191*(20.6 Hz)-(0.249*22.2 Hz)-0.836]. The prefix numbers indicate the unstandardized discriminant function coefficient; the last number indicates the “constant” for the function. This means that the breast cells, regardless of level of malignancy as a type of cell displayed enhanced photon flux spectral density at peaks of 5.6 Hz and 20.6 Hz with an adjacent diminished around 22.2 Hz (Figure 2).
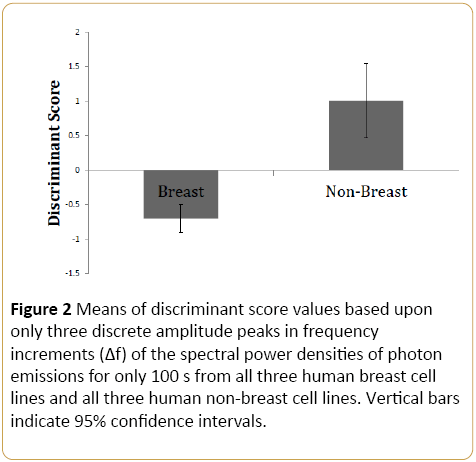
Figure 2: Means of discriminant score values based upon only three discrete amplitude peaks in frequency increments (Δf) of the spectral power densities of photon emissions for only 100 s from all three human breast cell lines and all three human non-breast cell lines. Vertical bars indicate 95% confidence intervals.
Figure 3 demonstrates the discriminant scores and the individual scores for each experiment for the non-malignant and malignant (human) breast cell lines only. The discriminant function was: [(0.169*1.2 Hz)-(0.46 (2.6 Hz)-0.30*17 Hz + 0.46 (19.8 Hz) + 0.265]. The numbers preceding the Hz values were the unstandardized discriminant function coefficients. The classification accuracy based upon these three Δf was 85%. Subset analyses of the data employing this function resulted in similar magnitudes of correct classification.
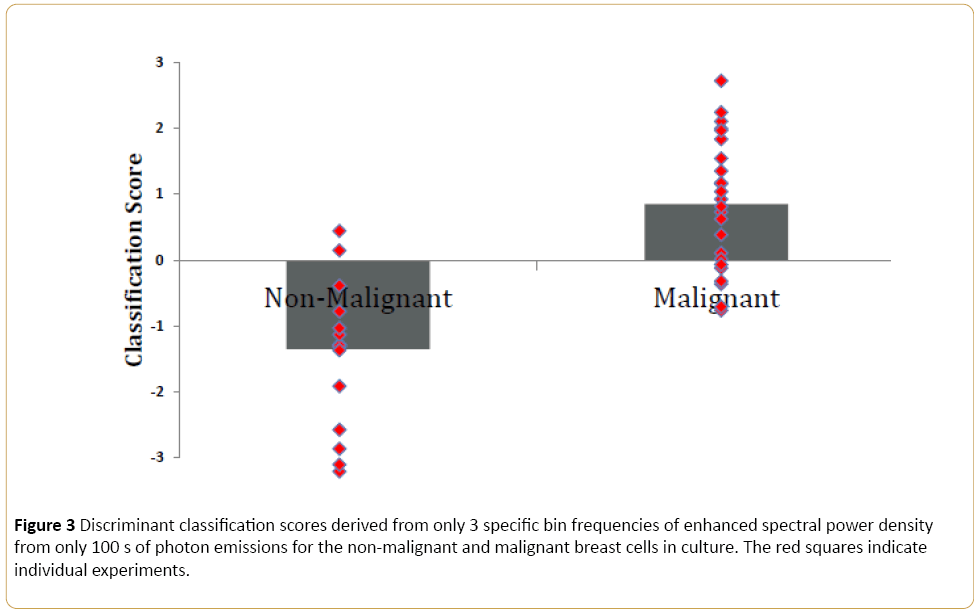
Figure 3: Discriminant classification scores derived from only 3 specific bin frequencies of enhanced spectral power density from only 100 s of photon emissions for the non-malignant and malignant breast cells in culture. The red squares indicate individual experiments.
Discussion
Living systems have been considered to be the cumulative aggregate of the energy conversion from solar radiance into biomolecular structures [1,2]. Recently Dotta et al. [9] who employed Cosic’s innovative model [10] for the photon energy equivalence of molecular structures showed that specific signalling pathways within the cells were associated with discrete wavelengths within the visible range of photons. One logical extension of this concept is that groups of cells should emit specific spectral density patterns, reflected by their amplitude modulations of the flux density or numbers of UPE that reflect their state and condition. Karbowski et al. [14] had shown that the presence (by experimental manipulation) of only 1% malignant cells in an otherwise normal population of cells enhanced UPE densities.
Previous experiments [5] have focused upon the absolute numbers of photons and protracted periods. Our approach is that this would be equivalent to measuring only the loudness of a group conversation. Spectral power densities would be more equivalent to discerning the “voice print” or frequency configuration of specific words and sentences. The advantage of employing SPDs rather than raw photon counts is that technical problems of distances from the photon source or baseline variability of the measurement devices (photomultiplier units) would not dominate the measurements. As a result very brief sampling (in this case only 100 s) is required to obtain a reliable indicator of whether or not the sources of the photons were either malignant or not according to current definitions of aberrance.
The physiological significance and molecular substrates of the specific Δf we observed in the present study must still be established.
Conclusion
We have observed in several other experiments involving cell culture, mice injected with melanoma cells, and human beings who are strongly suspected to be in the early stages of tumor development that a persistent enhancement of SPD occurs around 21 Hz for sampling rates of 50 Hz (where the Nyquist Limit is 25 Hz). Interestingly the lower frequency components of the power amplitude modulation (<2 Hz) even though they mediate a substantial portion of the total spectral power rarely differentiate malignant and non-malignant cells. Considering the relative minimal expense of modern digital photomultiplier units, the brief sampling durations required, and the remarkable potential of this technology to discern early stages of malignancy, we anticipate this method will soon become the method of choice by future oncologists.
Acknowledgements
We thank Dr. W. E. Bosarge and the Bosarge Family Organization for their contributions to this research. Particular appreciation is given to Dr. Robert M. Lafrenie and Dr. Carly Buckner for their tireless efforts in this challenging area. The intriguing challenges from Professor Elgin Ong have not been forgotten.
9813
References
- Popp FA (1979) Coherent photon storage of biological systems. In: Electromagnetic Bioinformation, Popp FA, Becker G, Konig HL, Peschka W (eds) Urban and Schwarzenberg: Munich, pp. 123-149.
- Persinger MA (2016) Spontaneous photon emissions in photoreceptors: potential convergence of Arrhenius reactions and the latency for rest mass photons to accelerate to Planck unit energies. J Adv Physics 11: 3529-3534.
- Gurwitch AG (1926) Das problem der zelltilung physiologish betrachtet. Springer: Berlin.
- Berzhanskaya LY, Berzhanskii VN, Beloplotova OY, Pilnikova TG, Metlyayev TN (1995) Bacterial bioluminescent activity as a pointer to geomagnetic disturbances. Biophys 40: 761-764.
- Takeda M, Tanno Y, Kobayashi M, Usa M, Ohuchi N, et al. (1998) A novel method of assessing carcinoma cell proliferation by biophoton emission. Cancer Lett 127: 155-160.
- Isojima Y, Isoshima T, Nagai K, Kikuchi K, Nakagawa H (1995) Ultra-weak biochemiluminesence from rat hippocampal slices. Neuro Report 6: 658-660.
- Dotta BT, Buckner CA, Lafrenie RM, Persinger MA (2011) Photon emissions from human brain and cell culture exposed to distally rotating magnetic fields shared by separate light-stimulated brains and cells. Brain Res 388: 77-88.
- Dotta BT, Buckner CA, Cameron D, Lafrenie RM, Persinger MA. (2011) Biophoton emissions from cell cultures: biochemical evidence for the plasma membrane as the primary source. Gen Physiol Biophys 30: 301-309.
- Dotta BT, Murugan NJ, Karbowski LM, Lafrenie RM, Persinger MA (2014) Shifting wavelengths of ultra-weak photon emissions from dying melanoma cells: their chemical enhancement and blocking are predicted by Cosic’s theory of resonant recognition model for macromolecules. Naturwissenschaften 101: 87-94.
- Cosic I (1994) Macromolecular bioactivity: Is it resonant interaction between macromolecules? Theory and application. IEEE Trans Biomed Engineer 41: 1101-1114.
- Trushin MV (2004) Light-mediated conversation among microorganism. Microbiol Res 159: 1-10.
- Fels D (2009) Cellular communication through light. PLos ONE 4(4): e5086.
- Murugun NJ, Dotta BT, Karbowski LM, Persinger MA (2014) Conspicuous bursts of photon emissions in malignant cell cultures following injections of morphine: implications for cancer treatment. Int J Cur Res 6: 10588-10592.
- Karbowski LM, Murugan NJ, Dotta BT, Persinger MA (2015) Only 1% melanoma proportion in non-malignant cells exacerbates photon emissions: implications for tumor growth and metastases. Int J Cancer Res Mol Mech 1: 2.